Smart Money Concepts (SMC) Trading: The Ultimate Beginner's Guide
Smart Money Concepts (SMC) is a trading methodology built on one principle: retail traders lose because they trade against institutions, whose large orders leave identifiable footprints on price charts. SMC traders read those footprints (market structure with BOS and CHoCH, order blocks, fair value gaps, liquidity sweeps) instead of lagging indicators like RSI or MACD, asking where institutions hunt liquidity.
Before the concepts, what they look like when an engine reads them — Quantum Algo Zeno on gold, Bitcoin and NAS100, exported straight from TradingView.



Indicators that prove themselves in public.
One engine, four precision tools — the Gold (XAU) Scalper, the institutional Gravity Zone, the Zeno momentum Oscillator, and Zeno Stocks for equities.
What Are Smart Money Concepts?
This Smart Money Concepts trading guide is a comprehensive resource covering the complete SMC methodology from foundational concepts to advanced trading setups. Topics include market structure analysis (BOS and CHoCH identification), order block detection and grading, Fair Value Gap classification and mitigation strategies, liquidity pool mapping and sweep trading, multi-timeframe confluence, session-based trading (London and New York kill zones), and complete trade management frameworks including entry triggers, stop loss placement, and take profit strategies using institutional targets.
Last verified: April 15, 2026
Smart Money Concepts (SMC) is a trading methodology built around one central principle: retail traders lose money because they trade against institutional players. Banks, hedge funds, pension funds, and market makers — collectively called "smart money" — control the overwhelming majority of volume in financial markets. They don't trade the way retail traders do. They can't simply click a button and buy millions of dollars worth of an asset at market price without moving price against themselves.
Instead, these institutions use sophisticated strategies to accumulate and distribute positions over time, and those strategies leave identifiable footprints on price charts. SMC trading is the practice of reading those footprints. Rather than relying solely on lagging indicators like RSI, MACD, or moving averages, SMC traders study raw price action through the lens of institutional behavior.
The methodology draws heavily from Inner Circle Trader (ICT) concepts and Wyckoff Theory, which have been studied in professional trading circles for decades. What makes SMC particularly relevant today is the accessibility of AI-powered tools that can detect these patterns automatically — making institutional-level analysis available to individual traders for the first time.
What is market structure in SMC?
Before you can trade any SMC concept, you must understand market structure — the backbone of every institutional strategy. Market structure tells you one critical thing: who is in control? Are buyers dominating (bullish structure) or are sellers dominating (bearish structure)?
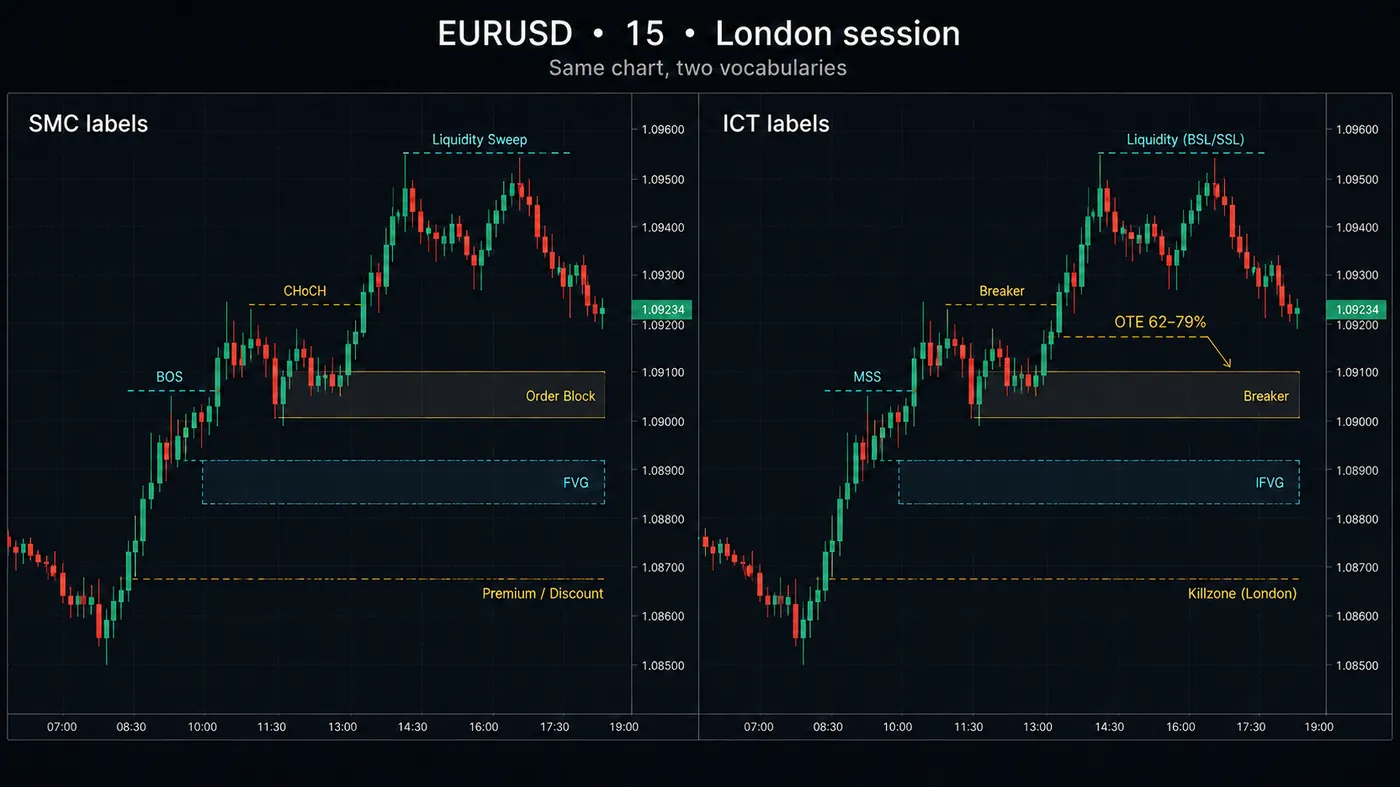
In SMC, market structure is defined by swing highs and swing lows. A bullish market makes higher highs (HH) and higher lows (HL). A bearish market makes lower highs (LH) and lower lows (LL). This seems simple, but here's what separates SMC traders: two specific signals identify when structure is shifting.
What is a break of structure (BOS)?
A Break of Structure confirms that the current trend is continuing. In an uptrend, a BOS occurs when price breaks above the most recent swing high — telling you that buyers remain in control.
What is a change of character (CHoCH)?
A Change of Character is the critical reversal signal. It occurs when price breaks a key structural level against the prevailing trend. In an uptrend, a CHoCH happens when price breaks below the most recent higher low — the first warning that buyers may be losing control.

Automate your trades. Let Quantum Algo trade for you.
Every signal executed on your own account — 24/7, hands-off.
The 6 Core SMC Concepts Every Trader Needs
Smart Money Concepts is built on six interconnected pillars. Click each card below to expand its explanation.
Order Blocks (OB)
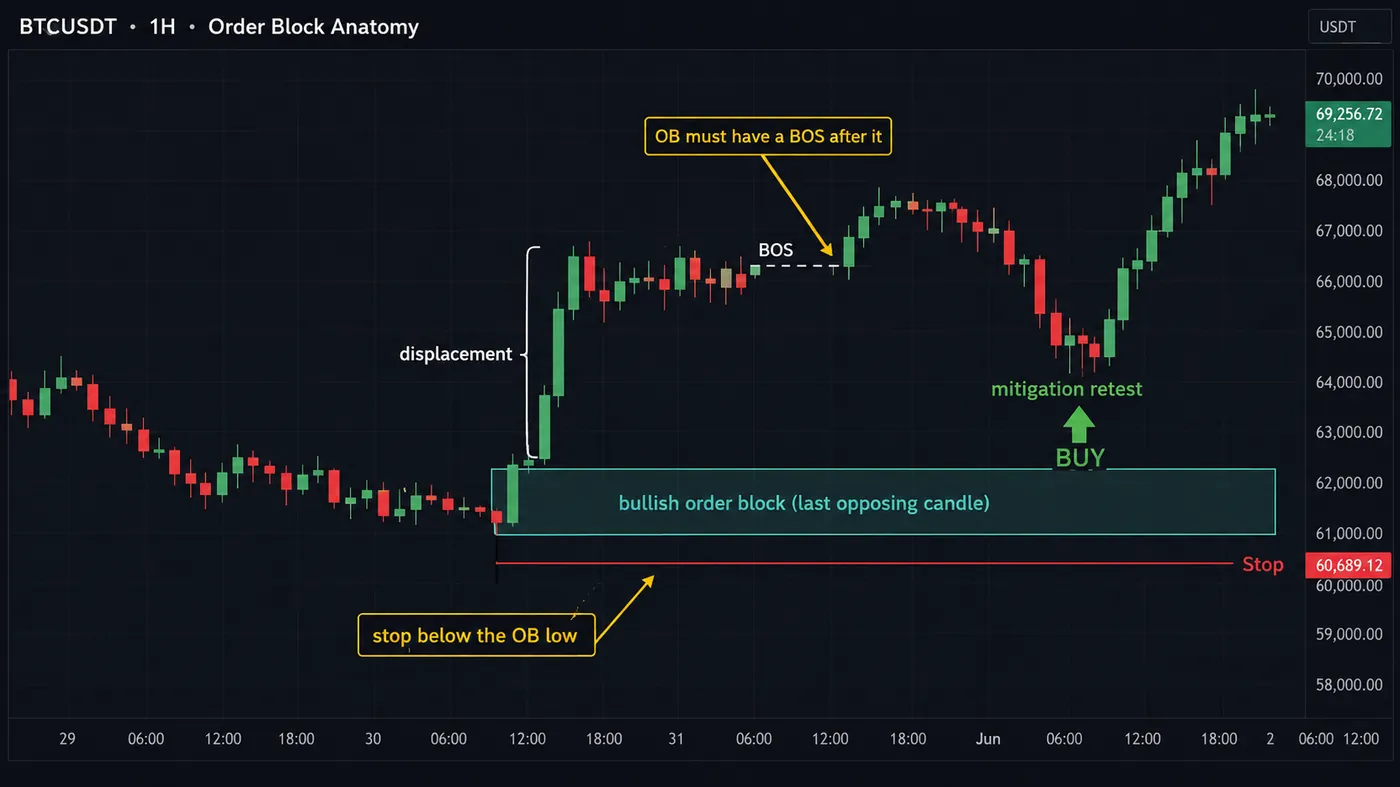
Order blocks are candle formations where institutions placed massive buy or sell orders. A bullish OB is the last bearish candle before a strong move up. These zones act as powerful support/resistance because institutions often return to "reload."
Fair Value Gaps (FVG)
FVGs form when price moves aggressively, creating a three-candle pattern with a gap between C1 and C3 wicks. This imbalance signals institutional urgency and price frequently returns to "fill" the gap.
Liquidity Sweeps
Institutions engineer moves to sweep stop-losses above swing highs (buy-side liquidity) or below swing lows (sell-side liquidity). A sweep followed by a reversal is one of the highest-probability setups.
Break of Structure
BOS confirms trend continuation. Price breaking the latest swing high/low means the trend side is still in charge. Helps you stay on the right side of the move.
Change of Character
CHoCH signals a potential trend reversal. When price breaks against the prevailing trend, it's the first clue that control is shifting. Combined with a liquidity sweep, offers exceptional R:R.
Breaker Blocks
When an order block fails, it becomes a breaker — flipping from support to resistance (or vice versa). Represents areas where trapped traders exit, creating exploitable liquidity.
What does a fair value gap look like on a chart?
The FVG is one of the most tradeable SMC patterns. It forms during aggressive moves and represents price inefficiency the market tends to revisit.
What are the three phases of the institutional cycle?
Every significant market move follows a predictable three-phase pattern. Understanding this cycle allows SMC traders to anticipate moves before they happen. Click each phase below.
Phase 1: Accumulation
During accumulation, institutions quietly build large positions within a tight range. The market appears to "chop" — frustrating retail traders into exiting. Volume is low, and equal highs/lows form the liquidity pools institutions will later exploit. The ranging market isn't doing nothing — it's setting a trap.
How do you trade Smart Money Concepts step by step?
Here's a practical, repeatable framework that brings all SMC concepts together.
Step 1: Identify the Higher-Timeframe Bias
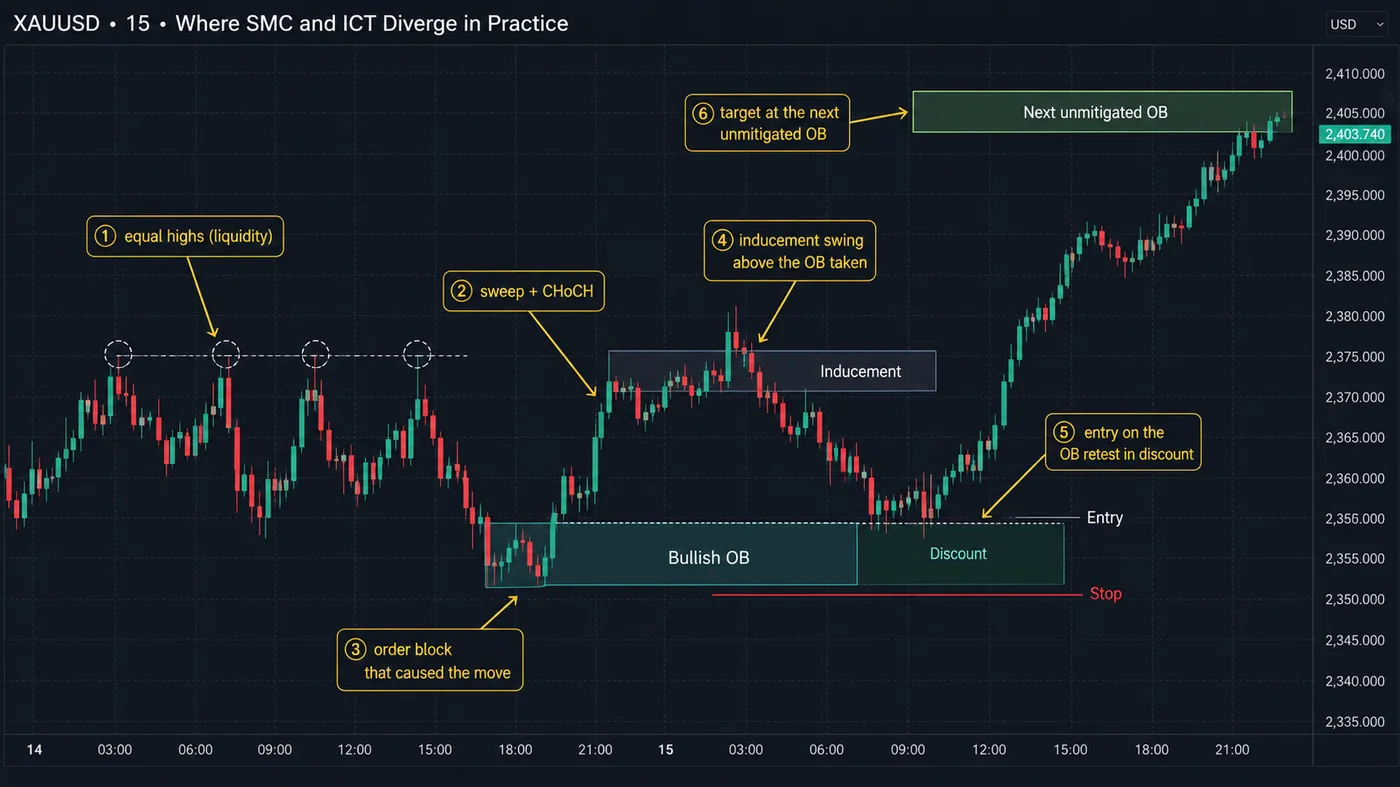
Open your Daily or 4-Hour chart and determine the market structure. HH+HL = bullish, only longs. LH+LL = bearish, only shorts. This single filter eliminates the majority of losing trades.
Step 2: Mark Key Liquidity Levels
Identify where liquidity sits: equal highs, equal lows, obvious swing points. These are the "magnets" price will be drawn toward.
Step 3: Wait for the Manipulation
Wait for price to sweep a liquidity level — a sharp move triggering stop-losses. Most retail traders get stopped out here. You're waiting for this exact moment.
Step 4: Drop to the Lower Timeframe for Entry
After the sweep, drop to 15M or 5M. Look for CHoCH on the lower timeframe. Enter at an order block or FVG aligned with HTF bias.
Step 5: Set Stop-Loss & Targets
Stop just beyond the liquidity sweep. Target the next HTF liquidity level. This naturally produces 1:3+ risk-to-reward ratios.
How does SMC differ from traditional technical analysis?
Understanding the contrast helps you see why traders are switching.
| Aspect | Traditional TA | Smart Money Concepts |
|---|---|---|
| Foundation | Indicators (RSI, MACD, MA) | Price action + institutional behavior |
| Signal Type | Lagging (confirms after) | Leading (anticipates before) |
| Liquidity | Ignored — sees S/R as static | Central — understands why S/R breaks |
| False Breakouts | Frustrating mystery | Expected and exploitable |
| Stop Hunting | Feels random | Predictable institutional behavior |
| Entry Precision | Broader zones — wider stops | Precise OB/FVG — tight stops |
| Risk:Reward | Typically 1:1 to 1:2 | Commonly 1:3 to 1:5+ |
| Best With | Multiple indicators | Multi-timeframe + AI tools |
The strongest approach today is a blend: SMC for context and entry precision, plus select indicators (ATR for volatility, VWAP for institutional confirmation) as supporting confluence.
◆ Interactive Quiz
Test Your SMC Knowledge
How should SMC traders manage risk?
Even the best SMC setup fails without risk management. Institutions win because they control their downside ruthlessly.
What is the 1-2% rule?
Never risk more than 1-2% of your total account per trade. With SMC's tight stops, this lets you take larger positions while keeping absolute risk low.
Where should an ATR-based stop loss go?
Use 1.5–2x ATR to ensure stops are beyond normal noise. If 1H ATR is 25 pips, stop at least 37–50 pips from entry, beyond the sweep level.
What is a maximum daily drawdown kill switch?
Set a hard daily loss limit of 3-5%. Hit it → stop trading. No exceptions. This prevents revenge trading spirals.
How does a tiered take-profit system work?
Take 50% at the first target (nearest FVG/OB), move stop to breakeven, let the remaining 50% run to the HTF liquidity target.
Best Tools & Indicators for SMC Trading
While SMC is price-action based, the right tools dramatically accelerate analysis. Specialized indicators surface order blocks, FVGs, and liquidity sweeps across timeframes in seconds.
What to Look For
The best SMC indicators automatically detect order blocks, FVGs, BOS, CHoCH, and liquidity levels on your chart. Look for multi-timeframe support and real-time alerts.
AI-powered suites lead today, combining traditional SMC detection with scoring engines that rank setups by probability.
Related guides: Order Blocks & FVGs Explained · Liquidity Sweeps & Stop Hunts · SMC vs ICT Concepts · How to Learn Trading
Quantum Algo’s free indicators draw the order blocks, fair value gaps and liquidity from this guide on any TradingView chart; Zeno adds confirmed Buy/Sell signals with the stop, TP1 and TP2 — $112.86 $79/mo, cancel anytime. Public calls are timestamped on TradingView, nothing deleted.
How do you build an SMC trading plan?
A structured trading plan is the bridge between understanding SMC theory and consistently profiting from it. Start by defining your higher-timeframe bias — use the daily or 4-hour chart to determine whether the asset is in a bullish or bearish structural trend. Only take trades that align with this bias. Next, identify your points of interest (POIs) — the specific order blocks, FVGs, and liquidity levels where you will look for entries on your lower timeframe.
Session timing matters enormously. The London and New York sessions produce the highest volatility and the most reliable SMC setups. The Asian session tends to build the liquidity that London and New York sessions then sweep. If you are trading forex or indices, focusing your attention on the London open (08:00–10:00 UTC) and the New York open (13:00–15:00 UTC) will expose you to the majority of high-quality setups while avoiding the choppy, low-volume periods where SMC signals are less reliable.
Finally, implement a risk management framework before you ever place a live trade. Risk no more than 1–2% of your account per trade. Use fixed fractional position sizing based on your stop-loss distance. Track every trade in a journal with screenshots, noting the SMC elements that supported your entry. After 50–100 trades, review your data to identify which setup types, sessions, and assets produce your best results. This data-driven approach is how professional traders refine their edge over time.
What are the common misconceptions about Smart Money Concepts?
One of the most widespread misconceptions is that SMC is a predictive system. It is not. Smart Money Concepts give you a probabilistic framework for understanding where institutions are likely to engage with the market. No setup works 100% of the time. What SMC provides is a structural edge — over a large sample of trades, the win rate and risk-to-reward ratio favor the trader who correctly identifies institutional activity. Expecting every order block to hold or every FVG to fill leads to frustration and overtrading.
Another common mistake is treating SMC as incompatible with traditional technical analysis. In reality, SMC is an evolution of price action analysis, not a replacement. Concepts like support and resistance, trendlines, and chart patterns still have value — they just gain additional context when viewed through the lens of institutional order flow. A support level that coincides with a bullish order block and resting sell-side liquidity below it is far more meaningful than a support level identified by a horizontal line alone.
Perhaps the most damaging misconception is that SMC is a shortcut to profitability. Like any methodology, it requires hundreds of hours of screen time, disciplined backtesting, and emotional control. The traders who succeed with SMC are the ones who treat it as a craft requiring continuous refinement, not a cheat code that prints money from day one. If you are willing to invest the time and follow a structured learning path, SMC offers one of the most logically coherent frameworks for understanding price action available today.
Related structure concept: breaker blocks — failed order blocks that invert into support or resistance.
Frequently Asked Questions
Yes. SMC is built on real market mechanics — institutional order flow, liquidity dynamics, and supply/demand principles from decades of research. It requires disciplined practice and proper risk management like any methodology.
Absolutely. SMC works across all liquid markets. Crypto actually shows cleaner patterns because it's 24/7 with higher retail participation, creating more exploitable liquidity pools.
Multi-timeframe analysis is essential. Daily/4H for bias, 1H for key zones, 15M/5M for precision entries. Higher TF sets direction, lower TF sets entry.
3-6 months of consistent study. Start with market structure and liquidity. Spend 2-3 months backtesting before risking real capital.
Not strictly. But specialized SMC indicators dramatically speed up analysis by auto-detecting OB, FVG, BOS, CHoCH, and liquidity levels across timeframes.
ICT is Michael Huddleston's specific methodology. SMC is the broader umbrella including ICT and similar approaches. The overlap is so large they're often used interchangeably.
Institutional order flow leaves specific footprints on the chart including large displacement candles creating Fair Value Gaps, order blocks at the origin of impulsive moves, and liquidity sweeps that precede major reversals. You can identify these manually or use automated tools like Quantum Algo which detects all SMC elements in real time on TradingView.
A Fair Value Gap is a three-candle price imbalance where the wick of candle one and the wick of candle three do not overlap. The gap represents an area where institutional orders moved price so aggressively that no two-way market existed. Price tends to return to fill these gaps approximately 70 to 80 percent of the time on the 1-hour timeframe and above.
SMC and traditional TA serve different purposes. Traditional indicators like RSI and MACD are lagging and publicly available to all traders, providing no unique edge. SMC focuses on reading the footprints of institutional order flow which drives 80 percent of price action. Many professional traders find SMC provides higher probability setups because it addresses the why behind price movement rather than just the what.
Continue Your Learning Path
References & Related Guides
More in this topic
- Liquidity Sweeps — Free Liquidity Sweep Indicator for TradingView (Buy-Side and Sell-Side Liquidity, Stop Hunts)
- Fair Value Gaps + Inversion FVG — Free FVG Indicator for TradingView (Gap Lifecycle, IFVG Signals, Multi-Timeframe)
- Order Blocks with Volume — Free Order Block Indicator for TradingView (Volume-Graded Zones, Mitigation, Breakers)
- Smart Money Concepts Engine — Free SMC Indicator for TradingView (Structure, Order Blocks, FVG, Liquidity, Confluence Score)
- Fundamental vs Technical Analysis: Which Answers Your Question (and Where Smart Money Concepts Sits)
- What Is Institutional Trading? How Big Orders Move Markets (and Leave Footprints)
- What Is Trading? How Markets, Trades and Traders Actually Work
- Who Is ICT (Michael J. Huddleston)? The Trader Behind Killzones, FVGs and the 2022 Model
- Premium and Discount Zones: Complete Guide
- Inducement Trading — Trap Liquidity Explained
- Optimal Trade Entry (OTE): Complete Guide
- BOS & CHoCH: Complete Market Structure Guide
- Breaker Block Trading — 5-Condition Complete Guide
- Displacement Trading — SMC Institutional Conviction Guide
- Fair Value Gaps (FVG): Complete Trading Guide
- ICT Silver Bullet Strategy: The Complete Guide
- ICT Trading Strategy: Complete Interactive Guide
- Liquidity Sweep Trading: Stop Hunts Explained
- Liquidity Trading Guide — Raids & Kill Zones
- Order Blocks Trading: Complete Guide
- Order Flow Trading — Read the Footprint of Institutions
- What Is a Market Structure Shift (MSS) in Trading?
- Free Smart Money Concepts Guide (PDF & Kindle)
- Higher Timeframe Bias (HTF) Guide
Core reading
- Best TradingView Indicators — Complete Guide
- Risk Management in Trading — Complete Guide
- Candlestick Patterns Guide — Engulfing, Pinbar & More
- All Premium Guides
- Quantum Algo on TradingView
- Public Track Record
Authoritative sources
For a focused comparison, read the BPR inside SMC before applying the setup.