PD Array
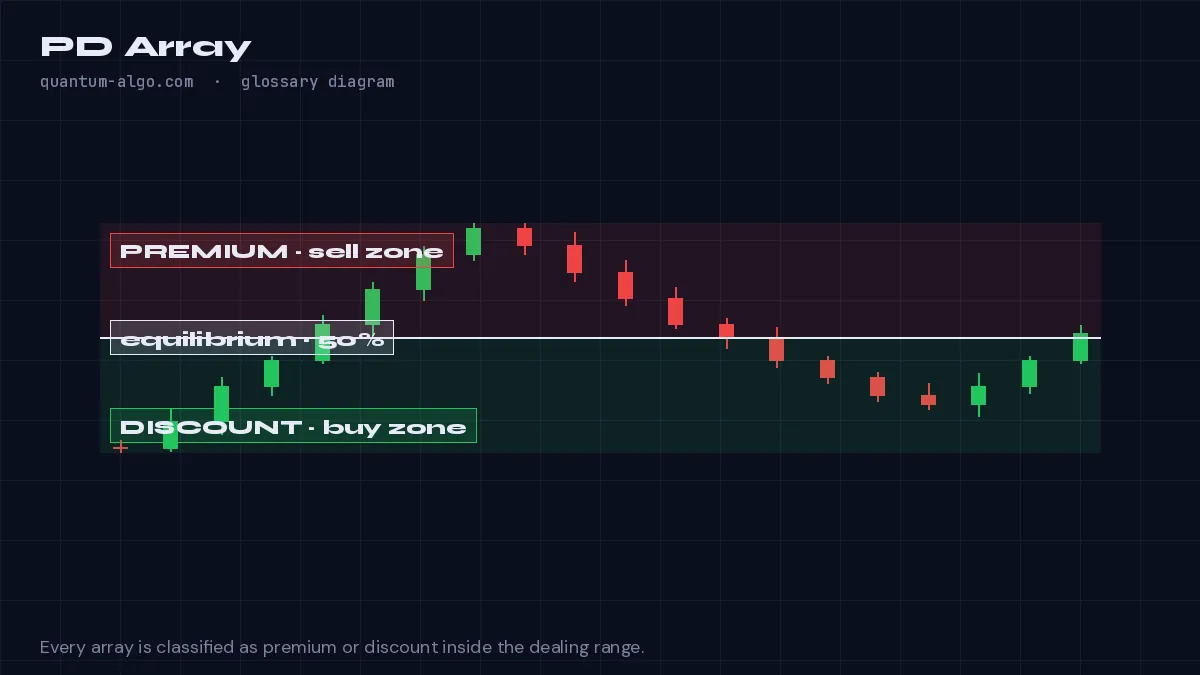
A PD array is any Smart Money price level that can act as a point of interest — order block, fair value gap, breaker, liquidity void, old high or low — ranked by where it sits in the premium or discount half of the dealing range.
What it means
ICT groups every tradeable reference into the PD array (premium/discount array): order blocks, breakers, mitigation blocks, fair value gaps, liquidity voids, rejection blocks, old highs and lows, and equilibrium. The array is a checklist of what price can react to, and the premium/discount label tells the trader which side of the range each reference is valid on.
The practical use is target and entry selection. In a bullish dealing range, discount PD arrays (a bullish order block or FVG below equilibrium) are entries; premium PD arrays (old highs, bearish gaps) are targets. Reverse it for a bearish range. Price is expected to move from one array to the next.
The matrix also provides a hierarchy: an order block with an FVG inside it in discount is a stronger array than a lone gap; a breaker that also sits at an old low is stronger than either alone. The Smart Money Concepts Engine's Confluence Score is a numerical version of this ranking.
How to identify it on a chart
- Draw the dealing range and its equilibrium.
- List every order block, gap, breaker and old high/low above and below equilibrium.
- Entries come from arrays in discount (bullish) or premium (bearish); targets are the arrays on the opposite side.
Worked example
Bullish 4-hour range: a bullish order block at the 30% level and an FVG at 42% are discount arrays — entries. An old high at 88% and a bearish FVG at 95% are premium arrays — targets.
See it on the chart, read it in depth
Frequently asked questions
What does PD stand for?
Premium and discount — the two halves of the dealing range that every array is classified into.
Which PD array is strongest?
Confluence wins: an order block containing a fair value gap at a swing point in deep discount is stronger than any single array.
Do PD arrays repaint?
The levels are historical, so no; what changes is whether they remain unmitigated.
Is the PD array the same as support and resistance?
It is the SMC version: specific institutional references rather than horizontal lines drawn at touches.
Related terms
See PD Array on your TradingView chart
Zeno reads Smart Money structure across timeframes and prints the entry, stop and targets — with a public record of every posted trade. The free indicators draw the concepts this page defines.