Fundamental vs Technical Analysis: Which Answers Your Question (and Where Smart Money Concepts Sits)
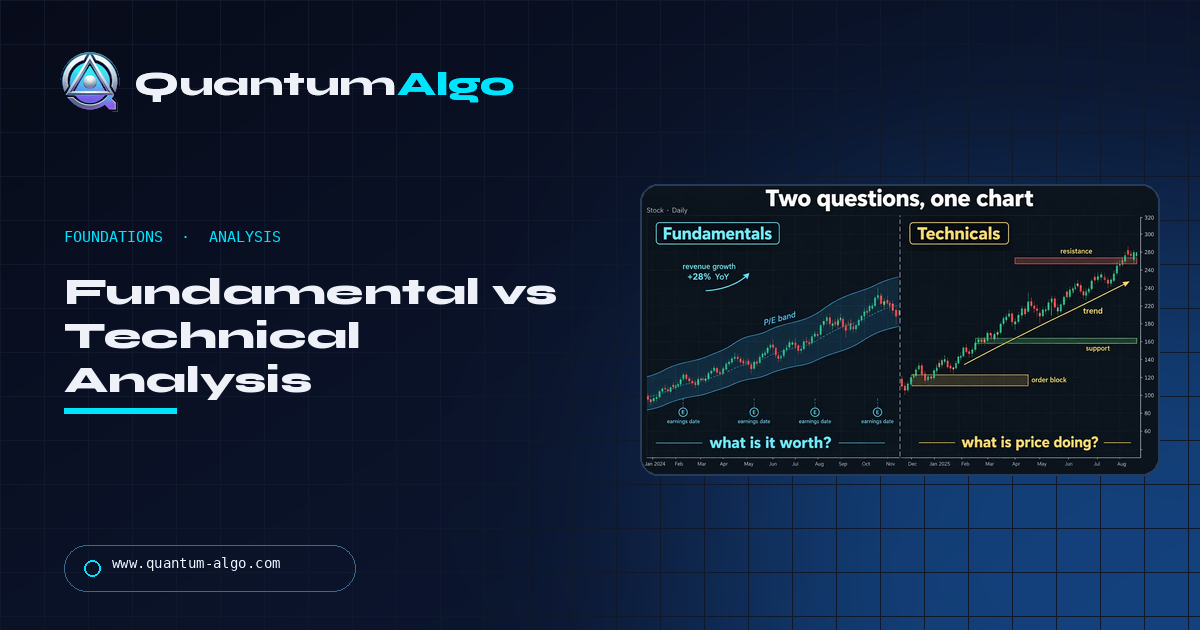
Fundamental analysis asks what an asset is worth — earnings, cash flow, rates, supply and demand — and trades the gap between value and price over months and years. Technical analysis asks what the price is doing — trend, levels, structure, order flow — and trades probabilities over minutes to weeks. Neither is better; your holding period decides which one has time to matter. Swing traders use fundamentals for direction and technicals for entries and stops.
This is not a referee's decision between two camps. It is the map of when each tool answers the question you are actually asking — value or timing — why scalpers are technical and investors are fundamental without either being wrong, how to use both without letting a day trade become an investment, and where Smart Money Concepts sits: technical, but built on the fact that institutional decisions have to be executed and leave footprints. The picker below returns the mix for your holding period.
Indicators that prove themselves in public.
One engine, four precision tools — the Gold (XAU) Scalper, the institutional Gravity Zone, the Zeno momentum Oscillator, and Zeno Stocks for equities.



What is the difference between fundamental and technical analysis?
Fundamental analysis asks what an asset is worth — earnings, cash flow, interest rates, supply and demand — and trades the gap between that value and the price. Technical analysis asks what the price is doing — trend, levels, structure, the footprints of large orders — and trades the probability that recent behaviour continues or reverses. They answer different questions, they work on different timeframes, and the honest reason most short-term traders are technical is not that fundamentals do not matter; it is that they do not change every fifteen minutes. The two-question illustration in this guide puts both on the same stock chart.
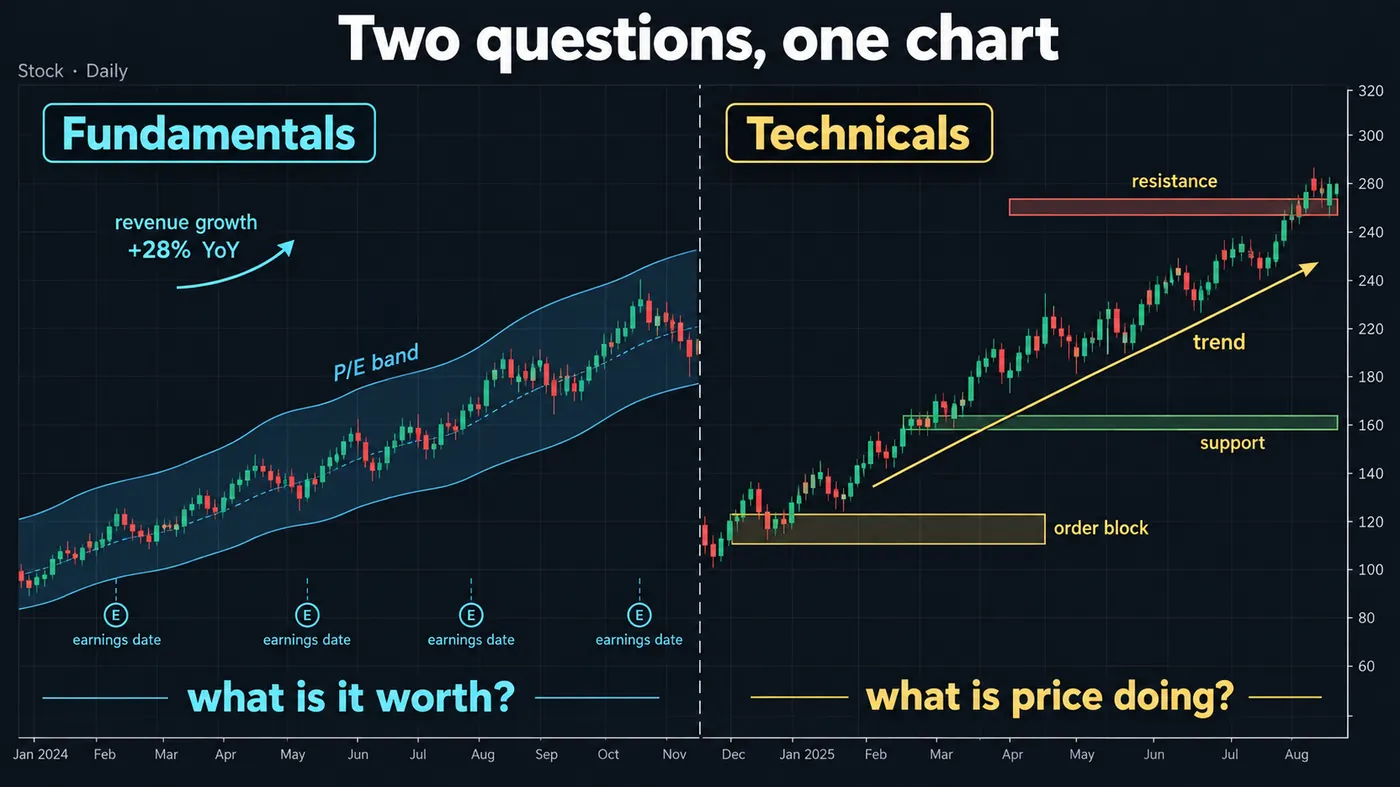
This page is not a referee's decision. It is the map of when each tool answers the question you are actually asking — and where Smart Money Concepts, the method this Academy teaches, sits inside the technical half.
What fundamental analysis does
Fundamental analysis builds an estimate of value from information outside the chart. For a stock: revenue, margins, growth, debt, the multiple the market pays for earnings, and the macro backdrop. For a currency: interest-rate differentials, inflation, growth, trade flows. For gold: real yields, the dollar, central-bank buying. For crypto: adoption, protocol revenue, supply schedules, and, honestly, flows.
It is slow by construction. A company reports four times a year; a central bank meets eight. The information changes on a schedule and price adjusts around those dates, which is why a fundamental view is a view about months and years. Its strength is that it explains why an asset should move. Its weakness for a trader is that it says nothing about when, and being right about value and early by a year is indistinguishable from being wrong.
What technical analysis does
Technical analysis reads price itself, on the assumption that everything known is already expressed in it and that participants behave in repeatable ways. Within it there are three families: indicators (moving averages, RSI, MACD — mathematical transforms of price), patterns (head and shoulders, triangles, candlestick shapes), and price action (structure, support and resistance, order flow).
It is fast and it is timeframe-agnostic: the same reading applies to a 5-minute chart and a weekly one. Its strength is timing and risk definition — a level where the idea is wrong is a stop, and a stop is the thing fundamental analysis never gives you. Its weakness is that it cannot tell you why; a technical trader on the wrong side of a rate decision has a chart that looked fine until it didn't.

Automate your trades. Let Quantum Algo trade for you.
Every signal executed on your own account — on your account, with the plan you define.
Timeframe decides the tool
The axis illustration in this guide is the most useful picture on the page: technical analysis dominates from minutes to weeks, fundamental analysis from months to years, and they overlap in the swing-trading zone where both are used. Scalpers and day traders are technical because nothing fundamental changes inside their holding period. Investors are fundamental because charts do not forecast a company's 2030 earnings. Swing traders use fundamentals for direction and technicals for entry, which is the most common professional combination and the one most retail "which is better" arguments miss.
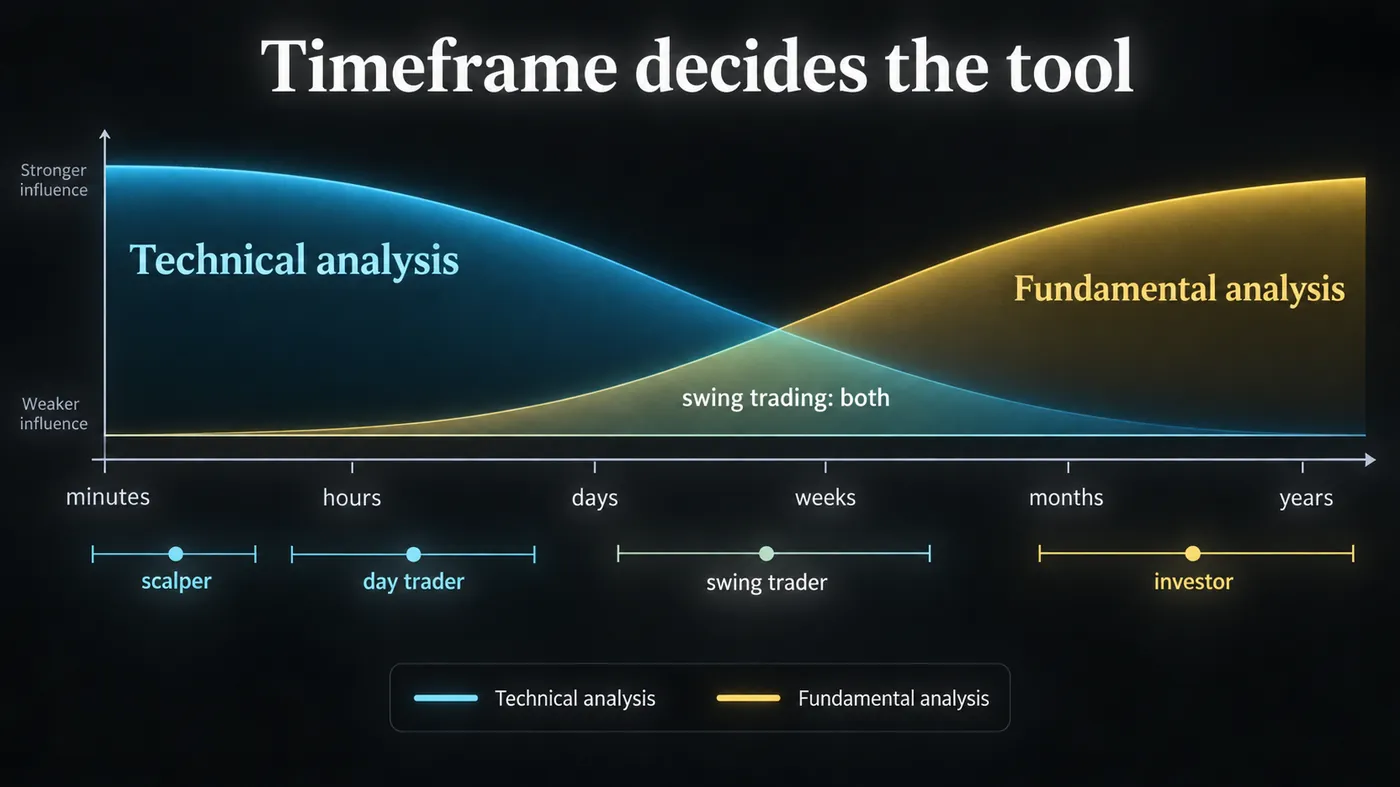
Put differently: the question is not which analysis is right. It is how long you intend to hold, and that decides which information has time to matter.
Where Smart Money Concepts sits
The tree illustration in this guide places it: technical analysis → price action → Smart Money Concepts, which reads order blocks, liquidity and market structure. SMC is technical, but it is built on a fundamental idea — that large institutions with real information have to execute size, and that execution leaves footprints on the chart. In that sense it is where fundamentals become price: the institution did the valuation work, and the order block is where the result was bought.
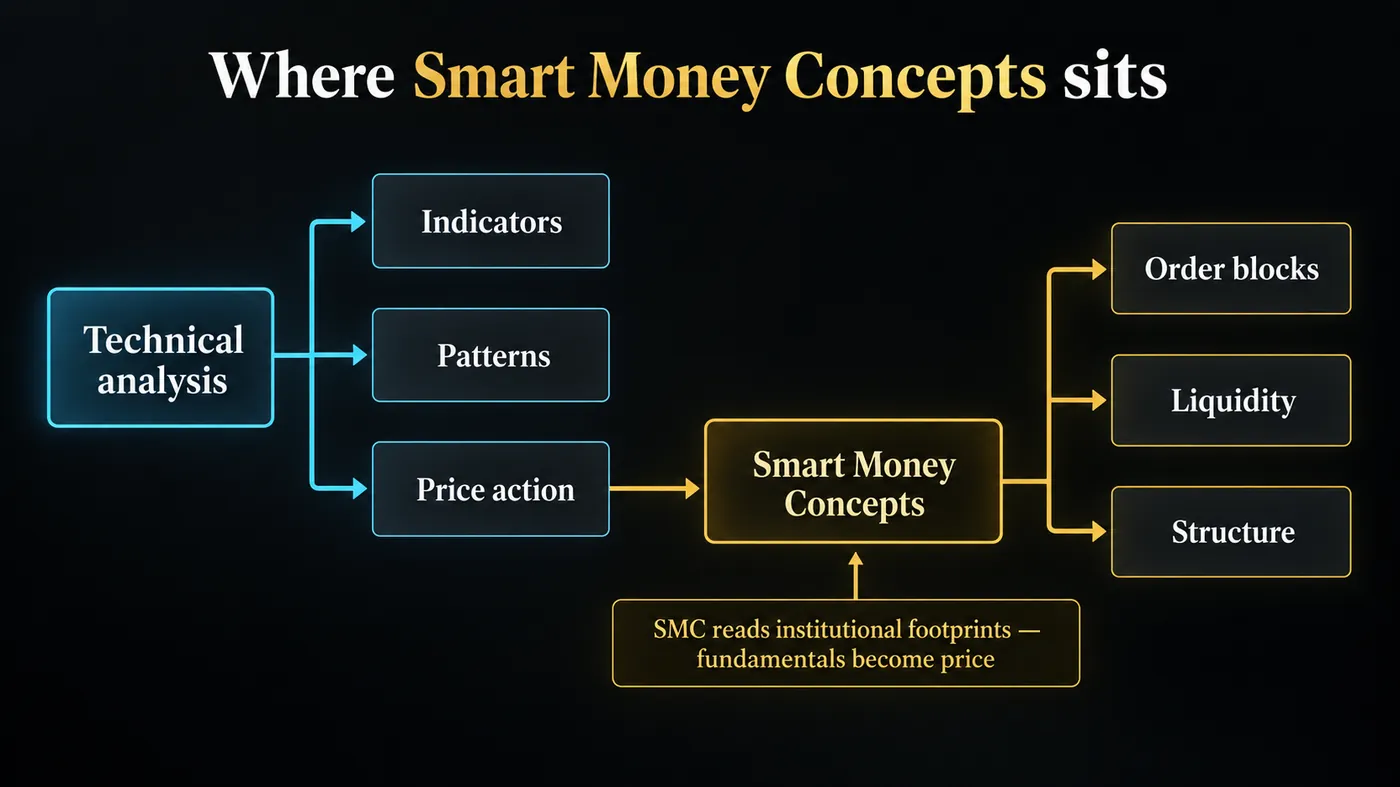
That is why Quantum Algo teaches it. It does not require you to out-analyse a fund on earnings; it requires you to recognise where the fund's order was filled and to trade the return to it with a defined stop.
Using both without confusing them
- Direction from the higher timeframe, entries from the lower. A fundamental or weekly-chart bias sets which way you look; the 15-minute structure tells you where.
- Know the calendar. Earnings, central-bank meetings, CPI, payrolls — the moments fundamental information arrives and technical levels stop working for an hour. Flatten or widen stops before them.
- Do not trade fundamentals intraday. A good earnings report is priced in the first minute; what you are trading after that is the reaction, which is a technical event.
- Do not hold a technical trade on a fundamental hope. The stop is the stop. "But the company is undervalued" is how a day trade becomes an investment.
Which one for you
The picker on this page asks three questions — holding period, market, time available — and returns the mix that fits. Broadly: minutes to days, technical; weeks, both; months and up, fundamental with technical entries. If you have a full-time job and an hour a day, you are a swing trader and you need both, in that order.
Fundamental analysis answers "what is it worth" over months and years; technical analysis answers "what is price doing" over minutes to weeks and gives you a stop. Your holding period decides which has time to matter. Swing traders use both with the roles kept separate — bias from the higher timeframe, entries from structure — and Smart Money Concepts sits inside the technical half, reading where institutional decisions were executed.
◆ Interactive check
Which question are you asking?
Questions people ask about fundamental and technical analysis
Neither in general. Fundamental analysis answers "what is it worth" over months and years; technical analysis answers "what is price doing" over minutes to weeks. Match the tool to your holding period.
Execution desks use it constantly — VWAP, volume profile, levels — because their job is timing. Portfolio managers lean fundamental. Most professional short-term traders are technical; most long-term allocators are fundamental.
Yes, and swing traders usually do: fundamental or higher-timeframe bias for direction, technical structure for entries, stops and targets. The rule is to keep the roles separate.
Technical — it reads price structure — but it is built on the premise that institutional execution leaves footprints, which is where fundamental decisions become visible on a chart.
Yes; arguably better than in most markets, because crypto has fewer scheduled fundamental events and participants rely heavily on the same levels. The structure Zeno marks on the BTC chart above is the same structure it marks on gold.
As reliable as the trader's process. It gives probabilities and stops, not certainties; measured over many trades with fixed risk, technical setups have documented edges. Read without a stop or a record, it is pattern-spotting.
For intraday, only the calendar — rate decisions, CPI, payrolls — so you are not in a trade when the level stops mattering. For swing trading, the rate differential and central-bank stance set the bias worth trading in.
Rules derived from data, tested statistically — it can use technical inputs (prices) or fundamental ones (earnings, rates). Our quantitative trading guide covers it; most retail quant strategies are technical.
Technical, for one practical reason: it gives you a stop. A beginner with a defined risk survives long enough to learn; a beginner with a valuation thesis and no stop often does not.
It doesn't, directly. Zeno reads structure — the footprints of institutional execution — which is where fundamental decisions have already become price. Subscribers who swing trade add a higher-timeframe bias of their own.
References & Related Guides
Read next
- Koyfin Review (2026): A Bloomberg-Lite for Fundamentals — and Where Traders Should Still Use TradingView
- What Is Trading?
- Smart Money Concepts Guide
- What Is Quantitative Trading?
- What Is Institutional Trading?
- Multi-Timeframe Analysis
- How to Start Trading
Authoritative sources
- SEC Investor.gov: fundamental analysis
- CFA Institute: technical analysis (refresher reading)
- Investopedia: fundamental vs technical analysis
- CME Group: technical analysis education
- Federal Reserve: FOMC calendar (fundamental events)