Smart Money Concepts Engine [Quantum Algo]
The whole SMC toolkit on one chart — structure on two tiers, volume-graded order blocks, fair value gaps with inversion, liquidity sweeps, premium/discount — scored 0–100 and narrated in plain language. Closed bars only; nothing repaints.
The short answer
The Smart Money Concepts Engine is a free, open-source TradingView indicator that puts the whole SMC toolkit on one chart — market structure (Break of Structure and Change of Character on two tiers), order blocks graded by volume, fair value gaps with inversion tracking, equal highs and lows with sweep detection, and a premium/discount map — and then does the thing drawing tools don't: it scores how much of it lines up right now, from 0 to 100, and writes the current market read in plain language on a dashboard. Everything is evaluated on closed bars, so nothing repaints, and every point of the Confluence Score is traceable to a visible condition. It is the free companion to the Smart Money Concepts guide on this site and the open-source cousin of the Zeno engine behind our public track record.
Structure (BoS/CHoCH ×2 tiers), volume-graded order blocks, FVGs + inversions, EQH/EQL + sweeps, premium/discount, score-stamped zone taps.
Five visible conditions, weighted 25/25/20/15/15 → 0–100. Above 80 nearly everything aligns; below 50 the setup is thin.
No — closed bars only; pivot lag equals the structure length by design.
What it draws
Swing structure
Confirmed swing highs and lows from a symmetric pivot; a close through a swing level prints a Break of Structure (BoS) with the trend or a Change of Character (CHoCH) against it, with lines and labels.
Internal structure
The same logic on a shorter lookback, drawn as compact markers, tracked as a second, independent bias.
Order blocks
On every swing break, the origin candle of the move (the last opposite candle before the impulse) projected forward as a demand or supply zone, labelled with the relative volume of that candle ("Demand · 1.8× Volume"). Zones brighten on first touch and are removed when price closes through them.
Fair value gaps and inversions
Three-candle imbalances above a minimum ATR size, boxed; a close through a gap flips it into an inversion zone acting from the other side; a second violation removes it. Drawing is off by default for a clean chart, but the gaps still feed the score.
Liquidity
Equal highs (EQH) and equal lows (EQL) as resting lines; a wick through with a close back inside is a sweep: the line is struck through, relabelled, and the event feeds the score. Single-pivot stop hunts are detected the same way, with per-level memory so a level never stacks duplicate labels.
Premium and discount
The range between the last confirmed swing high and low mapped into premium, equilibrium and discount, tinted deeper in the extreme quartiles.
Zone-tap signals
When price returns to a fresh zone while both structure tiers agree and price is on the correct side of equilibrium, a signal prints stamped with the live Confluence Score; high scores get the accent colour.
The dashboard
Swing bias, internal bias, last event, range position as a percentage, liquidity status, fresh demand and supply counts, imbalance count, the Confluence Score with a strength meter, and the narrative ("Bullish structure — sell-side taken — price in discount — demand below").
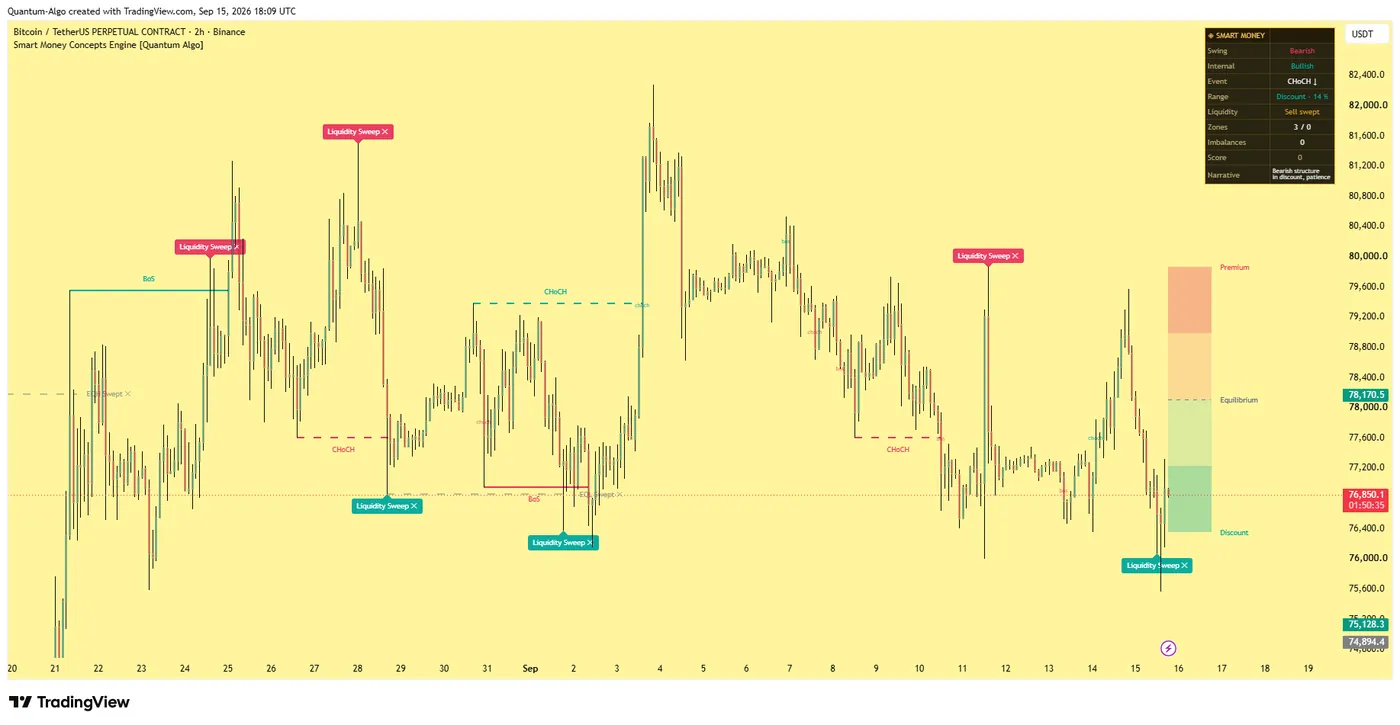
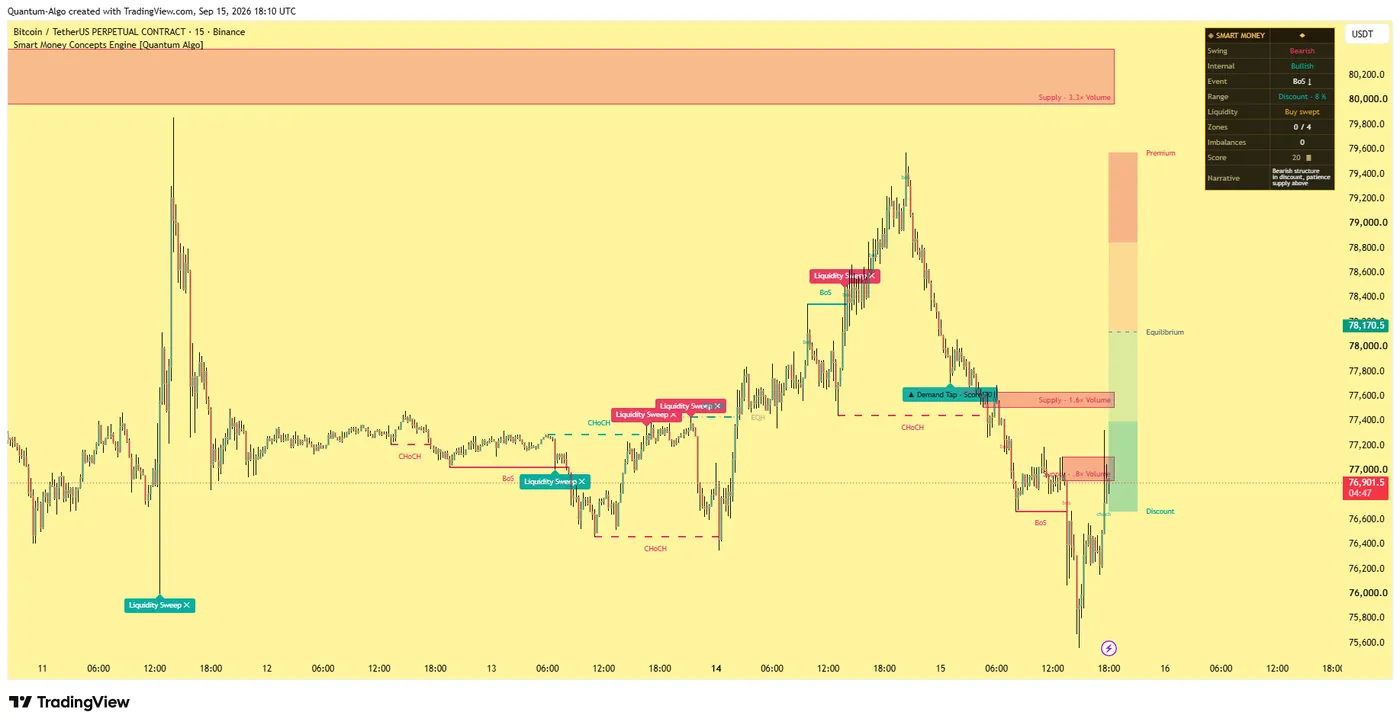
The two chart screenshots on this page are the engine on Bitcoin, 2-hour and 15-minute: the same logic at two scales, the dashboard readable on both.
The Confluence Score, explained
The score is a transparent sum of five weighted conditions, not a prediction:
Swing and internal bias agree
Price on the correct side of equilibrium for the bias
An unmitigated, volume-graded zone within reach
A fair value gap or inversion supports the read
Liquidity taken in the supportive direction
Above 80 means nearly everything aligns; below 50 means the setup is thin. The score measures how much of the Smart Money checklist is currently true — a context meter, not a probability of profit — and because each condition is visible on the chart, you can always see why the number is what it is.
How detection works
Market structure. Pivots are confirmed with a symmetric lookback (the Swing Structure Length and Internal Structure Length inputs). A candle close beyond a confirmed swing level is the event; wicks do not count. BoS continues the current bias, CHoCH flips it. All events are evaluated on closed bars only.
Order blocks. On a swing break, the engine steps back over the impulse to the last opposite-close candle and projects its range forward. The relative volume of that candle against its recent average becomes the zone's grade. Zones live until price closes through them.
Fair value gaps. A bullish gap forms when a bar's low sits above the high from two bars earlier (bearish is the mirror), and only gaps above the Minimum Gap Size (an ATR ratio) are kept. A close through a gap converts it to an inversion zone; a second close through removes it.
Liquidity. Consecutive swing highs or lows within the tolerance form EQH/EQL lines that follow price. A wick through with a close back inside is a sweep; a clean close through is a break, not a sweep, and retires the level. Sweep memory and a cooldown prevent duplicate labels at the same level.
Premium and discount. The last confirmed swing high and low define the range; the dashboard reports the live position as a percentage.
Settings
| Group | Input | What it does | Where to start |
|---|---|---|---|
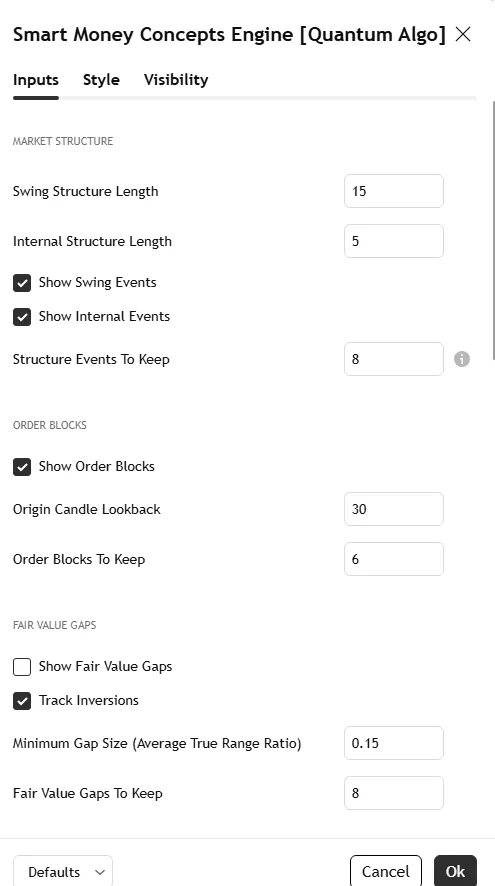
| Market structure | Swing Structure Length | Pivot lookback for the swing tier | 15 (chart default) |
| Internal Structure Length | Pivot lookback for the internal tier | 5 | |
| Show Swing / Internal Events, Structure Events To Keep | Drawing toggles and cap | on / on / 8 | |
| Order blocks | Show Order Blocks, Origin Candle Lookback, Order Blocks To Keep | Detection and cap | on / 30 / 6 |
| Fair value gaps | Show Fair Value Gaps, Track Inversions, Minimum Gap Size (ATR ratio), Fair Value Gaps To Keep | Drawing off by default; inversion on; size filter | off / on / 0.15 / 8 |
| Liquidity | Equal level tolerance, Levels To Keep | How close highs/lows must be to count as equal; cap | default / 6 |
| Premium/discount | Show map, extension | The range map and how far it projects | on |
| Signals | Zone-tap signals, Signals To Keep | The score-stamped markers and cap | on / 6 |
| Style | All chart colours; dashboard position, four text sizes, title band, background, frame, grid, three text colours | Fully themeable | — |
The settings screenshot on this page shows the first tab as it opens.
Alerts
Nine named conditions: Bullish and Bearish Break of Structure, Bullish and Bearish Change of Character, Buy-Side and Sell-Side Liquidity Sweep, Demand Zone Tap and Supply Zone Tap (score-stamped), and Fair Value Gap Inversion. Create an alert on the indicator and pick the condition; the zone-tap alerts carry the score in the message, so a webhook can filter on it.
How to read the dashboard
Top to bottom, in the order an institutional-style trader asks: What is the structure doing on both tiers? What was the last event? Where is price in the range? Has liquidity been taken? How many fresh zones and imbalances are near? How much of it stacks — the score. Then the narrative sentence, which is the same information in the words you would use to explain the chart to someone else.
The highest-quality condition, which the score is built to find, is full alignment: both tiers agree, a sweep has occurred against the move, price is on the correct side of equilibrium, and a fresh volume-graded zone waits nearby.
Three ways to use it
1. The zone-tap entry. Wait for a signal above 70. Check the narrative agrees with your higher-timeframe read. Enter on the retest of the zone with the stop beyond it and the first target at the liquidity the dashboard names; our order-block guide covers the entry models and the stop-loss page covers where the stop goes.
2. The bias filter. Run the engine on the 4-hour or 2-hour chart only for its two bias readings and the range position; take entries from a faster chart (or from the free Order Blocks with Volume and Liquidity Sweeps indicators) in the direction the swing tier says. This is the multi-timeframe model the SMC guide teaches.
3. The inversion flip. Enable fair value gap drawing when a gap has just been violated: the inversion zone is the polarity flip, and the first retest of it is one of the cleanest entries in the framework. The Fair Value Gaps + Inversion indicator does this in more depth; the engine's version is enough for confluence.
Recommended settings by market and timeframe
Gold and forex majors, 15-minute to 1-hour:
Swing 15 / internal 5 as shipped; minimum gap size 0.15; enable gap drawing only when studying inversions.
Crypto perpetuals, 2-hour to 4-hour:
Swing 20 / internal 7 — crypto's noise needs slightly larger pivots; volume grading is reliable on the major exchanges.
Indices, 5-minute to 15-minute in the cash session:
Swing 10 / internal 4; keep structure events to 6 to hold the chart readable.
Any market on the daily:
Swing 10 / internal 3; the dashboard's range position becomes a swing trader's bias tool.
How it compares
Against a hand-drawn SMC chart: the engine does the same marking, on closed bars, with a rule for when each element is removed — which is the part hand-drawn charts never do, and why they fill with dead zones. Against other free SMC indicators: most draw the concepts and stop; the engine scores the confluence and narrates it, tracks the life cycle of every zone, grades blocks by volume, and refuses to stack duplicate sweep labels. Against Zeno: the engine is the open-source, single-timeframe, analysis layer; Zeno adds the multi-timeframe confluence, the signal with entry, stop, TP1 and TP2, the risk engine, and the public record — and QuantumBot executes it.
Limitations
Structure detection is only as good as the pivot lengths; very noisy instruments need larger values. Volume grading is less meaningful on symbols with unreliable volume (some forex CFD feeds). Removed zones are not kept as history. The Confluence Score measures alignment, not outcome. Pivot confirmation introduces a lag equal to the structure length, by design.
Credits
The concepts — order blocks, fair value gaps, liquidity sweeps, BoS and CHoCH, premium and discount — were popularised by the Inner Circle Trader methodology of Michael J. Huddleston with roots in Richard D. Wyckoff's market logic. The confluence scoring model, the narrative engine, the zone life-cycle system, the volume grading, the sweep memory and all code are original work by Quantum Algo, published open source under TradingView's house rules.
Step-by-step: adding it to your TradingView chart
Open the script page on TradingView (link above) and click Add to favorites, then Use on chart — or on any chart, open Indicators, search "Smart Money Concepts Engine Quantum Algo" and add it. It is free on every TradingView plan, including the free tier.
Open the indicator's settings (the gear icon on its label) and set the inputs for your market and timeframe from the table above; the defaults are tuned for crypto and gold on intraday charts.
In the Style tab, match the colours to your chart theme; the dashboard position and text size are in Inputs.
To set alerts, right-click the chart → Add alert, choose the indicator as the condition and pick the event you want; set the trigger to "Once per bar close" so alerts match the closed-bar logic.
Save the chart layout so the indicator loads with it, and — if you use our other free tools — add them to the same layout; they are designed to sit together without clutter.
To read or reuse the code, click Source code on the script page. Republishing is subject to TradingView's house rules; personal modification is not.
Inside the code, for developers
The script is Pine Script v5, published open source. The pieces worth reading if you want to modify it:
Pivot confirmation
Uses ta.pivothigh / ta.pivotlow with a symmetric lookback, which is why every structural event lags by the pivot length — the deliberate cost of a non-repainting result.
State is held in arrays
Of boxes, lines and labels with explicit life-cycle functions (create, update, retire), capped by the "keep" inputs; TradingView's object limits are respected by design.
Everything evaluates on barstate.isconfirmed
The developing bar is never used for detection or signals.
Alerts
Use named alertcondition calls (or alert() where the message carries data), so webhooks receive a consistent payload.
If you build on it, our Pine Script tutorials in the Academy and the TradingView backtesting guide cover strategy conversion and testing.
Using it with the other free indicators
The five Smart Money tools are built to layer: the Smart Money Concepts Engine for bias and the score; Order Blocks with Volume for the zone and its quality; Fair Value Gaps + Inversion for the imbalance and the polarity flip; Liquidity Sweeps for the trigger; Institutional Key Levels for the ranked map the rest is read against. A full read on one chart: bias from the engine's swing tier → the nearest ranked level → a sweep of the liquidity there → a return to a high-volume block or an inverted gap → entry with the stop beyond the sweep and the target at the next level. The free-indicators hub lists every tool; the SMC guide is the method behind the layering.
Common mistakes with this indicator
- Trusting the developing bar — every event here waits for the close, and so should you.
- Trading every marker — the tool highlights context and locations; the entry needs confirmation from structure and a stop beyond the level.
- Running it on the wrong timeframe with default lengths — adjust the pivot inputs to the chart, as the settings table shows.
- Ignoring volume quality — on CFD tick-volume feeds the volume features are indicative; on exchanges and futures they are real.
- Stacking too many tools — the five free indicators layer; ten random scripts do not.
Want the signal, not just the structure?
Zeno reads the same Smart Money structure across timeframes and prints the entry, stop, TP1 and TP2 on your chart — with a public record of 160 posted trades, 120 wins and 40 losses at the stated levels. QuantumBot executes it on Bybit, Binance, OKX, Bitget and Kraken.

Glossary for this indicator
Frequently asked questions
Does the Smart Money Concepts Engine repaint?
No. Structure events, sweeps, inversions and signals are evaluated on closed bars at confirmed pivots. Pivot confirmation introduces intentional lag equal to the structure length.
What does the Confluence Score mean?
A transparent sum of five weighted, visible conditions — structure alignment, premium/discount positioning, a fresh order block, imbalance confluence and a recent sweep — from 0 to 100. It measures how much of the checklist is true right now; it is not a probability.
Why did an order block disappear?
It was mitigated — price closed through it. The engine removes dead zones so the chart only shows levels that still matter.
Why do sweeps print only once at a level?
Each swing level carries sweep memory and a cooldown; the duplicate stacking common in liquidity tools is designed out.
Which markets and timeframes work best?
All markets with candle data. Higher timeframes produce larger, cleaner structures; the internal tier keeps lower timeframes readable. Volume grading works best on exchanges and futures with real volume.
Is it really free, and can I read the code?
Yes — open source on TradingView, free to use and to read. Republishing the code is subject to TradingView's house rules.
How is it different from Zeno?
The engine is the free analysis layer on one timeframe; Zeno adds multi-timeframe confluence, signals with entry, stop and two targets, a risk engine and a public track record, and QuantumBot executes those signals on your exchange.
Which timeframe should I run the Smart Money Concepts Engine on?
Any; the swing tier is cleanest on 1-hour and above, the internal tier keeps 5- and 15-minute charts readable. Run it on the higher timeframe for bias and a faster chart for entries, or use the score on one chart.
Can I use the Confluence Score in alerts or a webhook?
Yes — zone-tap alerts carry the score in the message, so a webhook or bot can filter for scores above a threshold.
Does the engine work on forex where volume is tick volume?
Yes; structure, gaps, liquidity and premium/discount do not need volume. Only the order-block volume grade becomes indicative rather than exact.
Why is the score high but there is no signal?
A zone-tap signal needs price to return to a fresh zone with both tiers aligned and correct range positioning; a high score without a tap means the context is right and the location has not been reached.
What is the difference between swing and internal structure?
Two pivot lookbacks tracked as independent biases — swing for the larger structure, internal for the compact context inside it. Their agreement is worth 25 points; their disagreement is the earliest warning of a change.
Is the engine a replacement for the individual free indicators?
It is the overview; the dedicated Order Blocks with Volume, Fair Value Gaps + Inversion, Liquidity Sweeps and Institutional Key Levels tools go deeper on each element. They are built to layer.
The other free Smart Money indicators
Built to layer on one chart: the engine for bias and the score, the dedicated tools for each element.
Add Smart Money Concepts Engine to your chart
One click on TradingView, free on every plan, code you can read. Nothing repaints.