Liquidity in Trading: The Complete Trading Guide
| Signal type | SMC concept |
| Directional bias | Both directions |
| Best context | Pools at equal highs/lows, session extremes, round numbers |
| Confirmation | Sweep-and-reclaim or break-and-retest of the pool |
| Invalidation | Sustained trade beyond the pool without reclaim |
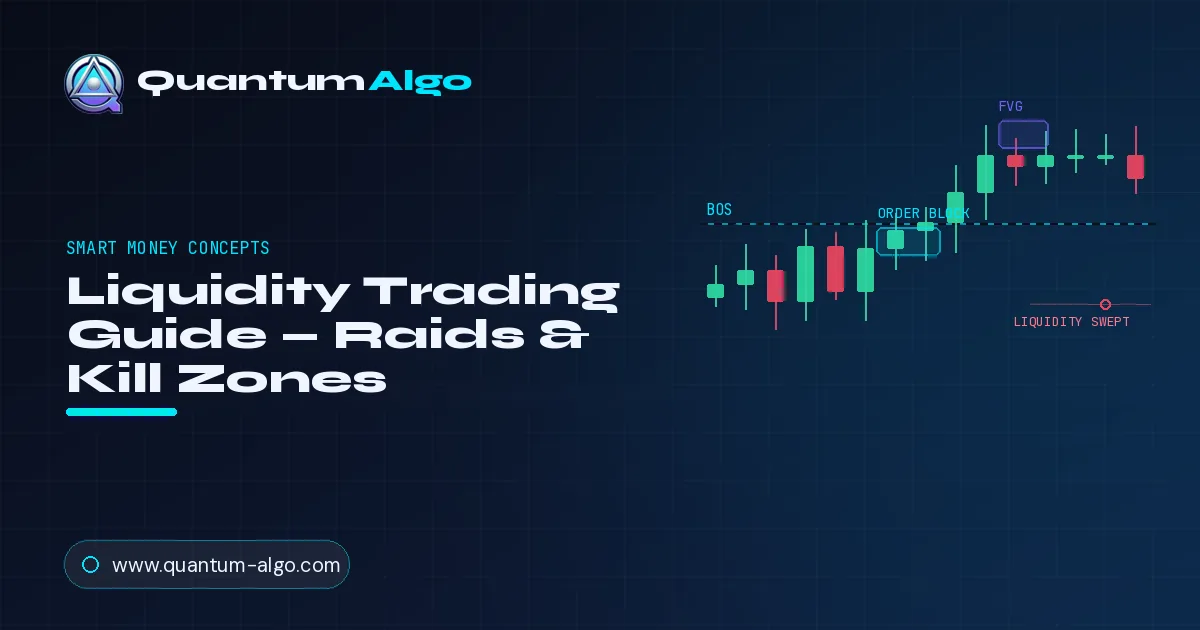
Liquidity in trading, in Smart Money Concepts, means clusters of resting stop-loss and pending orders above swing highs (buy-side) and below swing lows (sell-side). Institutions sweep these pools to fill large orders, creating stop hunts and false breakouts. Trade it in three steps: identify where liquidity sits, wait for the sweep, then enter the reversal with BOS/CHoCH and order block confirmation.
1. What Is Liquidity in Trading?
Liquidity in Smart Money Concepts refers to clusters of stop-loss orders sitting at predictable price levels — above swing highs (buy-side liquidity) and below swing lows (sell-side liquidity). Institutional traders engineer price to sweep these liquidity pools to fill their large orders, creating the stop hunts that retail traders experience as false breakouts.
This complete guide covers liquidity pool identification, sweep recognition, inducement patterns, and the three-step trading process: identify where liquidity sits, wait for the sweep to occur, then enter in the reversal direction with confirmation from BOS/CHoCH and order block reaction.
Last verified: April 15, 2026
Liquidity is the fuel that moves markets. In the context of Smart Money Concepts, liquidity refers to the pools of resting orders — stop losses, pending entries, and breakout orders — that cluster at predictable price levels. Institutions need these order pools to enter and exit massive positions without moving the price against themselves.
Think of it this way: when JP Morgan wants to buy €500 million of EUR/USD, they can't simply click "buy" and get filled at one price. That order is so large it would move the market 50-100 pips against them before execution completes. Instead, they need to find pools of opposing orders — sell orders — to absorb their buying. Where do those sell orders sit?
At exactly the levels where retail traders place their stop losses.
This is why the market repeatedly sweeps past previous highs and lows before reversing. It's not random — it's liquidity engineering. And once you learn to see it, the market transforms from chaos into a logical sequence of institutional moves.
2. What are the 7 core liquidity concepts?
These seven concepts form the building blocks of institutional liquidity analysis. Master each one individually before combining them into a complete trading framework.
01 Order Blocks
The last opposing candle before a strong impulsive move. Bullish order blocks are the final bearish candle before a rally — the zone where institutions accumulated long positions. When price returns to this zone, it often acts as powerful support because institutional orders are still resting there.
02 Liquidity Raids
A deliberate sweep past a previous high or low designed to trigger stop-loss clusters. The price pushes beyond a key level just enough to fill institutional orders, then reverses sharply. Identifying a raid in progress — rather than a legitimate breakout — is one of the most profitable skills in SMC trading.
03 Displacement
An aggressive, impulsive price move that signals genuine institutional intent. Displacement candles have large bodies and small wicks — they show conviction, not noise. When displacement follows a liquidity raid, it confirms the raid was successful and a new directional move has begun.
04 Inverse FVG (IFVG)
A previously filled fair value gap that has flipped its role. A bullish FVG that gets violated becomes a bearish IFVG — now acting as resistance instead of support. IFVGs are powerful because they represent a failure of institutional intent, signaling a shift in market direction.
05 Internal Range Liquidity (IRL)
Liquidity that exists within a trading range — between the swing high and swing low — as opposed to external liquidity sitting beyond those levels. IRL includes fair value gaps, order blocks, and intermediate highs/lows. Price often targets IRL before reaching for external levels.
06 Power of Three (PO3)
Also called AMD (Accumulation, Manipulation, Distribution). This three-phase cycle describes how institutions operate: they accumulate positions inside a range, manipulate price with a fake breakout to grab liquidity, then distribute by driving price in their intended direction.
07 Kill Zones
Specific time windows when institutional activity peaks and the most significant moves occur. Kill zones align with major market openings — Asian, London, and New York sessions. Trading exclusively during kill zones filters out low-probability noise and focuses your execution on high-volume institutional activity.
3. What is the difference between buy-side and sell-side liquidity?
Every liquidity pool falls into one of two categories. Understanding which type sits where — and which one institutions are targeting — is what separates profitable SMC traders from those who keep getting stopped out.
Buy-side liquidity (BSL) sits above previous swing highs. It consists of the stop losses placed by short sellers and the pending buy orders from breakout traders. When institutions want to sell, they drive price up into BSL to trigger those buy orders — which provide the sell-side counterparty they need.
Sell-side liquidity (SSL) sits below previous swing lows. It consists of stop losses from long traders and pending sell entries from breakdown traders. When institutions want to accumulate long positions, they push price down into SSL to trigger the sell orders they need to buy against.
4. How do institutions hunt liquidity in three phases?
Every major move in the market — from the 1-minute chart to the monthly — follows the same three-phase pattern. This is the Power of Three (PO3), also known as Accumulation, Manipulation, Distribution (AMD).
Phase 1 — Accumulation: Price consolidates inside a tight range. This looks boring on the chart — low volatility, small candles, indecision. But behind the scenes, institutions are slowly building their position by buying small amounts against the range boundaries without breaking the range. This phase can last hours, days, or weeks depending on the timeframe.
Phase 2 — Manipulation: This is the liquidity raid. Price breaks below the range (in a bullish scenario), sweeping the stop losses of traders who went long inside the range. This creates a flood of sell orders that institutions buy against. The "breakout" looks convincing — many traders see it as a bearish signal and go short, providing even more liquidity for the institutions to absorb.
Phase 3 — Distribution: With their positions filled, institutions allow price to move in their true intended direction. This is the displacement — aggressive, impulsive candles that break structure. The move is fast and often leaves fair value gaps behind. This is where the real profit is made.
5. Video Tutorials
Watch these two tutorials for a visual breakdown of every concept covered in this guide. The first video covers all 7 concepts in under 60 seconds. The second goes deep into actionable strategies with real trade examples.
6. How Do You Trade Liquidity? Three Proven Strategies
Now that you understand the theory, here are three complete trading strategies built on liquidity concepts. Each one includes specific entry rules, stop placement, and target logic.
Strategy 1: How do you trade a liquidity sweep reversal?
The bread-and-butter liquidity setup. You wait for price to sweep a previous high or low, then enter on the reversal displacement.
Entry Rules:
1. Identify a clear previous swing high (for shorts) or swing low (for longs) with visible equal highs/lows — this is where stops are clustered. 2. Wait for price to sweep beyond that level with a wick (not a strong body close). 3. On the very next candle or within 2-3 candles, look for a displacement candle in the opposite direction — a large-body candle that closes aggressively back inside the range. 4.
Enter at the close of the displacement candle.
Stop Loss: Place your stop 1 ATR beyond the sweep wick — this gives you protection against a secondary sweep while keeping risk tight.
Target: The opposite liquidity pool. If you entered long after a SSL sweep, your target is the nearest BSL (previous swing high). Risk-to-reward is typically 2:1 to 4:1.
Best Timeframes: 15M for entries with 1H/4H for identifying the sweep level.
Strategy 2: Order Block + FVG Confluence
This strategy combines two institutional footprints for higher-probability entries. When an order block and a fair value gap overlap, you're looking at a zone where institutions both placed orders AND left unfilled orders behind.
Entry Rules:
1. On the higher timeframe (4H or Daily), identify a valid order block — the last opposing candle before a structural break. 2. Check if a fair value gap exists within or adjacent to that order block. The overlap zone is your premium entry area. 3. Drop to a lower timeframe (15M) and wait for price to enter this confluence zone. 4.
Look for a rejection pattern inside the zone — a pin bar, engulfing candle, or internal BOS on the lower timeframe. 5. Enter on the confirmation candle.
Stop Loss: Below the entire order block (for longs) or above it (for shorts). The OB invalidation is your line in the sand.
Target: The imbalance on the opposite side — typically the nearest unfilled FVG or opposing order block. Partial profits at 1:1, remainder targeting 2:1 or 3:1.
Why It Works: You're stacking two types of institutional evidence. An OB alone has maybe a 55-60% hit rate. An FVG alone is similar. But when they converge, you're trading at a zone with double institutional interest, which significantly improves the odds.
Strategy 3: Kill Zone AMD (Power of Three)
This strategy uses the Power of Three cycle specifically within kill zone sessions. You identify the accumulation during the Asian session, anticipate the manipulation at London or NY open, and ride the distribution.
Entry Rules:
1. During the Asian session (8PM-12AM EST), mark the range high and range low. This is your accumulation zone. 2. At London open (2-5AM EST), watch for price to break one side of the Asian range. This is the manipulation. 3. If price breaks below the Asian low: wait for a displacement candle back above the range. Enter long. 4.
If price breaks above the Asian high: wait for a displacement candle back below the range. Enter short. 5. The distribution phase typically runs from 7-10AM EST (NY session overlap).
Stop Loss: Below the manipulation wick (for longs). This is the farthest point of the liquidity sweep — if price returns there, the thesis is invalid.
Target: The opposite side of the Asian range plus an extension. If price swept the Asian low and reversed, target the Asian high first, then the next BSL beyond it. The NY session provides the momentum for distribution.
Key Filter: Only take this setup when the higher timeframe (Daily/4H) bias aligns with your entry direction. An AMD long that goes with the daily trend has significantly higher success rates than one fighting the trend.
7. Which trading sessions are the liquidity kill zones?
Not all hours are equal. Institutional activity — and therefore liquidity events — concentrate during specific sessions. Trading outside these windows dramatically increases your exposure to noise and false signals.
Asian Session (8PM – 12AM EST): This is where the range forms. Price typically consolidates, creating the accumulation zone. Mark the Asian high and Asian low — these become your manipulation levels for the following sessions.
London Open (2AM – 5AM EST): The highest-probability manipulation window. London traders push price through one side of the Asian range, triggering stops and creating the liquidity raid. This is where the Power of Three manipulation phase most commonly occurs.
New York Open (7AM – 10AM EST): The distribution phase. With London's manipulation complete, NY session brings fresh volume that drives the real directional move. The London-NY overlap (8-10AM EST) is the single highest-volume window in forex and crypto — this is where the biggest moves happen.
London Close (10AM – 12PM EST): A secondary kill zone known for reversals. Profits from the morning move get taken, and price often retraces. Experienced traders use this window for counter-trend scalps or to manage exits from earlier positions.
8. Test Your Knowledge
Seven questions covering every major concept in this guide. See how well you've absorbed the material.
9. Detect Liquidity Automatically
Understanding liquidity theory is step one. Executing it consistently in live markets — identifying order blocks, mapping liquidity pools, timing entries during kill zones — is where most traders struggle. That's exactly what Quantum Algo Zeno was built for.
• Order block detection — automatically identifies and marks valid OBs on your chart
• Liquidity zone mapping — highlights where BSL and SSL clusters sit
• Fair value gap tracking — marks unfilled FVGs and alerts when price approaches
• Multi-timeframe confluence — scores signals based on HTF + LTF alignment
• Kill zone session overlay — visual session markers so you only trade during high-probability windows
• Smart alerts — get notified when a liquidity sweep + displacement setup forms in real time
Want to see Quantum Algo Zeno in action before subscribing? Check out our public TradingView Ideas — every signal is timestamped, permanent, and verifiable. Or explore the backtest results across 160 trades and 8 market regimes.
10. Frequently Asked Questions
Liquidity in SMC trading represents pools of resting orders — stop losses, pending entries, and breakout orders — that cluster at predictable price levels. Institutions target these pools to fill their large positions without excessive slippage. Understanding where liquidity sits is the foundation of Smart Money Concepts.
Order blocks are specific candles that precede a strong impulsive move, representing zones where institutional orders were placed. The last bearish candle before a bullish impulse is a bullish order block. They act as high-probability support and resistance levels when price returns to them.
A liquidity raid occurs when price sweeps beyond a previous high or low to trigger clustered stop-loss orders. This gives institutions the opposing orders they need to enter their positions. The price then reverses sharply as the raid completes — this is the classic "stop hunt" pattern.
Kill zones are time windows when institutional activity peaks: Asian session (8PM-12AM EST) for range formation, London open (2-5AM EST) for manipulation, New York open (7-10AM EST) for distribution, and London close (10AM-12PM EST) for reversals.
Power of Three (PO3), also called AMD, describes the institutional three-phase cycle: Accumulation (building positions in a range), Manipulation (fake breakout to grab liquidity), and Distribution (the real directional move in the intended direction).
Quantum Algo’s free public indicators mark order blocks, FVGs and liquidity structures; Zeno provides confirmed Buy/Sell signals with SL/TP and built-in risk management — converting the concepts in this guide into automated, actionable alerts on your TradingView chart.
References & Related Guides
More in this topic
- Liquidity Sweeps — Free Liquidity Sweep Indicator for TradingView (Buy-Side and Sell-Side Liquidity, Stop Hunts)
- Liquidation in Trading — Magnets & Purges
- BOS & CHoCH: Complete Market Structure Guide
- Breaker Block Trading — 5-Condition Complete Guide
- Displacement Trading — SMC Institutional Conviction Guide
- Fair Value Gaps (FVG): Complete Trading Guide
- ICT Silver Bullet Strategy: The Complete Guide
- ICT Trading Strategy: Complete Interactive Guide
- Is ICT and SMC the Same? Differences Explained
- Liquidity Sweep Trading: Stop Hunts Explained
- Order Blocks Trading: Complete Guide
- Order Flow Trading — Read the Footprint of Institutions
- Smart Money Concepts (SMC): Ultimate Trading Guide
- What Is a Market Structure Shift (MSS) in Trading?
- POV Trading Algorithm Guide
Core reading
- Best TradingView Indicators — Complete Guide
- Risk Management in Trading — Complete Guide
- Candlestick Patterns Guide — Engulfing, Pinbar & More
- All Premium Guides
- Quantum Algo on TradingView
- Public Track Record
Authoritative sources
For a focused comparison, read the liquidity for an ICT Unicorn before applying the setup.