If you learn only two concepts from Smart Money Concepts, make it order blocks and Fair Value Gaps. Together, they form the foundation of institutional entry analysis and provide the highest-probability trade setups available to retail traders.
Before the rules, the order blocks and fair value gaps as an engine sees them — Quantum Algo Zeno on gold, Bitcoin and NAS100, exported straight from TradingView.



Indicators that prove themselves in public.
One engine, four precision tools — the Gold (XAU) Scalper, the institutional Gravity Zone, the Zeno momentum Oscillator, and Zeno Stocks for equities.
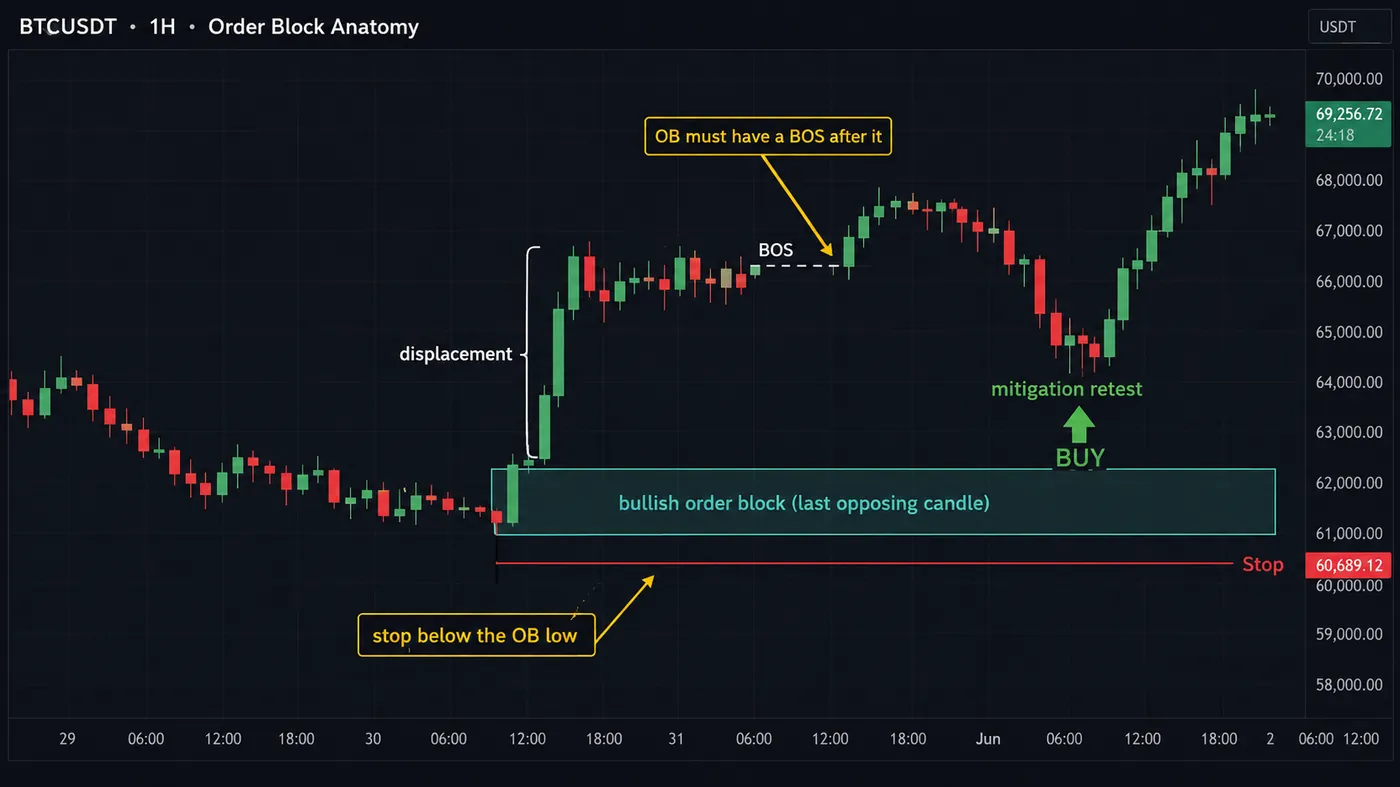
Order Blocks: Where Institutions Enter
An order block is the last opposing candle before a significant impulsive move. When a bank needs to buy millions of dollars worth of an asset, they accumulate their position over a range of candles. The final candle of their accumulation — just before price launches — is the order block. When price returns to this level, the institution often has more orders to fill, creating a high-probability entry zone.
Fair Value Gaps: Market Imbalances
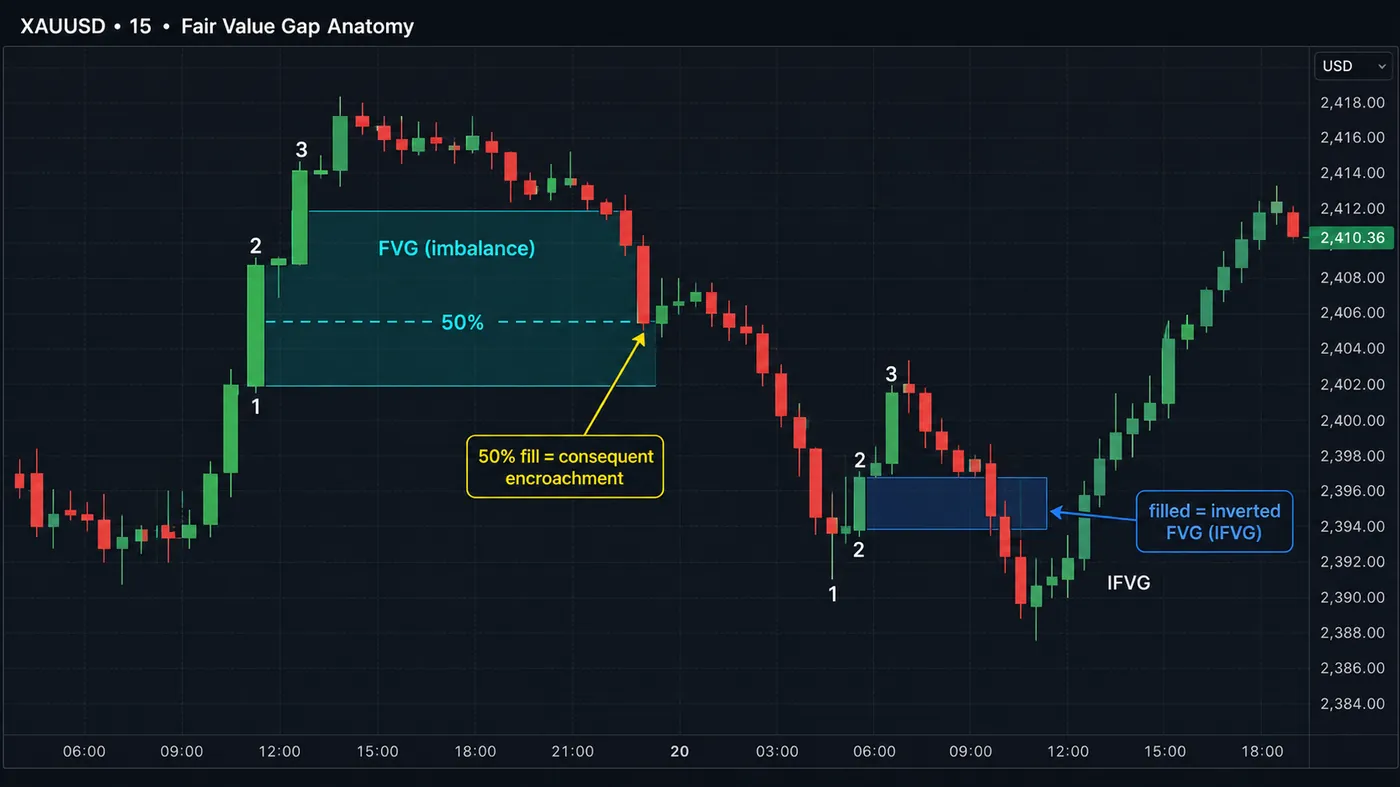
A Fair Value Gap is a three-candle price imbalance where candle 1's wick and candle 3's wick don't overlap. The gap between them represents a zone where institutional orders moved price so aggressively that no proper two-way auction occurred. Market-making algorithms systematically guide price back to these gaps to rebalance the order book — creating reliable entry opportunities.
OBs and FVGs Together: Maximum Confluence
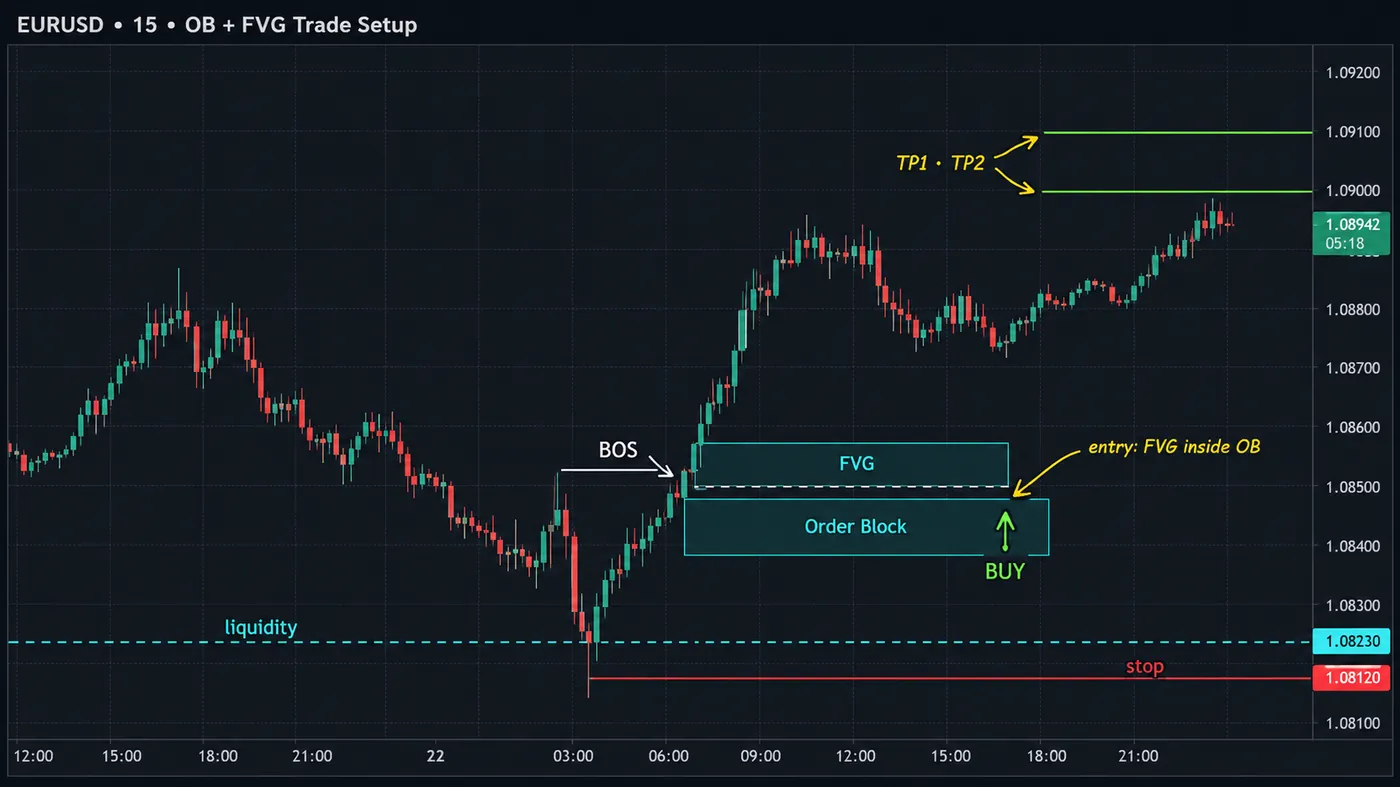
The highest-probability setup occurs when an order block and a Fair Value Gap overlap. This means you have both the institutional entry zone AND a price imbalance agreeing on the same price level. When price returns to this overlapping zone with higher-timeframe bias in your favor, the win rate exceeds 65% in backtesting — significantly higher than either element alone.
Quality Filtering
Not all order blocks and FVGs are equal. High-quality OBs created a Break of Structure, have strong displacement, are unmitigated, and align with HTF bias. High-quality FVGs formed during high-volume sessions, have strong displacement candles, are unmitigated, and overlap with institutional zones. Quantum Algo automatically grades OB and FVG quality, filtering out low-probability setups so you only see the ones worth trading.

Automate your trades. Let Quantum Algo trade for you.
Every signal executed on your own account — on your account, with the plan you define.
The Synergy Between Order Blocks and Fair Value Gaps
Order blocks and Fair Value Gaps are the two most important concepts in Smart Money trading, and they become significantly more powerful when analyzed together rather than in isolation. An order block tells you where institutional accumulation occurred. An FVG tells you where the imbalance in price delivery created by that accumulation left a gap. When an order block and an FVG overlap — when the institutional accumulation zone coincides with an unfilled price imbalance — you have the highest-probability entry zone available in SMC analysis.
The logic is reinforcing: the order block provides the institutional interest (unfilled orders resting in the market). The FVG provides the price magnet (the market's tendency to return to areas of imbalance to complete the auction process). When both forces point to the same price zone, the probability of a reaction increases because two independent market mechanisms are working in your favor simultaneously. This is not stacking correlated indicators — it is identifying genuine confluence between two fundamentally different market dynamics.
Practical Confluence Identification
To find OB + FVG confluence zones, start by identifying your order blocks on the trading timeframe. Then check whether any of those order blocks overlap with an existing Fair Value Gap. The overlap does not need to be exact — even partial overlap (where the top half of an order block falls within an FVG zone) creates meaningful confluence. Mark these overlapping areas as your primary points of interest and prioritize them over standalone order blocks or standalone FVGs.
When price approaches a confluence zone, your entry trigger should come from the lower timeframe: a Change of Character, a bullish or bearish engulfing pattern, or a clear rejection wick within the zone. The stop loss goes below the entire confluence zone (below both the order block low and the FVG low for bullish setups). The target is the next opposing structural level — typically the most recent swing high for longs or swing low for shorts. This setup consistently produces risk-to-reward ratios of 1:2 to 1:4 because the entry is precise (within the confluence zone) while the target is structural (the next major level).
The Institutional Logic Behind OB+FVG Zones
When an order block and a Fair Value Gap overlap, two distinct institutional mechanisms converge at the same price level. The order block represents unfilled institutional limit orders — resting buy or sell orders placed by large participants during the accumulation or distribution phase. The FVG represents an auction gap — a price zone where the normal back-and-forth of buying and selling did not occur because the imbalance was too strong. When price returns to this overlapping zone, it encounters both the resting institutional orders AND the market's natural tendency to complete the interrupted auction. This dual-mechanism convergence is why OB+FVG confluence zones produce the strongest and most consistent reactions in SMC trading.
Understanding this institutional logic prevents you from treating confluence as a mere checklist item. It is not simply "two things at the same level equals higher probability." It is two fundamentally different market forces — order flow mechanics and auction theory — pointing to the same zone. This understanding also explains why single-factor zones (an order block without an FVG, or an FVG without an order block) produce weaker reactions: only one mechanism is at work rather than two.
Advanced OB+FVG Techniques for Experienced Traders
Experienced traders refine their OB+FVG analysis by considering the gap fill percentage. When price enters a bullish FVG from above, does it fill 50% of the gap before bouncing? 75%? 100%? The depth of the fill provides real-time information about the strength of the institutional interest at the level. A shallow fill (price bounces after filling only 30% of the FVG) suggests very strong resting demand. A deep fill (price penetrates 80%+ of the FVG) suggests that the institutional interest is weaker and the zone may fail entirely on the next visit.
Another advanced technique is tracking time decay on OB+FVG zones. The longer a confluence zone remains untested, the weaker it becomes as the resting orders get cancelled, adjusted, or filled through other means. A confluence zone created 3 days ago is more potent than one created 3 weeks ago. For the freshest, highest-probability setups, focus on OB+FVG zones that formed within the last 5–10 days on the 4-hour chart, or within the last 2–3 sessions on the 1-hour chart. Older zones can still produce reactions, but size your positions accordingly to account for the reduced probability.
Common Pitfalls When Trading OB+FVG Confluence
The most common mistake is forcing confluence where it does not exist. Eager traders sometimes stretch the boundaries of their order blocks or FVGs to create artificial overlap. If the order block zone spans from $100 to $102 and the FVG spans from $103 to $106, these are not confluent — there is a $1 gap between them. Treating them as confluent because they are "close" dilutes the power of the concept and leads to entries at zones that lack genuine dual-mechanism support. Be honest about your markup: either the zones overlap or they do not.
Another pitfall is ignoring the higher-timeframe context when trading lower-timeframe confluences. A 15-minute OB+FVG confluence zone that sits against the daily trend has much lower probability than one that aligns with it. Always verify that your confluence zone is supported by the structural bias of at least one higher timeframe before entering. The confluence zone provides precision; the higher-timeframe bias provides direction. You need both for a complete, high-probability setup.
Key Takeaways
Understanding OB and FVG confluence trading provides a meaningful addition to your trading toolkit, but the real value emerges only when you integrate these concepts with a structured methodology like Smart Money Concepts. No single indicator, pattern, or analytical concept produces consistent profitability in isolation. The concepts covered in this guide become powerful when they serve as one layer in a multi-confirmation system that includes higher-timeframe directional bias, institutional zone identification, and disciplined risk management.
The most important practical step is to backtest before you trade live. Take the concepts from this guide and apply them to historical price data using TradingView's bar replay feature. Walk through at least 50 setups, recording the entry, stop, target, and outcome for each. This backtesting exercise accomplishes two things: it builds your pattern recognition for the specific setup types discussed in this article, and it gives you empirical data on the setup's actual performance — win rate, average R:R, and maximum drawdown — that you can use to make informed decisions about incorporating it into your live trading plan.
Quantum Algo’s free indicators mark order blocks, fair value gaps and liquidity on any TradingView chart; Zeno adds confirmed Buy/Sell signals with the stop, TP1 and TP2 — $112.86 $79/mo, cancel anytime. Every call is published timestamped on TradingView, nothing deleted.
Your Next Steps
Now that you have a solid understanding of identifying and trading the highest-probability institutional zones, the next step is implementation. This week, dedicate 30 minutes per day to chart markup practice focused specifically on the concepts covered in this guide. Use the daily and 4-hour charts of your primary trading assets. Mark every relevant setup you can find, then track how price interacts with those levels over the next few sessions. This deliberate practice builds the visual pattern recognition that eventually becomes automatic during live trading.
After two weeks of chart markup practice, begin incorporating these setups into your demo trading or your live trading with minimal position sizes. Start with your single highest-conviction setup type and trade only that setup for 30 consecutive trades. After 30 trades, review your journal data: which setups produced the best R:R? Which sessions were most productive? Which assets showed the cleanest patterns? Use this data to refine your approach, eliminate underperforming variants, and concentrate on the specific combinations that your data shows work best for your trading style and market.
Finally, remember that mastery is a journey measured in months and years, not days and weeks. The traders who achieve lasting success are the ones who commit to continuous improvement through consistent practice, honest self-assessment, and evidence-based refinement. Every session of chart markup, every journaled trade, and every weekly review compounds your skill and brings you closer to the level of unconscious competence where profitable trading becomes second nature. Stay patient, stay disciplined, and trust the process.
The OB+FVG confluence framework gives you an analytical edge that most retail traders lack: the ability to identify zones where two independent institutional mechanisms converge. While most traders are guessing at support and resistance based on horizontal lines or moving averages, you are targeting zones backed by both institutional order flow evidence and market auction theory. This informational advantage translates directly into better entries, tighter stops, and higher-probability outcomes over a large sample of trades. The concept is simple, but the edge it provides is substantial — and it rewards the traders who take the time to understand and apply it systematically.
Order Blocks and FVGs on a Live Chart
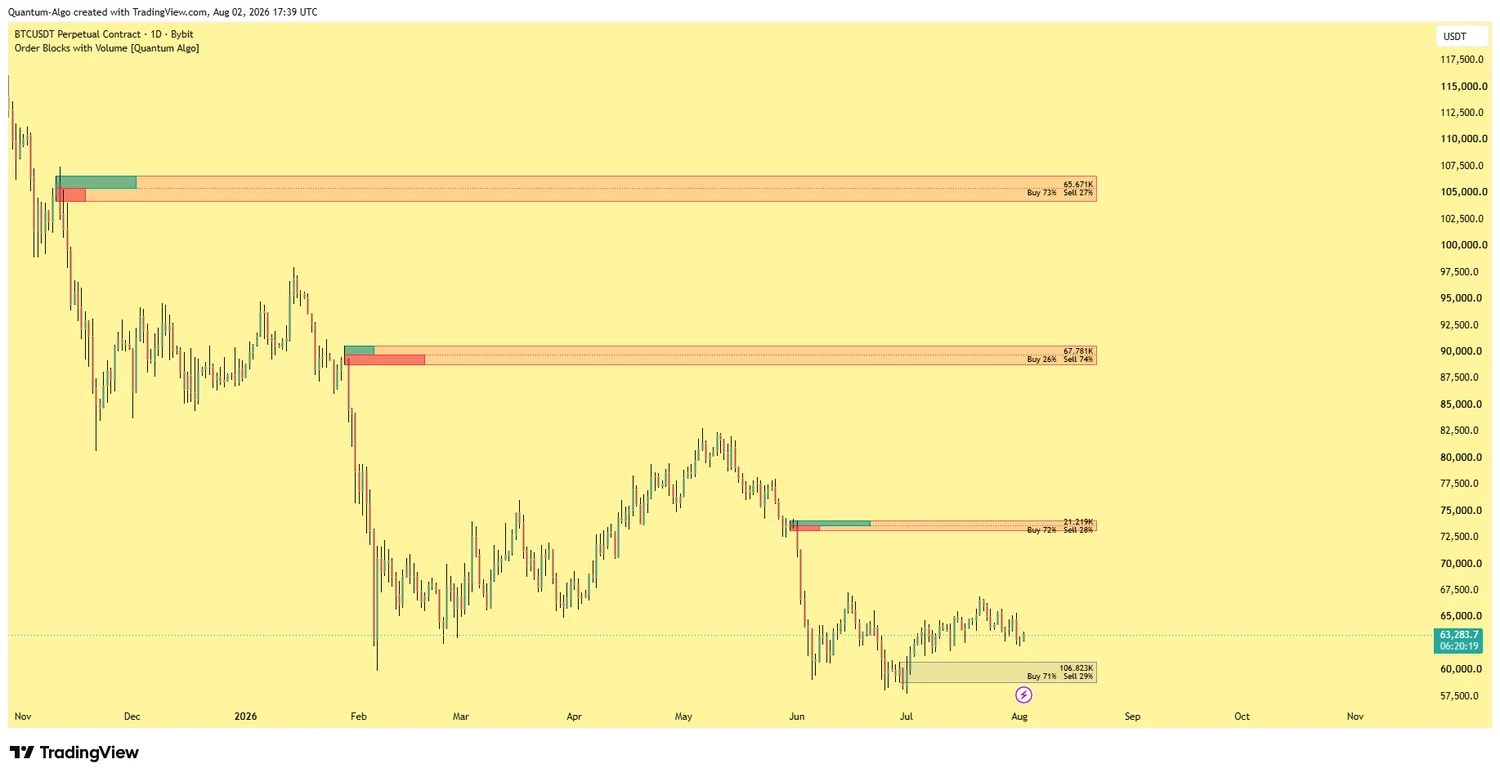
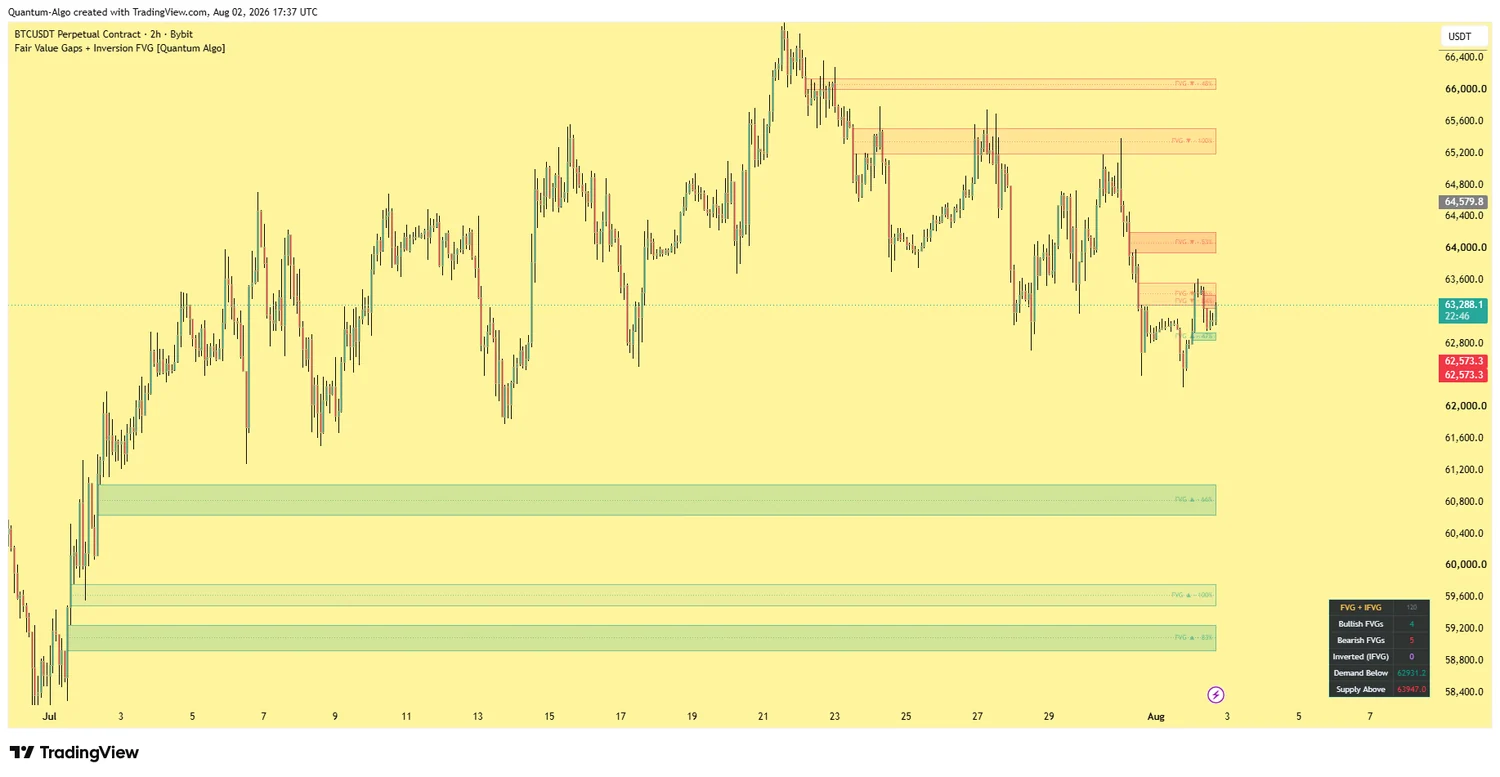
Theory only takes you so far. Below are both concepts running on a real BTCUSDT chart, drawn automatically by our two free, open-source TradingView indicators — so you can see exactly what a valid order block and a valid fair value gap look like without drawing a single box yourself.
The fill percentage is your decision rule
A gap labelled 46% filled still has untouched inefficiency inside it — price has unfinished business there. A gap at 100% is fully mitigated and, in most frameworks, no longer a valid target. Tracking that percentage automatically is the difference between reacting to a level that still matters and defending one the market already closed.
Inversion FVGs: when a gap flips sides
The most under-used concept on this chart is the inverted FVG. When price trades decisively through a bullish gap instead of respecting it, that failed demand often flips into resistance on the retest — and vice versa. A gap that fails is not noise; it is a change of character, and the level frequently works just as well in the opposite direction.
Volume-graded blocks
Every order block carries its traded volume and buy/sell split, so you can rank zones by the weight of activity that built them instead of treating all boxes equally.
Live fill tracking
Each FVG shows the percentage filled. Partially filled gaps stay actionable; fully mitigated ones are retired automatically so your chart never accumulates dead levels.
Inversion detection
Gaps that fail are re-classified as inverted FVGs and flipped to the opposite side — turning a broken level into a tradeable one instead of deleting it.
Nearest demand and supply
The dashboard names the closest unmitigated zone above and below price, so your next target and your next risk level are always one glance away.
Both indicators are free and open-source
Add them to your TradingView chart and the zones, volume splits, fill percentages and inversions are drawn for you on every symbol.
Order Blocks with Volume → Fair Value Gaps + IFVG →Combining Order Blocks and FVGs: The A+ Setup
Each concept is useful alone. Stacked, they identify a far smaller number of far better locations — which is the entire point of a filter. The highest-quality setups occur where an order block and a fair value gap overlap, because two independent forms of evidence point at the same price.
Where the two concepts overlap
The order block marks where institutions transacted; the FVG marks the inefficiency their aggression left behind. Where they coincide, you get a confluence zone with a tight, logical stop.
| Evidence present | What it tells you | Setup grade |
|---|---|---|
| FVG alone | An inefficiency exists, but nothing says institutions defended it | Low |
| Order block alone | Institutions transacted here, but no urgency in the departure | Medium |
| Order block + FVG overlap | Institutions transacted and left in a hurry — two independent signals | High |
| Overlap + high volume + trend alignment | Confluence with weight behind it, in the direction of structure | A+ |