Order Blocks with Volume [Quantum Algo]
Order blocks from confirmed structure breaks, each labelled with the buy/sell volume that built it — mitigation line, breaker and historic modes, and filters that leave only the zones worth waiting for.
The short answer
Order Blocks with Volume is a free, open-source TradingView indicator that finds order blocks — the candle where a directional move originated before price broke market structure — and measures the buy and sell volume that traded inside each one. Every zone is drawn as a box that extends forward until price returns to it, labelled with its total volume and its buy/sell split, so you can tell at a glance which blocks were built on heavy participation and which were thin. It tracks the full life cycle — active, mitigated, invalidated, optionally flipped to a breaker or frozen as history — runs only on closed bars so confirmed zones never repaint, and includes filters to show only the heaviest, best-proportioned blocks. It is the practical companion to our order-block guide and the block-detection layer of the free Smart Money Concepts Engine, on its own and in more depth.
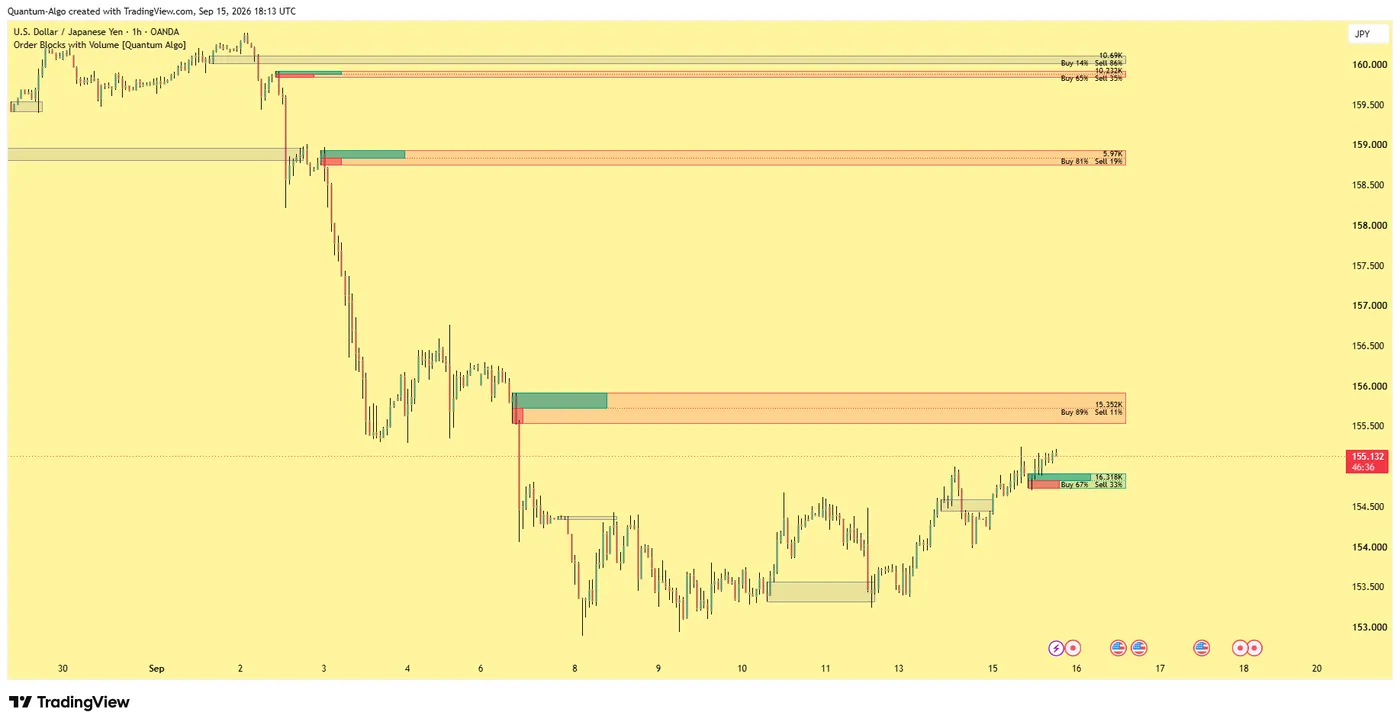
Order blocks from confirmed structure breaks, with buy/sell volume bars, a volume label and the 50% mitigation line.
Active → mitigated → invalidated → breaker (kept, re-coloured) or historic (frozen) or removed.
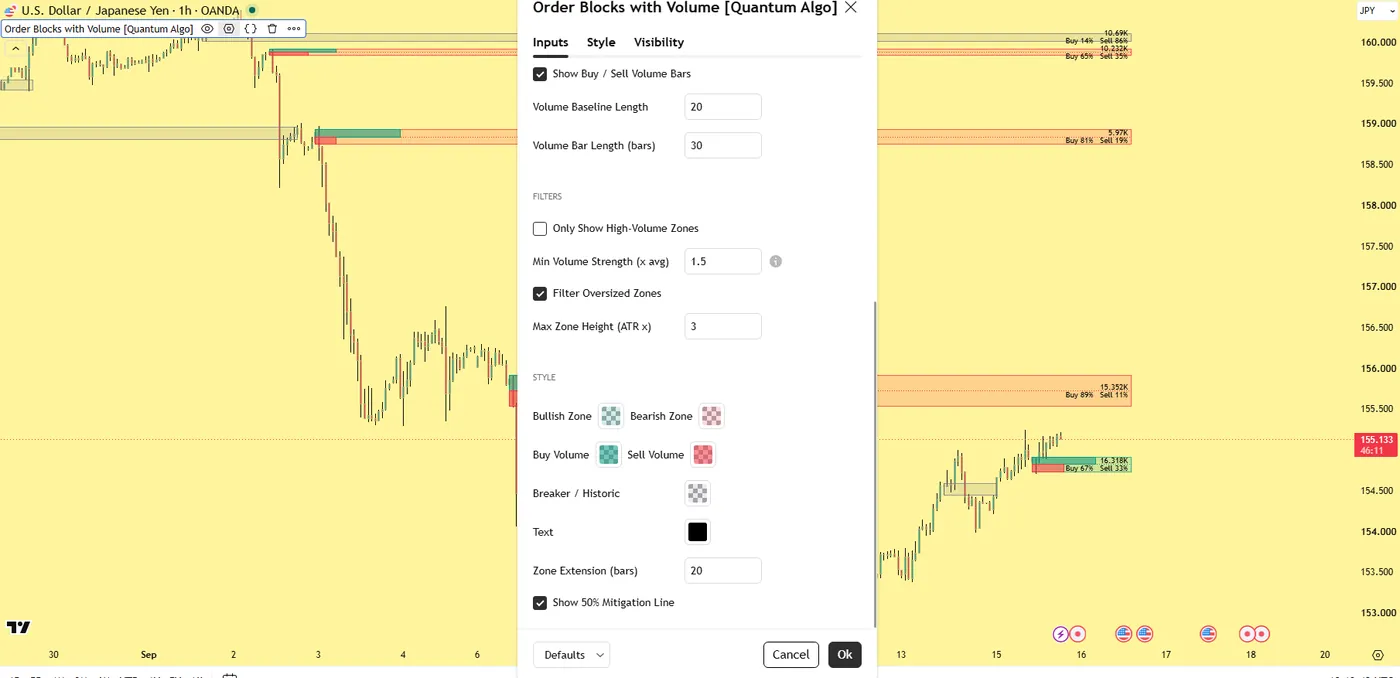
Only high-volume zones (× average) and only well-proportioned zones (max height in ATR).
What it draws
Bullish and bearish order block boxes
, projected forward from the origin candle until price returns.
Two inner bars per active zone
Buy volume on the top half, sell volume on the bottom — with lengths proportional to each side.
A volume label
On the right edge of each active zone: total volume and buy% / sell%.
A dotted 50% line
Through each active zone — the mitigation / equilibrium level.
Breaker zones
(re-coloured) when a broken block is kept, and historic zones (neutral, frozen) when invalidated blocks are retained for study.
The USDJPY 1-hour screenshot on this page shows two active blocks with their volume bars and labels; the settings screenshot shows the Filters group.
How detection works
Market structure. Confirmed swing highs and lows are located with a pivot of configurable length (Swing Length). Larger values isolate more significant structure and produce fewer, larger zones.
Break of structure. A candle close above the most recent confirmed swing high (bullish) or below the most recent swing low (bearish) is the trigger. Wicks do not count.
The origin candle. From the breakout, the script steps back over the impulse candles (up to the Impulse Lookback) and marks the last opposite-close candle before the move began — the last down-close for a bullish block, the last up-close for a bearish one. That candle is the origin of the displacement and the level price tends to revisit.
Zone range. The block is drawn from that candle using its full high-to-low range (Wick) or its open-to-close body (Body).
Detection runs on closed bars only; a confirmed zone does not move or disappear except through the life cycle below.
The volume engine
For each origin candle the indicator estimates how much of the traded volume was buying versus selling from where the candle closed within its own range — buy volume weighted by how close it closed to its high, sell volume by how close it closed to its low. The split is shown as the two inner bars and as the percentages in the label. Volume strength is the block's volume divided by the average volume over the Volume Baseline Length, and it drives the optional high-volume filter.
The reason this matters: a block built on 1.8× average volume with a 78/22 buy split was an institution stepping in; a block on 0.6× volume with a 51/49 split was noise that happened to precede a move. Our order-block guide's grading system scores this by eye; the indicator puts the number on the chart.
Zone life cycle
- Active — extends to the current bar with its bars and label.
- Mitigation — the first time price trades back into the zone; the 50% line marks equilibrium and an alert can fire.
- Invalidation — price moves through the far edge, by wick or by close (Invalidation Source).
- Breaker — with "Flip Broken Zones to Breaker Blocks" on, an invalidated zone is kept and re-coloured, because broken support acts as resistance and vice versa. Our breaker-block guide covers the trade.
- Historic — with "Keep Invalidated Zones (Historic)" on, finished zones freeze at the bar they died, re-coloured neutral, bars and text removed.
- With neither option on, invalidated zones are removed.
Anti-clutter rules: no new zone stacks on an active zone in the same area, active zones are capped per side, and zones older than the drawing range are dropped.
Settings
| Group | Input | What it does | Where to start |
|---|---|---|---|
| Structure & detection | Swing Length | Pivot length defining structure; higher = larger, more significant zones | 10–20 |
| Impulse Lookback (bars) | How far back to search for the origin candle | 30 | |
| Zone Range | Wick (full range) or Body (open–close) | Wick | |
| Max Active Zones / Side | Cap per direction | 3 | |
| Invalidation | Invalidation Source | Wick or Close | Close |
| Flip Broken Zones to Breaker Blocks | Keep and re-colour broken zones | on if you trade breakers | |
| Keep Invalidated Zones (Historic) | Freeze finished zones instead of deleting | off (on for study) | |
| Volume engine | Show Volume Label, Show Buy/Sell Volume Bars | The two displays | on / on |
| Volume Baseline Length | Averaging length for strength | 20 | |
| Volume Bar Length (bars) | Maximum bar length, kept inside the zone | 10 | |
| Filters | Only Show High-Volume Zones, Min Volume Strength (× avg) | Hide blocks below the threshold | on / 1.5 |
| Filter Oversized Zones, Max Zone Height (ATR ×) | Skip blocks taller than the limit | on / 2 | |
| Style | Colours, Zone Extension (bars), Show 50% Mitigation Line | Appearance | — |
Alerts
Two events through the alert() function: an order block tapped (mitigation) and an order block broken (breaker formed). Create an alert on the indicator and choose the "Any alert() function call" condition; the message names the zone.
How to use it
Order blocks mark where significant orders were placed; the trade is the return to an unmitigated block. The workflow that matches the indicator's design:
Set the bias on the higher timeframe — the SMC guide's method, or the swing tier of the Smart Money Concepts Engine.
Filter for quality. Turn on the high-volume filter at 1.5× and the oversized-zone filter at 2 ATR, so only well-proportioned blocks with real participation remain.
Wait for mitigation. Price returning to the zone is the event; the 50% line is the refinement. Look for rejection — a wick and a close back toward the block's origin side — or a change of character on a faster chart.
Stop beyond the block, target at the next liquidity. The stop-loss page covers the distance; the Liquidity Sweeps indicator marks the targets.
Trade the breaker when the block fails. A block that is closed through and re-coloured is the breaker; its first retest from the other side is the trade our breaker guide describes.
Three setups the volume split reveals
High-volume, one-sided block in a trend
(say 2.1×, 80/20): the strongest continuation entry; the block is where the institution bought and it will usually be defended once.
High-volume, balanced block
(1.9×, 52/48): heavy participation but a fight — often the block before a reversal; wait for the break-of-structure direction before choosing a side.
Low-volume block
(0.7×): filtered out by default, and for good reason — these are the zones that make order-block trading look random.
Recommended settings by market
Forex majors and gold (15m–1H):
Swing 10–15, Wick range, Close invalidation, high-volume filter 1.5× — note that CFD volume is tick volume and less reliable than exchange volume.
Crypto perpetuals (15m–4H):
Swing 15–20; exchange volume is real, so trust the split; breakers on.
Index futures and stocks (5m–1H):
Swing 10; cap active zones at 2 per side in the cash session to keep the chart clean.
How it compares
Against the standard free order-block scripts: most draw every last-opposite candle before any move, never grade them and never remove them; this one requires a confirmed break of structure, grades by volume, filters by size and strength, and manages the life cycle. Against the Smart Money Concepts Engine: the engine detects blocks as one element of a scored picture; this indicator goes deeper on the block itself — the buy/sell split, the filters, the breaker and historic modes. Against Zeno: Zeno's Institutional Gravity Zone is the multi-timeframe, signal-generating version with the entry, stop and targets on the chart.
Limitations
The buy/sell split is an estimate from close position within the candle, not exchange-reported buy and sell volume; on symbols with unreliable volume (many forex CFD feeds) the grading is indicative only. Zones are capped per side; on strongly trending charts older blocks drop off. No indicator generates buy or sell signals here — this tool highlights levels, and confirmation and risk are yours.
Step-by-step: adding it to your TradingView chart
Open the script page on TradingView (link above) and click Add to favorites, then Use on chart — or on any chart, open Indicators, search "Order Blocks with Volume Quantum Algo" and add it. It is free on every TradingView plan, including the free tier.
Open the indicator's settings (the gear icon on its label) and set the inputs for your market and timeframe from the table above; the defaults are tuned for crypto and gold on intraday charts.
In the Style tab, match the colours to your chart theme; the dashboard position and text size are in Inputs.
To set alerts, right-click the chart → Add alert, choose the indicator as the condition and pick the event you want; set the trigger to "Once per bar close" so alerts match the closed-bar logic.
Save the chart layout so the indicator loads with it, and — if you use our other free tools — add them to the same layout; they are designed to sit together without clutter.
To read or reuse the code, click Source code on the script page. Republishing is subject to TradingView's house rules; personal modification is not.
Inside the code, for developers
The script is Pine Script v5, published open source. The pieces worth reading if you want to modify it:
Pivot confirmation
Uses ta.pivothigh / ta.pivotlow with a symmetric lookback, which is why every structural event lags by the pivot length — the deliberate cost of a non-repainting result.
State is held in arrays
Of boxes, lines and labels with explicit life-cycle functions (create, update, retire), capped by the "keep" inputs; TradingView's object limits are respected by design.
Everything evaluates on barstate.isconfirmed
The developing bar is never used for detection or signals.
Alerts
Use named alertcondition calls (or alert() where the message carries data), so webhooks receive a consistent payload.
If you build on it, our Pine Script tutorials in the Academy and the TradingView backtesting guide cover strategy conversion and testing.
Using it with the other free indicators
The five Smart Money tools are built to layer: the Smart Money Concepts Engine for bias and the score; Order Blocks with Volume for the zone and its quality; Fair Value Gaps + Inversion for the imbalance and the polarity flip; Liquidity Sweeps for the trigger; Institutional Key Levels for the ranked map the rest is read against. A full read on one chart: bias from the engine's swing tier → the nearest ranked level → a sweep of the liquidity there → a return to a high-volume block or an inverted gap → entry with the stop beyond the sweep and the target at the next level. The free-indicators hub lists every tool; the SMC guide is the method behind the layering.
Common mistakes with this indicator
- Trusting the developing bar — every event here waits for the close, and so should you.
- Trading every marker — the tool highlights context and locations; the entry needs confirmation from structure and a stop beyond the level.
- Running it on the wrong timeframe with default lengths — adjust the pivot inputs to the chart, as the settings table shows.
- Ignoring volume quality — on CFD tick-volume feeds the volume features are indicative; on exchanges and futures they are real.
- Stacking too many tools — the five free indicators layer; ten random scripts do not.
Want the signal, not just the structure?
Zeno reads the same Smart Money structure across timeframes and prints the entry, stop, TP1 and TP2 on your chart — with a public record of 160 posted trades, 120 wins and 40 losses at the stated levels. QuantumBot executes it on Bybit, Binance, OKX, Bitget and Kraken.

Glossary for this indicator
Frequently asked questions
Does the order block indicator repaint?
No. Detection runs on closed bars only, so a confirmed zone does not move; it changes state only through the life cycle (mitigated, invalidated, breaker, historic).
What is the difference between wick and body zone range?
Wick draws the block from the origin candle's high to low; Body from its open to close. Body zones are tighter and suit tighter stops; wick zones capture the full liquidity the candle represents.
How is the buy/sell volume calculated?
From where the origin candle closed within its range: a close near the high weights the volume toward buying, near the low toward selling. It is an estimate, not exchange-side data.
What is a breaker block in this indicator?
An invalidated order block that is kept and re-coloured because broken support tends to act as resistance and vice versa. Enable "Flip Broken Zones to Breaker Blocks" to keep them; our breaker-block guide covers the trade.
Why don't I see any zones?
The high-volume or oversized filters may be hiding them, or the swing length is too large for the timeframe. Lower the volume threshold, raise the ATR limit, or reduce Swing Length.
Is it free?
Yes — open source on TradingView; read the code, use it, and follow the house rules if you republish.
How does it relate to Zeno?
This is the free, single-purpose block detector with volume; Zeno's Gravity Zone engine is the multi-timeframe version that prints signals with entry, stop, TP1 and TP2 and feeds QuantumBot.
Why does the indicator draw fewer blocks than others?
It requires a confirmed break of structure before locating the origin candle, caps active zones per side, refuses to stack a new zone on an active one, and hides low-volume and oversized blocks by default. Fewer, better zones is the design.
Which zone range should I use, wick or body?
Wick for the full liquidity the candle represents and wider stops; body for tighter zones and tighter stops. Most Smart Money traders use wick on higher timeframes and body on intraday charts.
Does it work on stocks and futures?
Yes, and the volume grading is at its most reliable there because exchange volume is real; on forex CFDs the split is indicative.
How do I get an alert when a block is tapped?
Create an alert on the indicator with the "Any alert() function call" condition; the message names whether a block was tapped or broken.
What is the difference between historic and breaker modes?
Breaker keeps a broken zone live and re-coloured so it can be traded from the other side; historic freezes it neutral for study without volume bars or text.
How does it relate to Zeno?
This is the free, single-purpose block detector; Zeno's Gravity Zone engine is the multi-timeframe version that prints the signal with entry, stop, TP1 and TP2.
The other free Smart Money indicators
Built to layer on one chart: the engine for bias and the score, the dedicated tools for each element.
Add Order Blocks with Volume to your chart
One click on TradingView, free on every plan, code you can read. Nothing repaints.