Liquidity Sweeps [Quantum Algo]
Buy-side and sell-side liquidity at every confirmed swing, the exact candle that sweeps and rejects it, a volume filter to separate conviction from noise, and the nearest un-swept pool on each side always in view.
The short answer
Liquidity Sweeps is a free, open-source TradingView indicator that maps resting liquidity at swing highs and swing lows — buy-side liquidity above highs, sell-side below lows — and flags the exact moment that liquidity is swept and rejected: a wick through the level and a close back inside, the classic stop hunt that Smart Money traders wait for. It extends each level until it is interacted with, distinguishes a sweep (wick through, close back) from a clean break (close through — no signal, level retired), optionally confirms sweeps with above-average volume, and shows a dashboard with sweep counts and the nearest un-swept level on each side with its distance from price. It is the companion to our liquidity sweep guide and the sweep layer of the Smart Money Concepts Engine on its own.
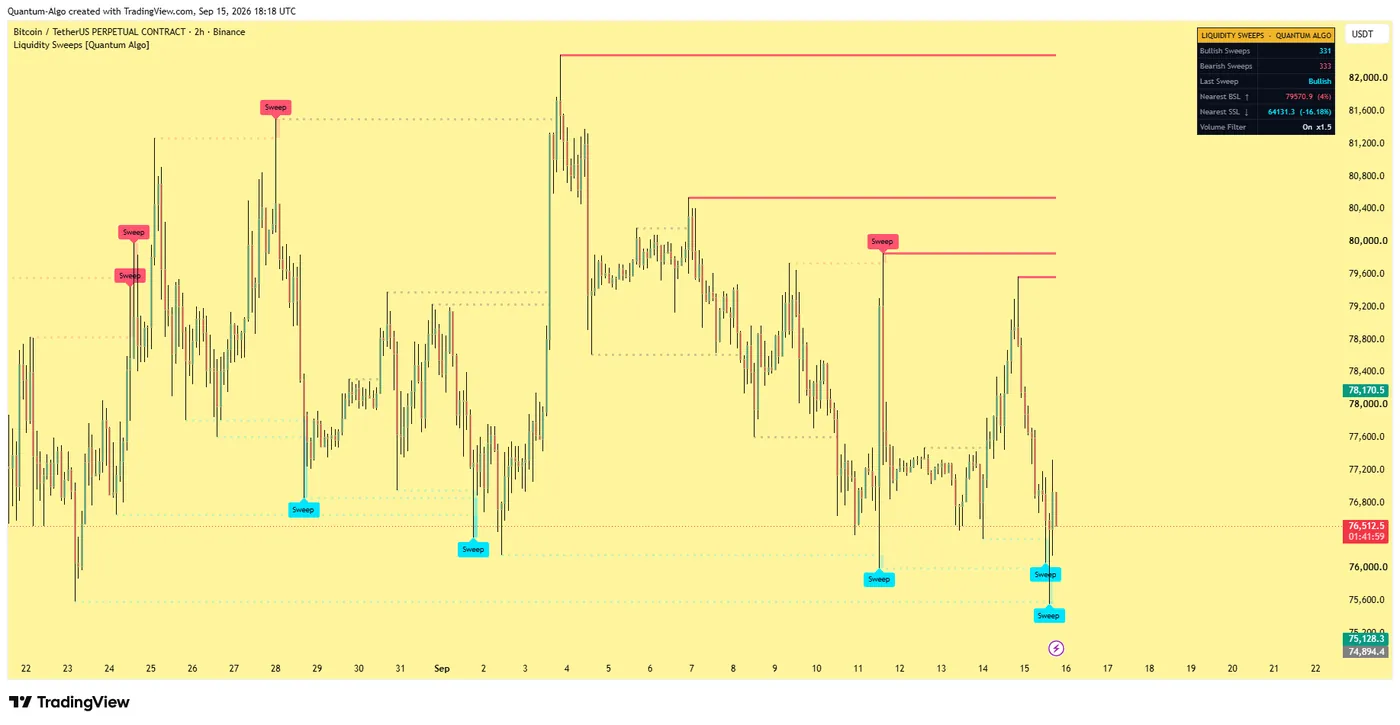
BSL and SSL levels at confirmed swings; sweep markers when a level is wicked through and closed back inside; optional wick highlight; a dashboard with the nearest un-swept pools.
Wick through + close back = sweep (signal). Close through = break (level retired, no signal).
Optional — only sweeps on above-average volume count.
What a liquidity sweep is
A liquidity sweep — also called a liquidity grab or stop hunt — is a brief spike beyond an obvious swing high or low, where stop-loss and breakout orders rest, followed by a close back inside the prior range. The wick takes the liquidity; the close shows the breakout failed. Liquidity above swing highs is buy-side liquidity (BSL): the buy stops of shorts and the entries of breakout buyers. Liquidity below swing lows is sell-side liquidity (SSL). A bearish sweep takes BSL and closes back below the high; a bullish sweep takes SSL and closes back above the low. The concept, the psychology and the trade are in our liquidity sweep and inducement guides; this page is the tool.
What it draws
Buy-side and sell-side liquidity levels
At every confirmed swing high and low, extended right until interacted with.
Bullish and bearish sweep markers
At the moment a level is swept and rejected.
Optional wick highlighting
On the sweep candle.
A dashboard
With bullish and bearish sweep counts, the last sweep direction, and the nearest un-swept BSL and SSL with their percentage distance from price.
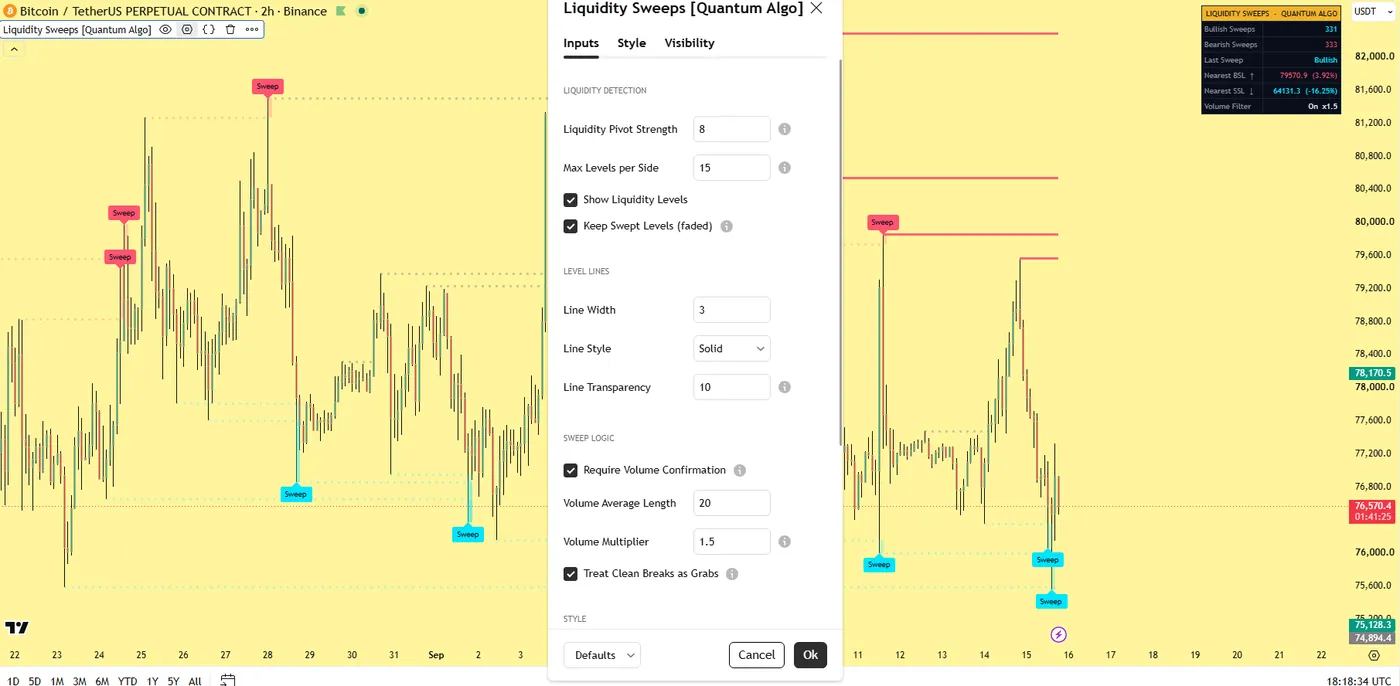
The Bitcoin 2-hour screenshot on this page shows mapped levels, a struck-through swept level and the sweep label; the settings screenshot shows the detection and volume groups.
How it works
Confirmed swing highs and lows are detected with a configurable pivot strength; a liquidity level is drawn at each. Higher strength keeps only the major pools.
Each level extends to the right until price interacts with it.
A candle that wicks through a level but closes back inside marks a sweep — label, optional wick highlight, alert.
With the volume filter on, a sweep counts only if the sweeping candle trades above its average volume by the configured multiple, which removes low-conviction wicks.
A candle that closes fully through a level is a clean break, not a sweep: the level is retired without a signal (with "Treat Clean Breaks as Grabs" on).
Everything is evaluated on closed bars; a sweep marker does not appear until the candle that made it has closed.
Settings
| Input | What it does | Where to start |
|---|---|---|
| Pivot Strength | Bars that define a swing; higher = fewer, more major pools | 10 (intraday), 5 (scalping), 15–20 (daily) |
| Max Levels per Side | Recent levels to keep mapped | 5 |
| Volume Confirmation (toggle, average length, multiplier) | Qualify a sweep by volume | on / 20 / 1.2 |
| Treat Clean Breaks as Grabs | Retire broken-through levels without a signal | on |
| Line width, style, transparency | Level visibility | — |
| Colours and dashboard position | Appearance | — |
Alerts
Three named conditions: Bullish Liquidity Sweep, Bearish Liquidity Sweep, and Any Liquidity Sweep.
How to use it
Sweeps are a timing and context tool, not a standalone system. The workflow the indicator is built for:
Map the pools. Let the levels mark the obvious highs and lows — the places stops rest. Note the nearest un-swept level on each side from the dashboard.
Wait for the sweep. A wick through and a close back inside, ideally with the volume filter confirming participation.
Confirm in your own process. A market-structure shift (the SMC Engine's CHoCH), a return to an order block (Order Blocks with Volume), a fair value gap fill or inversion, or higher-timeframe alignment — the sweep is the reason to look, not the reason to enter.
Define risk beyond the swept extreme. A bearish sweep above resistance can precede a move down; a bullish sweep below support can precede a move up; the stop goes beyond the wick that did the sweeping, as the stop-loss page explains.
Three sweep contexts worth knowing
Session sweeps.
The London open sweeping the Asian range, the New York open sweeping the pre-market range — the most repeatable sweeps on intraday charts, covered in our forex market hours and day-trading-crypto pages.
Equal highs/lows.
Two or more swings at the same price are a larger pool; the SMC Engine marks them as EQH/EQL; the sweep of an equal-level pool carries more weight than a single pivot.
Sweep-and-reclaim of a key level.
When the swept level is also a previous day's high or a clustered institutional level (the Institutional Key Levels indicator), the sweep is the highest-quality version of the pattern.
Recommended settings by market
Forex majors and gold, 15m–1H:
Pivot 10, volume filter on at 1.2× (CFD tick volume is indicative but still separates conviction from noise).
Crypto perpetuals, 15m–4H:
Pivot 10–15; exchange volume is real, so trust the filter; sweeps around funding times and the US open are the cleanest.
Index futures, 5m–15m in the cash session:
Pivot 5–8; the 9:30 sweep of the pre-market high or low is the daily event.
Daily charts:
Pivot 15–20; swept daily levels are swing-trade reversals.
How it compares
Against most liquidity scripts: those label every wick through every pivot and stack duplicates; this one distinguishes sweeps from clean breaks, filters by volume, retires used levels and reports the nearest un-swept pool. Against the Smart Money Concepts Engine: the engine's liquidity layer feeds the Confluence Score and handles equal highs and lows; this indicator is the single-purpose sweep tool with the volume filter and the dashboard distances. Against Zeno: sweeps are the first element of every Zeno signal — the reason the entry exists — and Zeno adds the structure confirmation, the entry, the stop and the targets.
Limitations
It is a technical analysis tool and does not predict price. A sweep can be followed by another sweep; confirmation is required. The volume filter depends on the quality of the symbol's volume data. No indicator is profitable on its own.
Step-by-step: adding it to your TradingView chart
Open the script page on TradingView (link above) and click Add to favorites, then Use on chart — or on any chart, open Indicators, search "Liquidity Sweeps Quantum Algo" and add it. It is free on every TradingView plan, including the free tier.
Open the indicator's settings (the gear icon on its label) and set the inputs for your market and timeframe from the table above; the defaults are tuned for crypto and gold on intraday charts.
In the Style tab, match the colours to your chart theme; the dashboard position and text size are in Inputs.
To set alerts, right-click the chart → Add alert, choose the indicator as the condition and pick the event you want; set the trigger to "Once per bar close" so alerts match the closed-bar logic.
Save the chart layout so the indicator loads with it, and — if you use our other free tools — add them to the same layout; they are designed to sit together without clutter.
To read or reuse the code, click Source code on the script page. Republishing is subject to TradingView's house rules; personal modification is not.
Inside the code, for developers
The script is Pine Script v5, published open source. The pieces worth reading if you want to modify it:
Pivot confirmation
Uses ta.pivothigh / ta.pivotlow with a symmetric lookback, which is why every structural event lags by the pivot length — the deliberate cost of a non-repainting result.
State is held in arrays
Of boxes, lines and labels with explicit life-cycle functions (create, update, retire), capped by the "keep" inputs; TradingView's object limits are respected by design.
Everything evaluates on barstate.isconfirmed
The developing bar is never used for detection or signals.
Alerts
Use named alertcondition calls (or alert() where the message carries data), so webhooks receive a consistent payload.
If you build on it, our Pine Script tutorials in the Academy and the TradingView backtesting guide cover strategy conversion and testing.
Using it with the other free indicators
The five Smart Money tools are built to layer: the Smart Money Concepts Engine for bias and the score; Order Blocks with Volume for the zone and its quality; Fair Value Gaps + Inversion for the imbalance and the polarity flip; Liquidity Sweeps for the trigger; Institutional Key Levels for the ranked map the rest is read against. A full read on one chart: bias from the engine's swing tier → the nearest ranked level → a sweep of the liquidity there → a return to a high-volume block or an inverted gap → entry with the stop beyond the sweep and the target at the next level. The free-indicators hub lists every tool; the SMC guide is the method behind the layering.
Common mistakes with this indicator
- Trusting the developing bar — every event here waits for the close, and so should you.
- Trading every marker — the tool highlights context and locations; the entry needs confirmation from structure and a stop beyond the level.
- Running it on the wrong timeframe with default lengths — adjust the pivot inputs to the chart, as the settings table shows.
- Ignoring volume quality — on CFD tick-volume feeds the volume features are indicative; on exchanges and futures they are real.
- Stacking too many tools — the five free indicators layer; ten random scripts do not.
Want the signal, not just the structure?
Zeno reads the same Smart Money structure across timeframes and prints the entry, stop, TP1 and TP2 on your chart — with a public record of 160 posted trades, 120 wins and 40 losses at the stated levels. QuantumBot executes it on Bybit, Binance, OKX, Bitget and Kraken.

Glossary for this indicator
Frequently asked questions
Does the liquidity sweep indicator repaint?
No. Levels come from confirmed pivots and sweep markers print only after the sweeping candle has closed.
What is the difference between a liquidity sweep and a liquidity grab?
Terms overlap in common use. In this indicator a sweep is a wick through with a close back inside (a rejection); a clean close through is treated as a break or grab and retires the level without a signal.
What is buy-side and sell-side liquidity?
Buy-side liquidity is the pool of buy orders resting above swing highs (short stops, breakout buys); sell-side liquidity is the pool below swing lows. Sweeps take one pool and reverse.
Should I enter on the sweep?
Not on its own. Use it as the trigger to look for confirmation — a structure shift, an order block, an imbalance — then enter with the stop beyond the swept extreme.
Which timeframe is best for liquidity sweeps?
Intraday sweeps are cleanest around session opens on 15-minute to 1-hour charts; daily-chart sweeps mark swing reversals. Adjust pivot strength to the timeframe.
Is it free?
Yes — open source on TradingView; the code is there to read.
How does it relate to Zeno?
Every Zeno signal starts with a sweep; this free indicator isolates that first element so you can study and trade it on its own.
What pivot strength should I use?
10 on intraday charts, 5 for scalping, 15–20 on the daily. Higher values keep only the major pools where the most stops rest.
Does the indicator mark equal highs and lows?
It maps every confirmed swing as a level; equal highs and lows are handled as a distinct feature in the Smart Money Concepts Engine, which pairs well with this tool.
Why did a level disappear without a sweep marker?
Price closed fully through it — a clean break — and with "Treat Clean Breaks as Grabs" on, the level is retired without a signal.
Can I get an alert only for bullish sweeps?
Yes — three named conditions: Bullish Liquidity Sweep, Bearish Liquidity Sweep, Any Liquidity Sweep.
Is a sweep a buy or sell signal?
No. It is the trigger to look for confirmation. A bearish sweep above resistance can precede a move down and a bullish sweep below support a move up, but the entry needs structure and a defined stop.
How does it relate to Zeno?
Every Zeno signal starts with a sweep; this free indicator isolates that first element so you can study and trade it on its own.
The other free Smart Money indicators
Built to layer on one chart: the engine for bias and the score, the dedicated tools for each element.
Add Liquidity Sweeps to your chart
One click on TradingView, free on every plan, code you can read. Nothing repaints.