Optimal Trade Entry: The OTE Zone, Sweet Spot and Silver Bullet
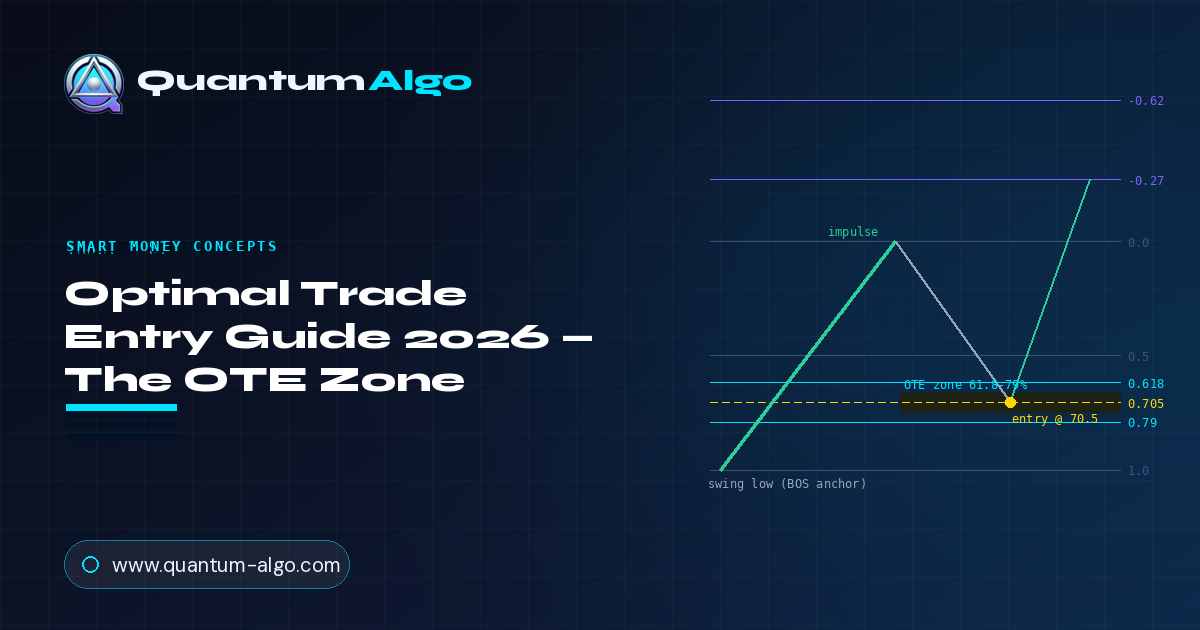
| Concept type | Smart Money entry model (ICT) |
| The zone | 61.8%–79% Fibonacci retracement of an impulse |
| Sweet spot | 70.5% — the statistical centre of the zone |
| Prerequisite | A confirmed break of structure (trend established) |
| Stop / target | Stop beyond leg origin · targets in the extensions |
| Confluence | FVG, liquidity sweep, Silver Bullet time window |
1. What Is the Optimal Trade Entry (OTE)?
The Optimal Trade Entry, or OTE, is a Smart Money Concept that answers one of the hardest questions in trading: once you know the direction, where exactly do you get in? Buying a confirmed uptrend sounds simple until you try it — chase the breakout and you enter with a terrible stop; wait too long and the move leaves without you. OTE gives that decision a precise, repeatable location.
The idea comes from ICT (Inner Circle Trader) methodology and rests on a specific observation about how institutions build positions. After a trend has been confirmed by a break of structure, price rarely runs in a straight line. It pulls back — and the depth of that pullback is not random. Large participants tend to complete their entries in the discount portion of the move (in an uptrend) or the premium portion (in a downtrend), which in Fibonacci terms is the 61.8% to 79% retracement of the impulse leg. The centre of that band, 70.5%, is treated as the statistical sweet spot.
So the OTE zone is not a magic price. It is the region where a defined-risk entry into an established trend has historically offered the best balance: deep enough that your stop (just beyond the origin of the leg) is tight, but not so deep that the trend itself is in question. Enter there and a small stop protects a move that targets the extension beyond the impulse high — the asymmetry that makes the whole model worth trading.
The same principle shows up on a live chart as a retest entry. Below, price ranged, broke out, then pulled back to retest the broken level before continuing — and the entry was taken on that pullback, not on the breakout chase. That is OTE logic in action: the retest is the discount, the breakout chase is the premium you avoid paying.
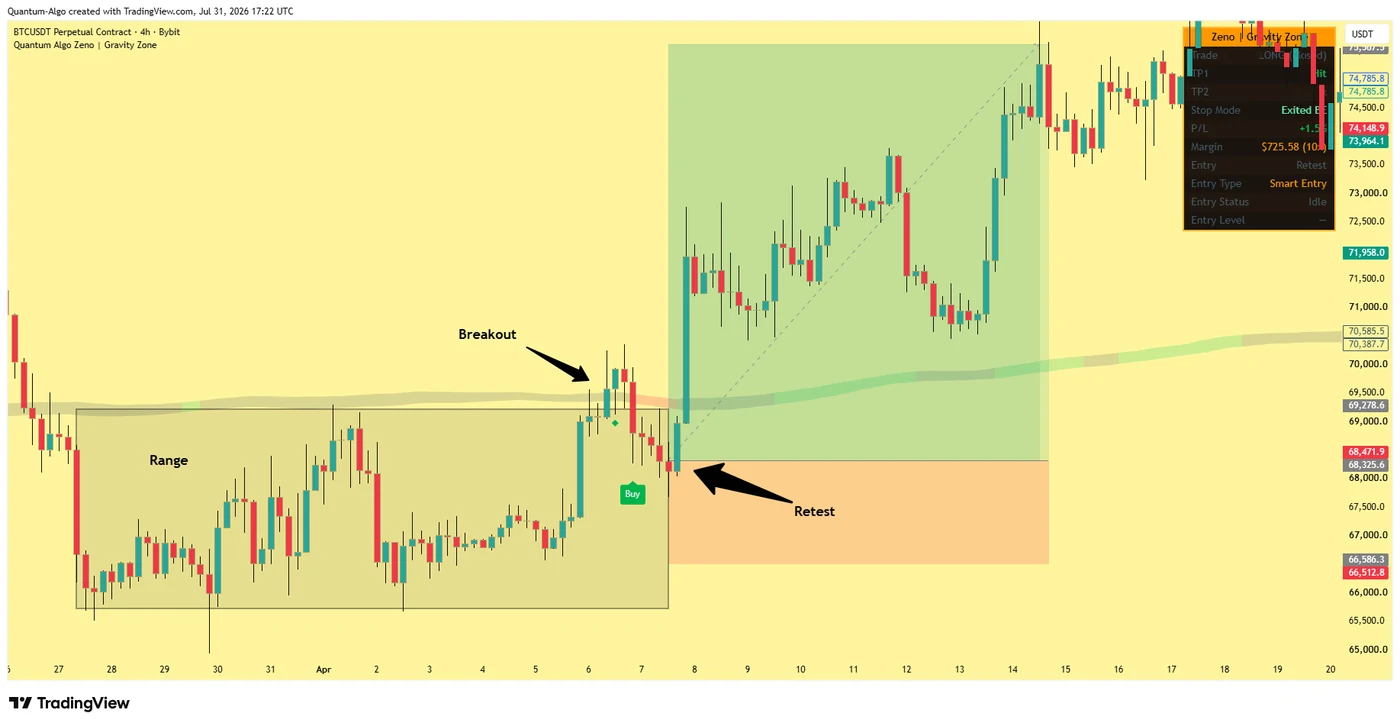
The Optimal Trade Entry is the 61.8%–79% retracement of a confirmed impulse leg — with 70.5% as the sweet spot — where institutions tend to complete entries. It converts "I know the direction" into "I know the exact price, stop and target."
2. Anatomy of the OTE Setup
Every valid OTE has the same four parts, in the same order. Miss one and you do not have an OTE — you have a Fibonacci drawn on hope. Here is the full sequence.
1. Break of structure
The trend must be confirmed first. Price closes through the last relevant swing high (for longs) or swing low (for shorts), shifting structure in your direction. Without a confirmed break of structure there is no established trend to enter — the OTE is a trend-continuation tool, never a top or bottom picker.
2. The impulse leg
The move that caused the break — from its origin (the swing point it started at) to its extreme (the running high or low). This leg is what you anchor the Fibonacci to. Anchoring to the wrong leg is the single most common OTE error, which is why automation matters.
3. The retracement into the zone
Price pulls back into the 61.8–79% band. The 70.5% sweet spot is the highest-probability fill. A retrace that stops short (above 61.8%) is shallow and less reliable; one that pushes past 79% toward the origin is warning that the leg may be failing.
4. The trade plan
Entry inside the zone, stop just beyond the leg origin (with a small volatility buffer), and targets projected into the negative Fibonacci extensions past the impulse extreme — commonly around −0.27 and −0.62. Defined before you click, never after.
Why the stop belongs beyond the origin
The stop placement is what makes OTE a defined-risk model rather than a guess. If price retraces into the zone and the trend is real, it should not return all the way to where the impulse began — doing so would mean the leg has been fully retraced and the structure that justified the trade is gone. So the origin of the leg is your line in the sand: beyond it, you are simply wrong, and a tight stop there gives the whole setup its favourable risk-to-reward. A deep entry (70.5%) with a stop just past 100% means you are risking the last ~25–30% of the leg to capture a move that extends beyond 100% of it.
3. Drawing the Fibonacci Correctly
OTE lives or dies on one skill: anchoring the Fibonacci to the right leg. Get the anchor right and the zone is meaningful. Get it wrong and you have drawn a beautiful, precise, completely useless grid. This is where most discretionary traders go wrong, and it is worth being exact about the rules.
Anchor to the impulse, not the noise
The Fibonacci goes from the origin of the leg that broke structure to that leg's extreme. Not the last little swing, not an arbitrary pivot — the specific move that shifted the trend. For a long: from the swing low the impulse began at, up to the running high.
Direction matters
In an uptrend you draw low-to-high, so the retracement levels sit below the high and the OTE zone is a discount. In a downtrend you draw high-to-low, so the zone is a premium above the low. The zone is always the region price pulls back into.
Stretch with the leg
While the trend keeps printing new extremes, the leg is not finished — so the anchor's far end moves with it. A retracement measured against a stale, half-complete leg gives a zone at the wrong prices. The grid should always describe the current, mathematically complete impulse.
Only after a close, not a wick
Structure breaks on a close through the swing point, not a wick that pokes and reverses. Anchoring off an unconfirmed wick produces phantom setups. Wait for the candle to close through the level before you trust the leg.
These four rules are precisely the errors that automation was built to remove. A tool that anchors the grid only after a confirmed break of structure, stretches it dynamically as the leg extends, and evaluates everything on closed bars is doing, mechanically and without emotion, what a disciplined trader does by hand — but consistently, on every setup, without anchoring to the wrong leg because a move "looked" like the impulse.
The OTE zone is only as good as the leg it is measured from. Anchor from the origin of the impulse that broke structure to that leg's extreme, draw in the direction of the trend, stretch as the leg extends, and only act on closed-bar confirmation. Wrong leg, wrong zone — no matter how precise the Fibonacci looks.

Automate your trades. Let Quantum Algo trade for you.
Every signal executed on your own account — 24/7, hands-off.
4. The Silver Bullet Time Windows
OTE tells you where to enter. The Silver Bullet model, also from ICT, adds when — and the combination is far stronger than either alone. The premise is that algorithmic price delivery is not uniform through the day. It concentrates around specific hours when the market is most likely to seek liquidity and fill inefficiencies. Restricting OTE entries to those hours filters out a large share of the setups that fail simply because they occurred in dead, directionless time.
There are three windows, each one hour long, defined in New York time:
The windows matter because they change what a signal means. An OTE tap at 70.5% during the New York Morning window, when institutional flow is active, is a genuinely different event from the same tap at 21:00 on a quiet Sunday. Same geometry, completely different context. Treating the window as a hard filter — only take OTE entries inside one — is the simplest and most effective way to raise the quality of the setups you act on.
A practical note: these windows are for the intraday application, and they only make sense on lower timeframes — one-minute to fifteen-minute charts, where a one-hour window contains enough bars to matter. The OTE Fibonacci engine itself works on any timeframe, but the Silver Bullet timing layer is an intraday tool.
5. Grading the Setup: Confluence That Actually Counts
Not every OTE tap is equal, and the difference between an average one and an exceptional one comes down to confluence — how many independent conditions line up at the same place and time. The strength of this approach is that the conditions are observable and verifiable, not vibes. Four of them carry most of the weight.
| Confluence factor | What it confirms | Why it matters |
|---|---|---|
| OTE zone tap | Price reached 61.8–79%, ideally 70.5% | The base condition — the entry location itself |
| Active Silver Bullet window | Entry occurred in a high-activity hour | Filters out dead-time setups that fail on low participation |
| Directional fair value gap | An imbalance in the trend direction on the leg | Shows the impulse left an inefficiency the market wants to revisit |
| Liquidity sweep at the origin | The leg began by running stops past the prior pivot | Confirms the move was engineered from a liquidity grab, not a random push |
Think of these as a grading scale rather than a checklist you must fully complete. A setup with all four — an OTE tap, inside an active window, with a directional fair value gap on the leg, following a liquidity sweep at the origin — is the highest grade you will find; call it A+. A tap with only the zone and the window is a lower grade. The point is not that lower grades never work, but that stacking independent confirmations tilts the odds, and being honest about how many are present keeps you from talking yourself into a weak setup.
This is exactly why a transparent grade beats a black-box signal. A grade that is simply a count of four observable conditions can be checked by anyone: is price in the zone, is the window active, is there a gap, was there a sweep? Nothing hidden, nothing curve-fit. A grade is a measure of confluence — a transparency tool — not a prediction of win rate, and treating it as the latter is a mistake.
Grade the setup
Four OTE taps below. Each lists which confluences are present. Click the A+ setup — the one with all four conditions aligned.
One discipline separates traders who profit from OTE from those who overtrade it: the grade decides whether you take the setup, and the geometry decides where. A high grade at a well-anchored zone in an active window is a trade. A low grade — zone only, no window, no gap, no sweep — is a pass, however tempting the clean Fibonacci looks.
6. The Complete OTE Trade, Step by Step
Here is the full sequence assembled — from empty chart to managed trade — for a bullish example. Reverse every direction for a short.
1. Confirm the trend
Wait for a candle to close above the last confirmed swing high — a genuine break of structure. Bias is now bullish. No break, no trade.
2. Anchor the Fibonacci
From the origin of the impulse (the swing low it began at) to the running high. Let it stretch if price keeps making new highs — the leg is not done until the trend pauses.
3. Wait for the retrace
Let price pull back into the 61.8–79% zone. Watch the live retracement depth. The 70.5% sweet spot is the target fill; a tap that stalls above 61.8% is shallow.
4. Check confluence
Is it inside an active Silver Bullet window? Is there a directional fair value gap on the leg? Did the origin sweep liquidity? The more that align, the higher the grade.
5. Enter with defined risk
Enter in the zone. Stop just beyond the leg origin (1.0) with a small volatility buffer. This is your invalidation — a full retrace means the setup failed.
6. Manage to the extensions
Targets project into the negative Fibonacci extensions beyond the impulse high — commonly around −0.27 (TP1) and −0.62 (TP2). Take partials, move to breakeven after displacement, and let the trend work.
Two invalidations are worth stating plainly, because they are where discipline is tested. First, a retracement that pushes past 79% toward the origin is a warning — the deeper price goes, the more the leg is in question, and a close beyond the origin ends the setup. Second, a strong counter-move can simply invalidate the leg before price ever reaches the zone; not every impulse gives you a clean retrace, and forcing an entry where the zone never properly formed is not an OTE trade.
7. Automating OTE: The Optimal Trade Entry + Silver Bullet Indicator
Everything in this guide can be done by hand — and doing it by hand first is the right way to learn it. But the two biggest sources of error in discretionary OTE trading are mechanical, and mechanical errors are exactly what automation removes: anchoring the Fibonacci to the wrong leg, and taking entries outside the hours when the model performs.
Our free, open-source Optimal Trade Entry + Silver Bullet indicator on TradingView was built to solve both. It is an ICT-style Fibonacci engine that does the mechanical work consistently, on every setup, with nothing hidden:
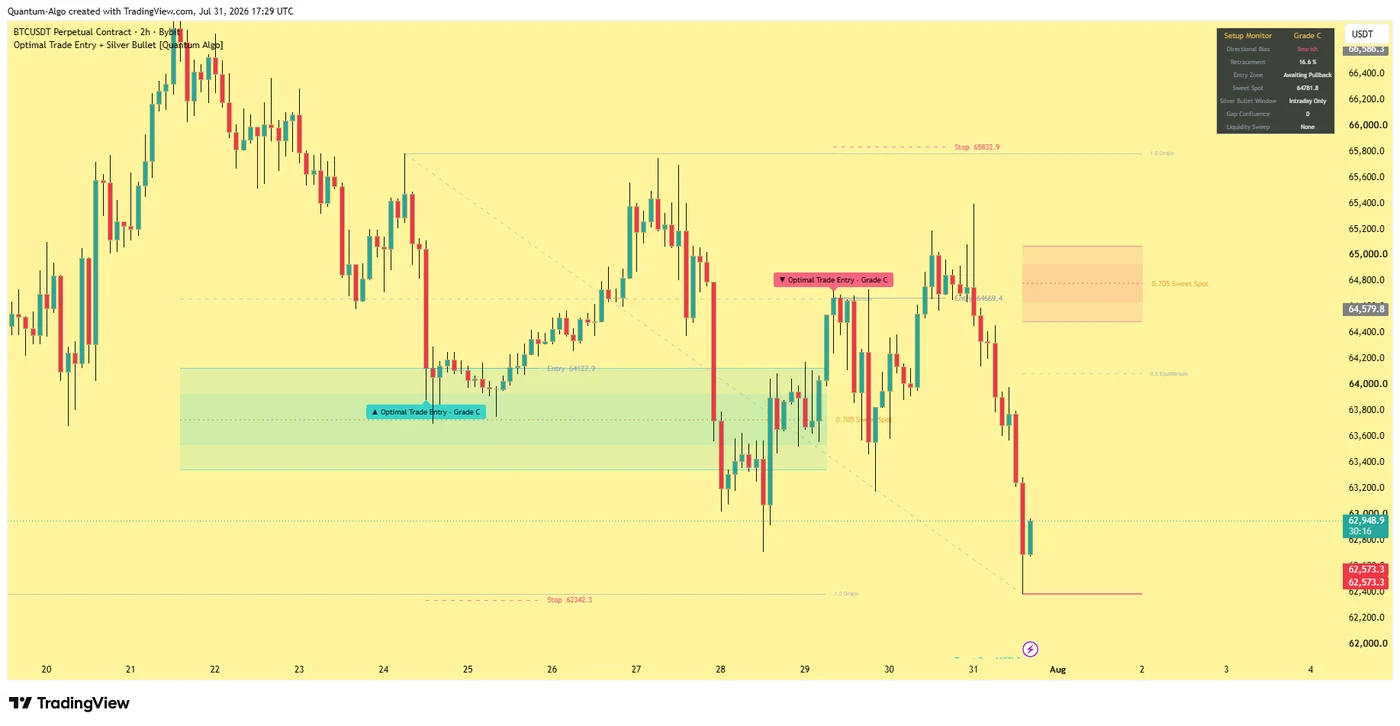
Reading that dashboard top to bottom is the whole workflow in one panel. A bearish bias, a live retracement of 16.6% (price has barely pulled back — the zone is "awaiting pullback"), the sweet-spot price it is watching, an intraday-only Silver Bullet window, zero gap confluence and no liquidity sweep — which together produce the honest Grade C. Nothing about that grade is hidden: you can see exactly why it is a C and not an A+, because every condition it counts is shown.
Automatic anchoring
The Fibonacci grid never requires manual placement. It appears only after price closes through a confirmed swing point — a genuine break of structure — and anchors to the true origin of the impulse. This removes the wrong-leg error entirely.
Dynamic leg stretching
While the trend keeps printing new extremes, the grid stretches in real time, so the OTE zone is always measured against the current, complete leg — never a stale one.
Time-based qualification
The three Silver Bullet windows are wired directly into the signal engine, not drawn as decorative shading. A tap inside an active window grades higher — the timing filter is part of the signal, not an afterthought.
Transparent A+ / A / B / C grading
Every signal is graded on four observable conditions — zone tap, active window, directional fair value gap, and liquidity sweep at the origin. Nothing is hidden, nothing repaints (signals evaluate on closed bars only), nothing is curve-fit.
The indicator also boxes qualifying fair value gaps, detects the liquidity sweep at the leg origin, and prints a full trade plan — Entry, Stop, Target One and Target Two, each labelled with its exact price — plus a dashboard tracking bias, live retracement percentage, zone status, the sweet-spot price, the active window, gap confluence and sweep status. It works on any symbol with candle data (crypto, forex, gold, indices, stocks, futures); the one-minute to fifteen-minute range is the classic application for the Silver Bullet windows, while the OTE engine alone functions on any timeframe.
In keeping with our approach — don't trust us, verify us — the script is fully open-source, so you can read exactly how every level and grade is computed. Add it to your chart and the whole workflow in this guide runs automatically.
Optimal Trade Entry + Silver Bullet [Quantum Algo] on TradingView — automatic Fibonacci anchoring, the three Silver Bullet windows wired into the signal engine, transparent A+/A/B/C confluence grading, non-repainting closed-bar signals, and a full labelled trade plan. Free to use, open-source to verify.
8. Test Your Knowledge
Seven questions covering the OTE zone, anchoring, Silver Bullet windows and confluence.
9. OTE Within a Full Smart Money Framework
The Optimal Trade Entry is one piece of a larger Smart Money picture, and it is strongest when the pieces reinforce each other. OTE gives you the entry location; the rest of the framework tells you whether that location sits where institutional intent actually is.
The connections are direct. The break of structure that OTE requires is the same shift a structure-mapping tool marks. The liquidity sweep that grades a setup higher is the engineered stop-run that begins many institutional legs. The fair value gap confluence is the imbalance the impulse left behind. And an order block sitting inside the OTE zone is confluence of the highest order — the exact price where the model and the structure agree.
• Buy/sell signals with built-in SL and TP — structural entries with risk defined before you click
• Tidal Force momentum confirmation — confirms the impulse behind an OTE leg is real
• Break of structure mapping — the prerequisite the OTE model is built on
• Order block and FVG detection — the confluence that upgrades an OTE zone
• Multi-timeframe confluence scoring — so a zone that aligns across timeframes scores higher
• ATR-based risk management — stops beyond the leg origin, sized to volatility
The habit to build: use structure and liquidity to decide whether the trend is worth trading, then use OTE to decide exactly where to enter it. The Fibonacci is not a standalone edge — it is the precision instrument you point at a setup the rest of your framework has already validated.
Frequently Asked Questions
The Optimal Trade Entry is a Smart Money Concept from ICT methodology that identifies the best area to enter a confirmed trend. It is the 61.8% to 79% Fibonacci retracement of an impulse leg, with the 70.5% level as the statistical sweet spot. After a break of structure confirms the trend, price often retraces into this zone — the discount in an uptrend or premium in a downtrend — where institutions tend to complete their entries, offering a defined-risk entry with a tight stop and a target in the extensions.
The OTE zone is bounded by the 61.8% and 79% retracement levels of the impulse leg, with 70.5% as the sweet spot in the middle. The full grid also references the origin (1.0), equilibrium (0.5), the impulse extreme (0.0), and negative extensions beyond the extreme — commonly around -0.27 and -0.62 — which serve as profit targets. Entry is inside the 61.8-79% band, the stop sits beyond the 1.0 origin, and targets project into the extensions.
Just beyond the origin (the 1.0 level) of the impulse leg, with a small volatility buffer. If price fully retraces the leg back past its origin, the structure that justified the trade is gone and the setup has failed. Because the entry is deep (around 70.5%) while the stop is only just past the origin, the risk is small relative to the reward, which projects into the extensions beyond the impulse extreme.
The Silver Bullet windows are three one-hour periods, defined in New York time, when algorithmic price delivery is most likely to seek liquidity and fill inefficiencies: the London Open window (03:00-04:00), the New York Morning window (10:00-11:00), and the New York Afternoon window (14:00-15:00). Restricting OTE entries to these windows filters out many setups that fail in dead, low-participation hours. They apply to the intraday application, on timeframes of one hour or below.
Anchor the Fibonacci from the origin of the impulse leg that broke structure to that leg's extreme - low to high in an uptrend, high to low in a downtrend. Only anchor after a candle closes through the swing point (not a wick), and let the grid stretch as the leg keeps extending so it always describes the current, complete impulse. Anchoring to the wrong leg is the most common OTE error, which is why automated tools that anchor only on a confirmed break of structure are valuable.
An A+ setup stacks four observable confluences: price taps the 61.8-79% OTE zone (ideally 70.5%), the tap occurs inside an active Silver Bullet window, a directional fair value gap formed on the impulse leg, and the leg origin swept liquidity by running stops past the prior pivot. The grade is simply a count of these conditions - a transparency tool showing how much confluence is present, not a prediction of win rate. Fewer conditions means a lower grade and a weaker setup.
A well-built OTE tool should not. Signals should be evaluated on closed bars only, and swing pivots require confirmation by design, which introduces intentional lag but keeps historical signals fixed once printed. The Quantum Algo Optimal Trade Entry + Silver Bullet indicator evaluates entries on closed bars and confirms structure with a symmetric pivot lookback, so past signals do not move. The trade-off for non-repainting is that the engine describes confirmed structure rather than predicting it.
The OTE Fibonacci concept works on any symbol with candle data - crypto, forex, gold, indices, stocks and futures - and on any timeframe. The Silver Bullet timing layer, however, requires an intraday chart of one hour or below, since the windows are one hour long; the one-minute to fifteen-minute range is the classic application. Use OTE on liquid instruments where structure is clean, and remember the windows reference New York time regardless of your chart's timezone.
More guides
References & Related Guides
More in this topic
- Who Is ICT (Michael J. Huddleston)? The Trader Behind Killzones, FVGs and the 2022 Model
- Premium and Discount Zones: Complete Guide 2026
- Fibonacci Retracement 2026 - Complete Trading Guide
- ICT Trading Strategy: Complete Interactive Guide 2026
- Liquidity Sweep Trading: Stop Hunts Explained (2026)
- Smart Money Concepts (SMC): Ultimate Trading Guide 2026
- BOS & CHoCH: Complete Market Structure Guide 2026
- Institutional Trading Strategy 2026: Trade Like Banks
- Order Flow Trading 2026 - Read the Footprint of Institutions
- Breakout Trading Strategy: Complete Guide (2026)
- Trend Trading Strategy: The Complete Guide (2026)
- Support & Resistance: Complete Trading Guide (2026)
- Wyckoff Method 2026 - Complete Institutional Trading Guide
- Risk Management in Trading 2026 - Complete Guide
Core reading
- ICT Trading Strategy: Complete Interactive Guide 2026
- Fibonacci Retracement 2026 - Complete Trading Guide
- Smart Money Concepts (SMC): Ultimate Trading Guide 2026
- Liquidity Sweep Trading: Stop Hunts Explained (2026)
- Risk Management in Trading 2026 - Complete Guide
- All Premium Guides
- Quantum Algo on TradingView
- Public Verified Track Record