Choppiness Index: The Indicator That Tells You Whether to Trade, Not Which Way
The Choppiness Index (CHOP) is a volatility indicator, created by E. W. Dreiss, that measures whether a market is trending or moving sideways on a 0–100 scale: above 61.8 is choppy — consolidating, ranging — and below 38.2 is trending strongly. It does not say which direction, only whether there is one, which makes it the rare indicator whose best use is telling you not to trade: a Smart Money setup that prints while the index sits above 61.8 is a setup inside a range, where most losing structure trades live.
Every trader has a journal full of setups that were correct on structure and wrong on regime — the sweep, the change of character, the retest, and then nothing, because the market was in a box. The Choppiness Index is the number that says "box" before you find out. This page is the pane and its two thresholds, the formula, a reading table, the gate strategy with a worked losing week turned positive, the comparison with ADX and the Bollinger squeeze, settings, presets by market and the mistakes. The regime reader below turns a reading and its direction into permission.
Indicators that prove themselves in public.
One engine, four precision tools — the Gold (XAU) Scalper, the institutional Gravity Zone, the Zeno momentum Oscillator, and Zeno Stocks for equities.



What is the Choppiness Index?
The Choppiness Index (CHOP) is a volatility indicator, created by commodities trader E. W. Dreiss, that measures whether a market is trending or moving sideways on a scale from 0 to 100: readings above 61.8 mean price is choppy — consolidating, ranging, going nowhere — and readings below 38.2 mean price is trending strongly in one direction. It does not say which direction; it says whether there is a direction at all. That makes it the rare indicator whose best use is to tell you not to trade: a Smart Money setup that prints while the Choppiness Index sits above 61.8 is a setup inside a range, and most of the losing trades in a structure trader's journal are exactly that. Used as a regime filter beside structure, it removes them.
The pane
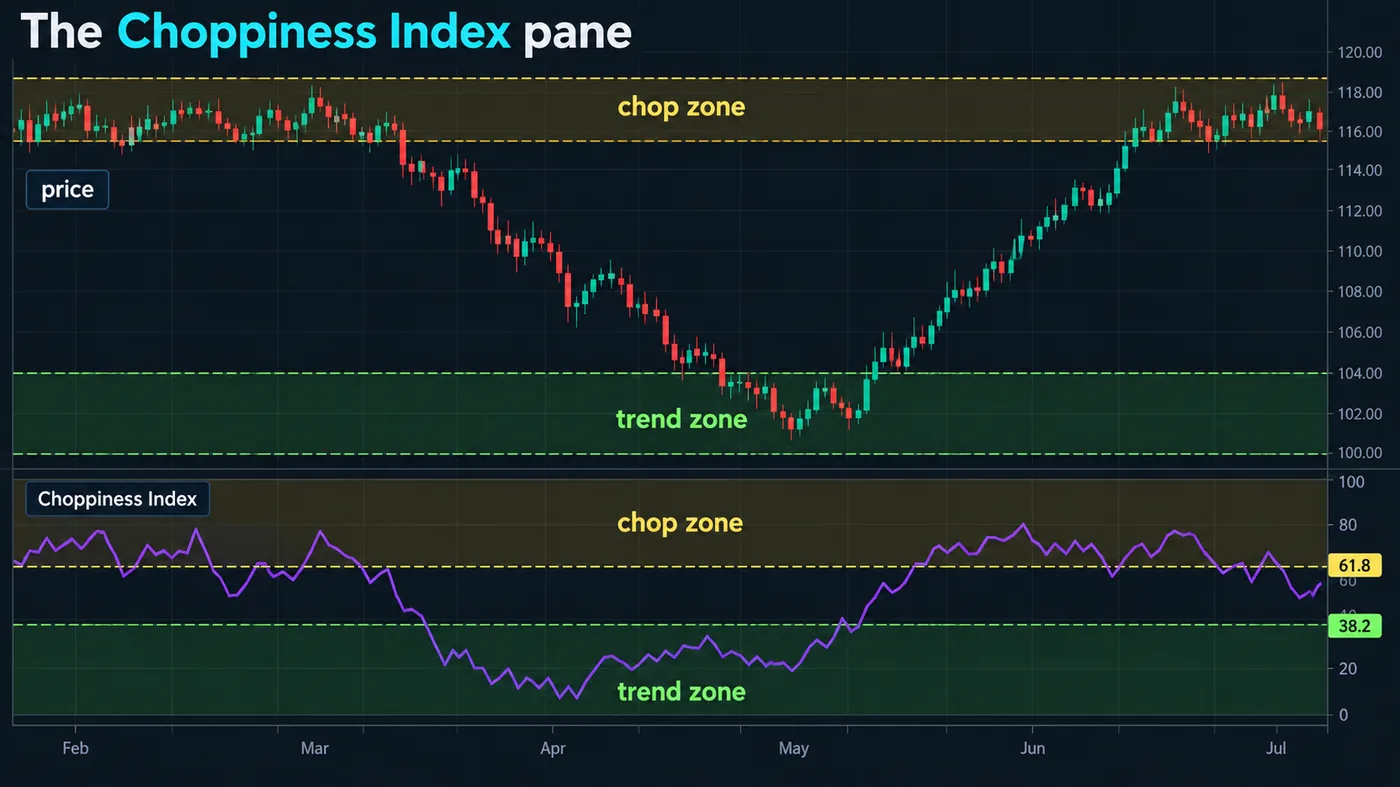
The illustration in this guide shows the Choppiness Index under price with its two lines: 61.8 (the upper Fibonacci level) and 38.2 (the lower). Above 61.8 the pane and the price chart are shaded as a chop zone — price is inside a box, the index is high; below 38.2 they are shaded as a trend zone — price is expanding, the index is low. The stretch in between is the transition: a falling index means a range is resolving into a trend; a rising index means a trend is tiring into a range.
Two things to notice: the index tends to lead the eye — it starts falling as the range's last bars compress, before the breakout bar; and it tends to peak after the range is obvious, which is why readings above 61.8 are a "no trade" signal rather than a "fade the range" signal.
How it is calculated
CHOP = 100 × log10( Σ ATR(1) over n ÷ (highest high − lowest low over n) ) ÷ log10(n), with n = 14 by default. The numerator sums each bar's true range over the window; the denominator is the total range the window covered. If the bars' ranges add up to far more than the net range — price went up and down a lot but ended near where it started — the ratio is high and the index reads choppy. If the bars' ranges add up to roughly the net range — price went one way — the ratio is near 1 and the index reads trending. The log scaling and the 14-period window are Dreiss's choices; the 61.8 and 38.2 thresholds are the Fibonacci levels he suggested and the ones every platform ships with.

Automate your trades. Let Quantum Algo trade for you.
Every signal executed on your own account — on your account, with the plan you define.
How to read it
| Reading | Regime | What to do |
|---|---|---|
| Above 61.8 | Choppy / ranging | No trend trades; range trades only at the range edges, or wait |
| Falling through 61.8 | Range resolving | Prepare — the breakout is forming; look for the sweep and the structure |
| 38.2 – 61.8, falling | Trend developing | Trade with the direction the structure shows |
| Below 38.2 | Strong trend | Trend continuation trades; do not fade |
| Rising from below 38.2 | Trend tiring | Take profits at structure; expect a range |
| Above 61.8 for many bars | Extended range | The move, when it comes, is usually large |
The filter in use
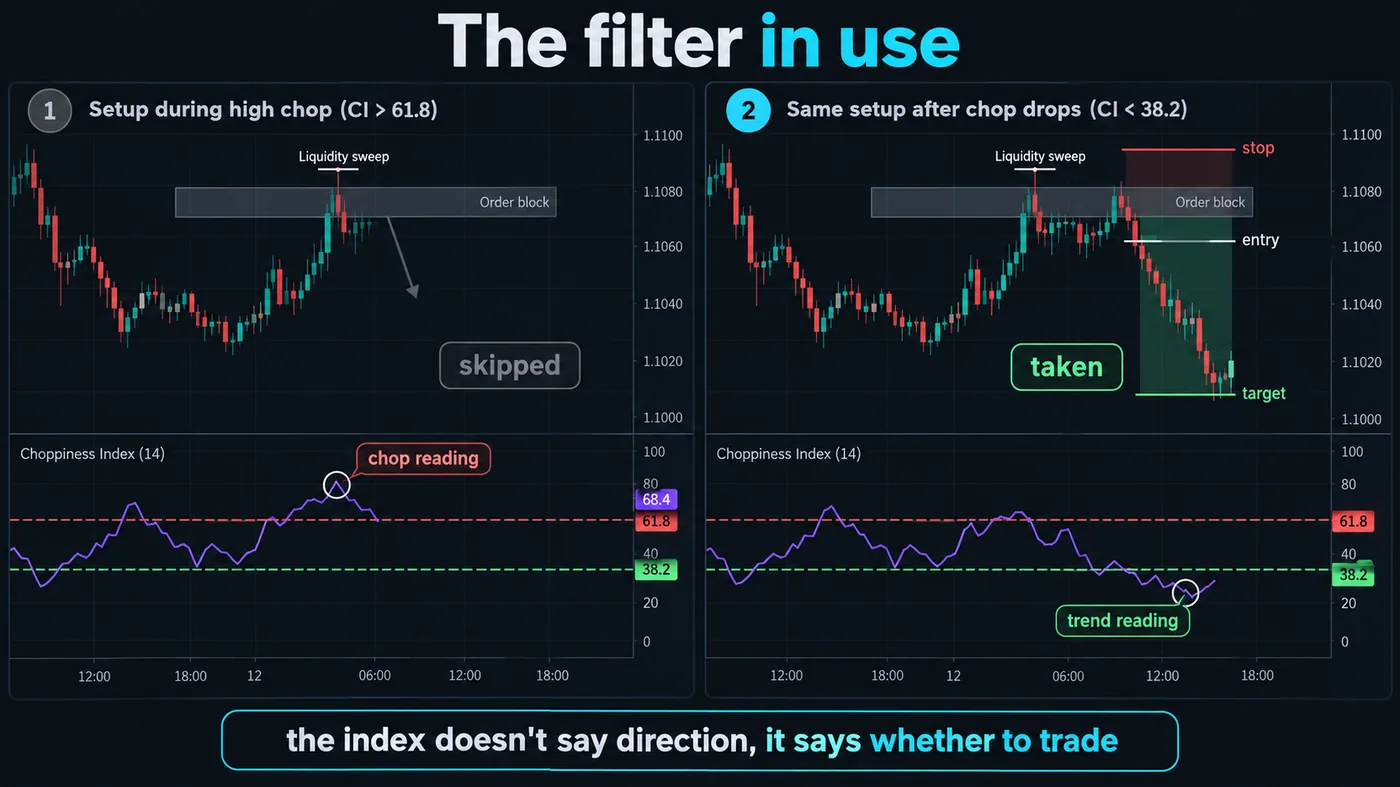
The two-panel illustration in this guide is the reason the page exists. Left: a Smart Money setup — sweep, change of character, retest of the order block — printed while the Choppiness Index read 68. The setup was skipped (greyed); price went nowhere, then swept the other side. Right: the same setup two days later, after the index had fallen through 61.8 and was heading for 38.2; taken, and it ran. The callout: the index doesn't say direction, it says whether to trade. The structure gives the direction and the location; the Choppiness Index gives permission.
The strategy: Choppiness as a regime gate
- Structure first. Bias from the higher timeframe; the setup from the Smart Money Concepts Engine, the Order Blocks or Fair Value Gaps tools, or a ranked level.
- Gate it. Take the setup only if the Choppiness Index on the trading timeframe is below 61.8 and falling, or already below 38.2 in the setup's direction.
- Skip it if the index is above 61.8 — however good the setup looks. Write it in the journal as "skipped: chop".
- The exception — range trading at the edges: if you deliberately trade the range (fade the swept high or low back to the middle), the index above 61.8 is the confirmation that the range is intact.
- Exit signal — in a trend trade, the index rising back through 38.2 is the cue to take profits at the next structure rather than hold for more.
After fifty trades with the gate, compare the journal with the fifty before it; most structure traders find the gate removed a quarter of their trades and most of their losses.
Choppiness Index versus ADX
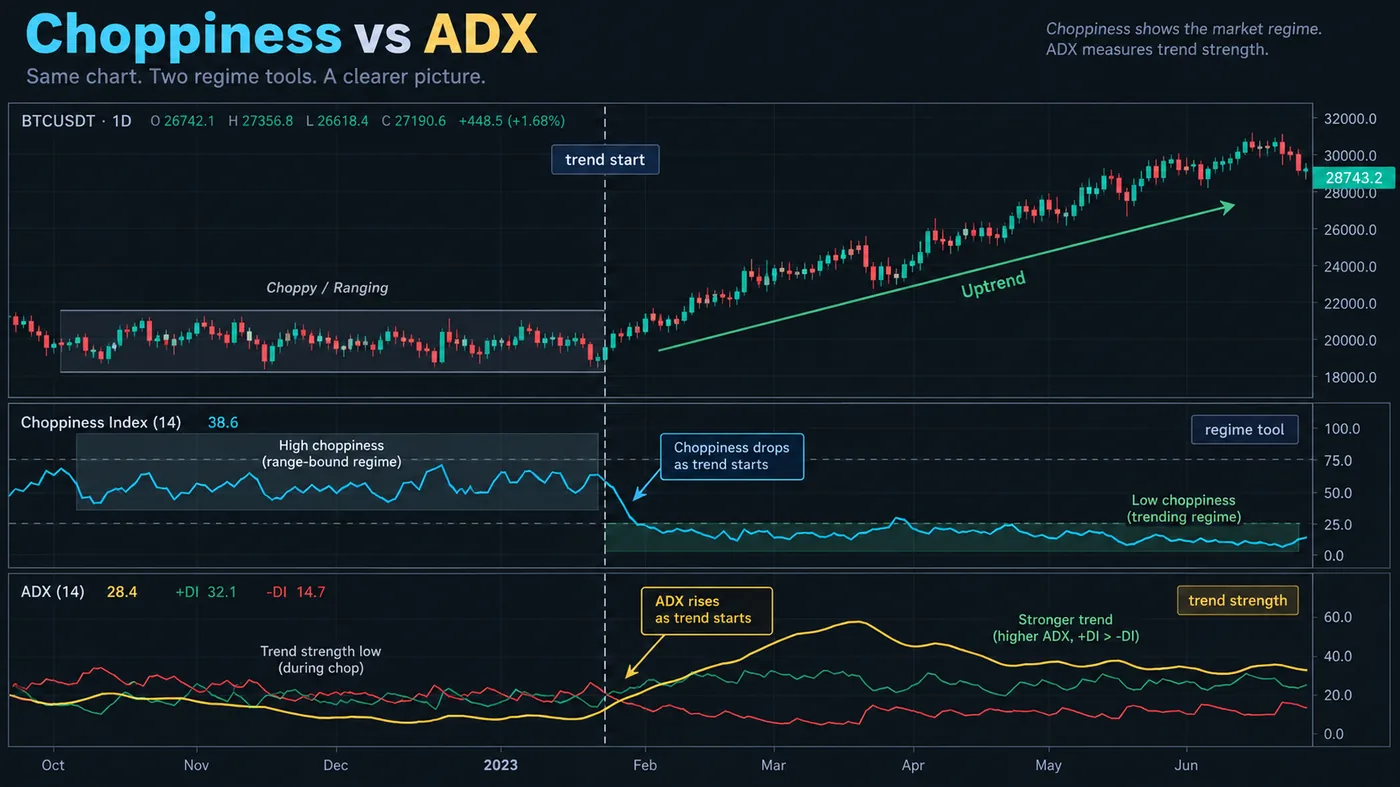
The comparison illustration in this guide runs both on the same chart at a trend start. The ADX (from the Directional Movement Index) measures trend strength from directional movement and rises as a trend develops — it confirms trends late. The Choppiness Index measures the inefficiency of price movement and falls as a range compresses — it often warns before the trend starts. They agree on strong trends (ADX high, CHOP low) and on ranges (ADX low, CHOP high) and disagree at transitions, where CHOP is usually earlier. Use CHOP to decide whether to trade, and ADX, if at all, to confirm the trend has strength once you are in. Our ADX guide covers the second.
Settings
| Input | Default | Note |
|---|---|---|
| Length | 14 | Shorter (7–10) for scalping, longer (20–28) for swing; the thresholds stay |
| Upper threshold | 61.8 | Some traders use 60; keep the default until fifty trades say otherwise |
| Lower threshold | 38.2 | Some use 40 |
| Timeframe | The trading timeframe | Run a second copy on the higher timeframe as the outer gate |
Recommended use by market
- Forex and gold, 15m–1H: the index above 61.8 through the Asian session is normal; the fall through it at the London open is the daily breakout cue.
- Crypto, 1H–4H: weekends push the index high; a Monday fall through 61.8 with the US open is the cleanest signal.
- Indices, 5m–15m: the index compresses into the last hour before the cash open; the opening-range break is the resolution.
- Daily charts: an index above 61.8 for weeks marks the ranges that end in the year's biggest moves; the gate on the daily is the swing trader's regime filter.
Mistakes
- Reading it as direction — it has none.
- Fading a range because the index is high — high means range, not reversal; the edges and the structure decide.
- Shortening the length until it whipsaws — 14 is right for most; the thresholds are the sensitivity control, not the length.
- Trading the crossing of 61.8 as a signal — it is a permission change; the setup is still the structure.
A worked example: the gate on a losing week
A structure trader's journal, one week, EUR/USD 15-minute: nine setups taken, three winners, six losers, net −2.1R. Re-run with the gate — take only setups printed while the Choppiness Index was below 61.8 and falling, or below 38.2. Five of the nine setups printed above 61.8; four of those five were losers. The gated week: four setups, three winners, one loser, net +4.3R. The same chart, the same rules, the same trader; the only change was permission. That is not a promise the gate always does this — a trending week loses nothing to it — but it is why the index earns its pane: the trades it removes are disproportionately the ones inside ranges, which is where structure setups fail.
The gate checklist
- Choppiness length 14, thresholds 61.8 / 38.2, on the trading timeframe.
- A second copy on the higher timeframe as the outer gate.
- Setup from structure; the index never supplies direction.
- Take the setup only below 61.8 and falling, or below 38.2.
- Above 61.8: skip, and log it as "chop".
- Range trades at the edges are the one exception, and the index above 61.8 is their confirmation.
- In a trend trade, the index rising back through 38.2 is the profit-taking cue.
- After fifty gated trades, compare with the fifty before.
Choppiness and volatility compression
A high, flat Choppiness reading and a Bollinger Band squeeze are the same observation from two angles: the sum of the bars' ranges is large relative to the net range, and the standard deviation of closes is low. The difference is what happens next. Bollinger Bands widen on the breakout bar; the Choppiness Index has usually started falling a few bars earlier as the range's final bars compress and the net range begins to extend. The Volatility Storm Tracker among our free tools reads the same compression; the Choppiness Index is the simplest version, and the one every platform ships with.
One number, no direction, one job: permission. Above 61.8, the setup is inside a range and you skip it; below 38.2, the trend is real and continuation setups have the regime on their side; between, read which way the index is moving. Fifty gated trades against the fifty before them is the test, and for most structure traders it removes a quarter of the trades and most of the losses.
◆ Interactive check
Do you know what it measures?
Questions traders ask about the Choppiness Index
Below 38.2 for a trend trade, above 61.8 for a range; between the two, read the direction of the index — falling means a trend is developing, rising means it is tiring.
Partly — it falls as a range's last bars compress, often before the breakout bar, which is earlier than trend-strength tools such as ADX. It does not lead direction.
CHOP to decide whether to trade, ADX to confirm trend strength once in. CHOP is usually earlier at transitions; ADX is steadier inside trends.
Length 14 with the 61.8 / 38.2 thresholds. Shorten the length only for scalping; tune the thresholds only after fifty logged trades.
Yes, on any timeframe; weekends read choppy, and the fall through 61.8 with the US open is the cleanest breakout cue.
Not inside Zeno; the regime read there comes from structure. The Choppiness Index is a compatible gate — many subscribers run it under Zeno to skip the setups that print inside ranges.
100 × log10(sum of ATR(1) over n ÷ (highest high − lowest low over n)) ÷ log10(n), n = 14 by default. Ranges that add up to far more than the net range read choppy; ranges that equal the net range read trending.
Australian commodities trader E. W. Dreiss, who also chose the 61.8 and 38.2 Fibonacci thresholds every platform ships with.
Yes — a built-in under "Choppiness Index" with the 14 length and the two thresholds; several open-source versions add shading.
Not directly — it has no direction. Use it as the gate on a structure setup: the setup gives the entry, the index gives permission.
Length 7–10 on 1- to 5-minute charts with the thresholds unchanged; on anything slower keep 14.
Not inside Zeno, where the regime read comes from structure; many subscribers run it under Zeno as a gate to skip setups that print inside ranges, which is the use this page recommends.
References & Related Guides
Read next
- ADX Indicator: Complete Guide
- Bollinger Bands: Complete Guide
- Traders Dynamic Index (TDI)
- ATR: Average True Range
- Smart Money Concepts: Complete Guide
- Smart Money Concepts Engine (free indicator)
- Trading Journal: Complete Guide
- Zeno — the premium engine