Liquidation in Trading: Magnets, Cascades and the Sweep-and-Reverse
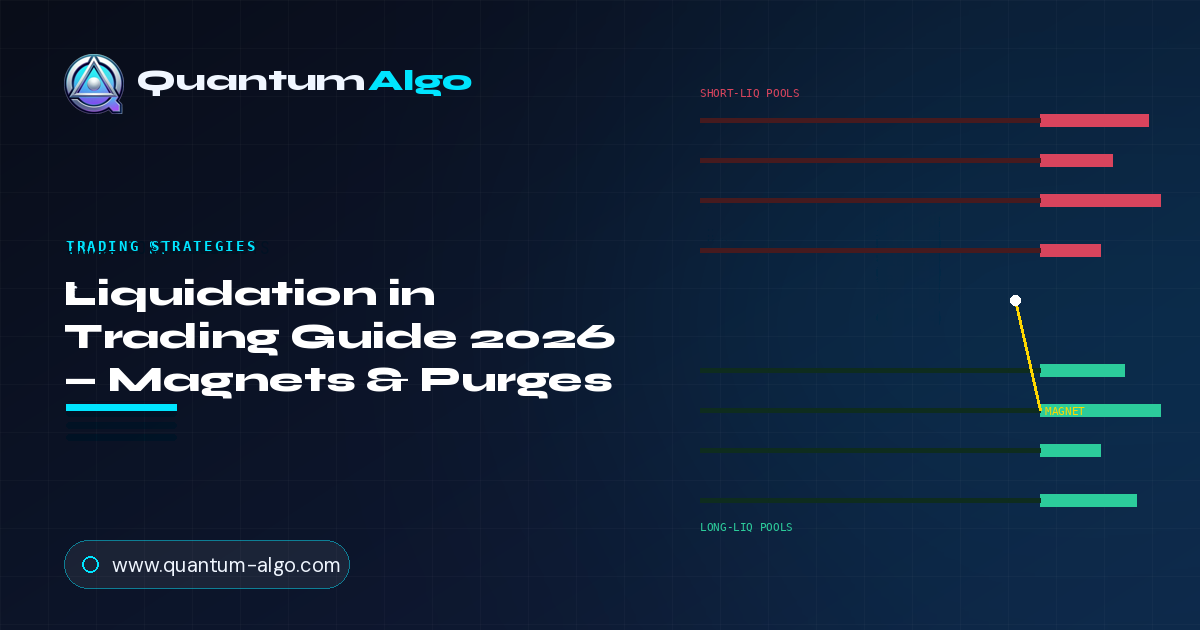
| What it is | Forced closure of a leveraged position |
| Trigger | Margin falls below the maintenance requirement |
| Why it matters | Forced orders are fuel — price is drawn to them |
| Leverage math | ~10% (10x), ~4% (25x), ~2% (50x), ~1% (100x) |
| Cascade | Liquidations trigger more liquidations |
| The trade | Sweep-and-reverse after a pool is purged |
1. What Is Liquidation in Trading?
Liquidation is the forced closure of a leveraged position by the exchange when the trader can no longer cover the position's losses. It is not a choice — it is automatic, mechanical, and, on crypto perpetual futures, one of the single most powerful forces shaping intraday price. Understand liquidation and a great deal of "random" volatility suddenly has a reason.
Here is the mechanism. When you open a leveraged position, you post a fraction of its value as margin. As price moves against you, your losses eat into that margin. Once your margin falls below the exchange's maintenance requirement, the exchange closes your position at market to protect itself — that is your liquidation. Crucially, that closing order is a market order in the direction that hurts you: longs get liquidated by forced selling, shorts by forced buying.
Now multiply that by a crowd. When many traders open similar leveraged positions near the same swing high or low, their liquidation prices cluster at the same levels — because the math is fixed. A crowd of 25x longs opened near a swing low will all be liquidated at roughly the same price, about four percent below it. That cluster of forced sell orders sits there like a pool of fuel, and price is drawn toward it. Sweep the pool, trigger the forced orders, and price very often reverses once the fuel is spent. That pull is what traders mean by a liquidation magnet.
Liquidation is the forced, automatic closure of a leveraged position. Because leverage math is fixed, crowded positions produce clustered forced orders — pools of fuel that pull price toward them, get swept, and frequently reverse.
2. The Leverage Math Behind Liquidation Levels
The reason liquidation levels are predictable — and therefore tradeable — is that the distance from entry to liquidation is set by leverage, not by opinion. Ignoring fees and funding, a position is liquidated when the price move against it roughly equals the inverse of the leverage. That gives a simple ladder every derivatives trader should have memorised:
| Leverage | Approx. distance to liquidation | What it implies |
|---|---|---|
| 10x | ~10% from entry | Conservative; pools sit far from price |
| 25x | ~4% from entry | Common retail leverage; meaningful clusters |
| 50x | ~2% from entry | Aggressive; pools sit close, swept often |
| 100x | ~1% from entry | Extreme; liquidated by ordinary noise |
Because these percentages are fixed and public, everyone's 50x liquidation sits about two percent from entry — no private data required to estimate where the crowd will be forced out. That is the honest foundation of every liquidation tool: it does not read secret exchange feeds (no chart indicator can), it applies the public leverage math to visible swing points and estimates where the pools must be.
Longs liquidate below
Long positions are forced out when price falls far enough below entry. Their forced selling sits below price — a pool that, when swept, adds selling pressure and often marks a local bottom once exhausted.
Shorts liquidate above
Short positions are forced out when price rises far enough above entry. Their forced buying sits above price — a pool that, when swept, adds buying pressure and often marks a local top once exhausted.
Higher leverage, closer pool
The more leverage the crowd uses, the closer its liquidation sits to price. In high-leverage crypto, the nearest pools are often just one to four percent away — which is why perps whip around so violently.
Volume weights the pool
A swing formed on climactic volume implies a larger crowd entered there — so its liquidation pool carries more fuel. Not all pools are equal; the heaviest ones exert the strongest pull.
3. Liquidation Cascades and Why Wicks Happen
The reason liquidations matter so much is that they feed on themselves. A single liquidation is a market order that pushes price a little further in the painful direction. That further move pushes the next cluster of positions into liquidation, which fires more forced orders, which pushes price further still. This chain reaction is a liquidation cascade, and it is why crypto prints those violent, near-vertical wicks that seem to come from nowhere.
A cascade is the market briefly running on nothing but forced orders. It is not new information, not a considered decision by anyone — it is a mechanical feedback loop consuming stacked pools of fuel in sequence. This is why the wicks are so sharp and why they so often reverse just as fast: once the last stacked pool is consumed, the forced selling (or buying) simply stops, and price snaps back to where willing participants actually want to trade.
A long wick into a liquidation zone is usually a cascade: stacked pools consumed in sequence, then a snap-back once the forced flow stops. The violence is mechanical, not informational — which is exactly why it reverses.
4. Net Pull: Which Way Is the Fuel?
If price is drawn toward liquidation pools, then the balance of pools around current price is a directional clue. When there is a heavy pool overhead and only light fuel below, the path of least resistance is up — toward the larger magnet. When the heavy pool sits below, the pull is down. This directional balance is what traders call Net Pull, and it turns a static map of pools into a live bias.
The intuition is simple: markets seek liquidity, and liquidity is densest where the most forced orders wait. A market maker or an aggressive trend follower has every incentive to push price toward the largest available pocket of fuel, because that is where the most orders can be filled. So a lopsided map — big pool one side, thin the other — is a hint about where price is likely to be dragged next, all else equal.
Heavy above, light below
The dominant fuel is overhead. Net Pull is upward — the path of least resistance tends toward the pool above, where the most short-liquidation orders wait to be triggered.
Heavy below, light above
The dominant fuel is beneath price. Net Pull is downward — price is more likely to be dragged into the long-liquidation pool below before any sustained move up.
Balanced pools
When fuel is roughly even on both sides, Net Pull is neutral — the map offers no directional edge, and you should lean on other tools for bias rather than forcing a read.
Pull is context, not a signal
Net Pull suggests where price may be drawn; it does not time the entry. Combine it with structure and a sweep confirmation — the pull tells you the destination, not the moment to act.

Automate your trades. Let Quantum Algo trade for you.
Every signal executed on your own account — 24/7, hands-off.
5. The Purge, and the Honest Way to Measure It
A purge is the moment price trades through a liquidation pool and consumes it — the sweep that triggers the forced orders. The classic trade is the sweep-and-reverse: wait for price to purge a strong pool, treat that purge as a candidate exhaustion point, and look for your entry in the opposite direction as the forced flow dies out. It works because once the fuel is spent, the mechanical pressure that drove the wick simply disappears.
But here honesty matters more than hype. A purge does not always reverse. Sometimes the sweep is the start of a genuine trend continuation, not an exhaustion point. This is where most liquidation tools fail traders: they imply that every sweep is a reversal and never show you how often that is actually true. The right approach is to measure the tool against itself — after every purge, record what price did over the next several bars, and report the real reversal rate for that symbol and timeframe.
That self-auditing is the difference between a tool that markets a thesis and one that tests it in public. A reversal statistic computed on your chart — shrunk toward neutral when the sample is small, so early numbers cannot overstate the edge — tells you whether the sweep-and-reverse actually holds on the instrument you trade, or whether purges there tend to continue. It describes history, never guarantees the future, but it keeps you honest.
Read the liquidation map
Four snapshots of pools around current price. You want the setup with the clearest upward Net Pull — a heavy pool overhead and light fuel below. Click it.
The discipline the game teaches: read the balance, not any single pool. A big pool overhead only implies upward pull if the downside is genuinely light. Two heavy pools on both sides is not an upward magnet — it is a coin toss, and forcing a direction there is how the map gets misused.
6. Mapping Liquidation Automatically: The Liquidation Magnet
Estimating where crowds entered, applying the leverage math to every swing, weighting each pool by volume, decaying them as positions rotate, and honestly tracking how often purges reverse — that is a lot of mechanical bookkeeping to do by eye. Our free, open-source Liquidation Magnet indicator on TradingView does all of it, and — importantly — is radically honest about what it is.
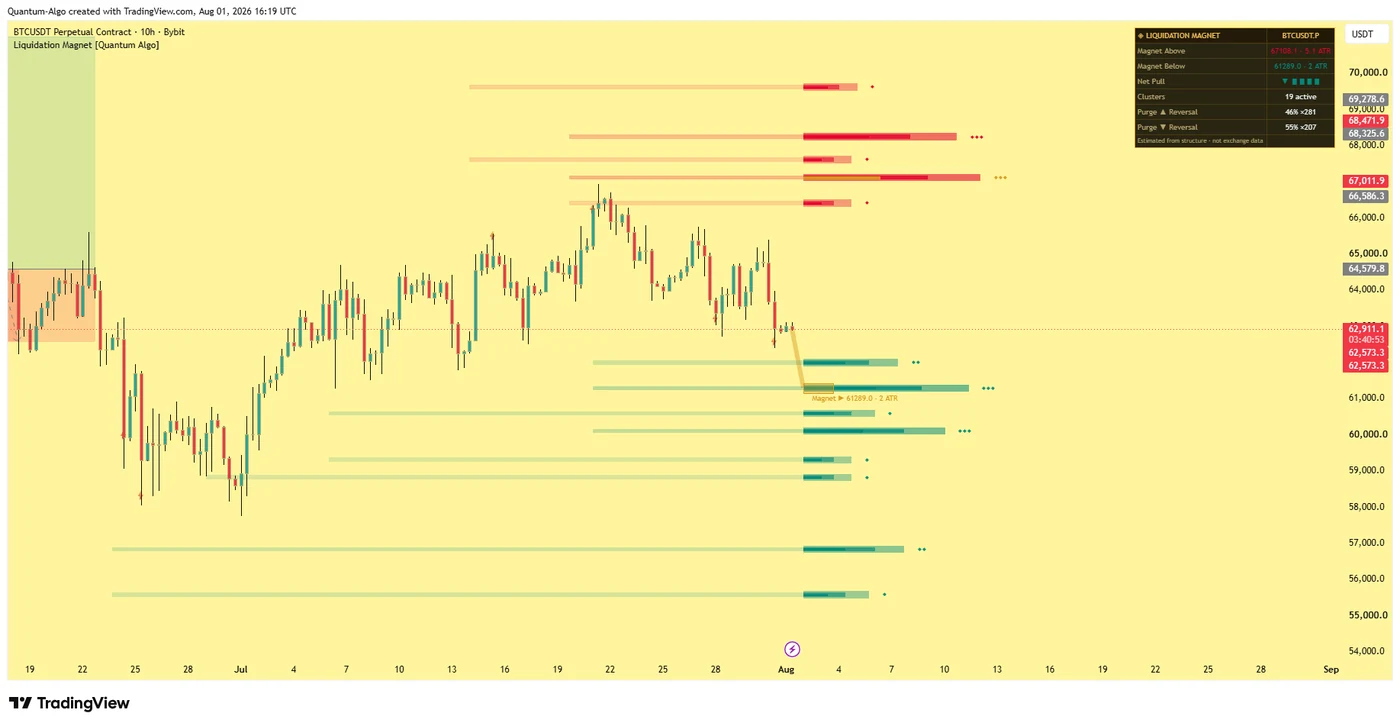
The honesty note comes first, because it is the whole point: every level in this tool is an estimate derived from price structure and the fixed mathematics of leverage. It does not read exchange liquidation feeds or order-book data — no TradingView indicator can — and it says so everywhere. What it does instead is guess transparently, and then measure its own hit rate on your chart.
Cluster model, not static lines
Swing anchors project liquidation estimates through four leverage tiers (10x, 25x, 50x, 100x). Nearby estimates merge into clusters whose mass grows with the volume behind the swing — scattered guesses become weighted zones.
Living decay engine
Positions close and the crowd rotates, so every cluster loses mass each bar and dies when it fades — or the instant price sweeps through and consumes it. The map is always current, never a museum of stale lines.
The magnet beam
Among all pools within reach, the strongest — mass discounted by distance — is highlighted with a gold beam from live price. One glance answers "where is the nearest large pocket of fuel?"
Purge stats that self-audit
After each sweep, the tool records the ten-bar outcome and reports the reversal rate — shrunk toward neutral at small samples, with a Wilson lower bound in tooltips. The indicator grades its own thesis in public.
Everything is computed on confirmed bars, so clusters and purges do not repaint. The tool is designed for crypto perpetual futures on 15-minute to 4-hour charts, where liquidation mechanics dominate intraday movement. Use the pools as targets (price is drawn to fuel), the purge as a candidate exhaustion point (checked against the historical reversal rate), and the hot ladders as places not to rest a stop — because that is exactly where the market has an incentive to reach. In keeping with our approach — don't trust us, verify us — the script is open-source, and its estimates are labelled as estimates everywhere.
Liquidation Magnet [Quantum Algo] on TradingView — volume-weighted liquidation clusters across four leverage tiers, a decay engine that keeps the map current, a gold magnet beam onto the strongest pool, Net Pull bias, and purge-reversal statistics computed on your own chart. Honest by design: estimates labelled as estimates. Free to use, open-source to verify.
7. Test Your Knowledge
Seven questions on liquidation, leverage math, cascades and magnets.
8. Liquidation Within a Full Trading Framework
Liquidation is a liquidity concept, and it interlocks tightly with the rest of Smart Money analysis. Forced orders are simply the most mechanical, most predictable form of resting liquidity — which is why liquidation pools so often coincide with the levels other tools already flag.
The connections are direct. A liquidation pool below price is a specific, math-derived version of a liquidity sweep target. A purge that reverses often prints a break of structure or change of character as it turns. Liquidation clusters pair naturally with the funding rate (crowded, over-leveraged positioning shows up in both) and with open interest (a spike in OI is fresh leverage that becomes tomorrow's fuel). And the reversal after a purge is frequently the best moment to look for an Optimal Trade Entry in the new direction.
• Buy/sell signals with built-in SL and TP — entries that respect where the fuel sits
• Liquidity sweep detection — the purge of a pool, flagged as it happens
• Break of structure mapping — the confirmation that a purge has turned into a real reversal
• Multi-timeframe confluence scoring — so a purge that aligns with structure scores higher
• ATR-based risk management — stops placed away from hot pools, sized to volatility
The habit to build: use the liquidation map to see where the fuel is and which way it pulls, wait for a purge, confirm the turn with structure, and only then act. The pools tell you where the market wants to go — they do not, on their own, tell you when.
Frequently Asked Questions
Liquidation is the forced closure of a leveraged position by the exchange when the trader's margin falls below the maintenance requirement. It is automatic and executed as a market order in the losing direction - forced selling for longs, forced buying for shorts. On crypto perpetual futures, where leverage is high, liquidations are one of the most powerful forces driving short-term price, because crowds of similar positions get liquidated at clustered price levels.
Ignoring fees and funding, a leveraged position is liquidated when the price move against it roughly equals the inverse of the leverage. So a 10x position is liquidated on about a 10% adverse move, 25x on about 4%, 50x on about 2%, and 100x on about 1%. Longs are liquidated by price falling below entry by that distance; shorts by price rising above entry. Because this math is fixed and public, liquidation levels can be estimated without any private exchange data.
A liquidation cascade is a chain reaction where one liquidation's forced order pushes price into the next cluster of positions, triggering more liquidations, which push price further still. It is a mechanical feedback loop running on forced orders rather than new information, and it produces the violent, near-vertical wicks common in crypto. Cascades often reverse sharply because once the last stacked pool of forced orders is consumed, the mechanical pressure simply stops and price snaps back.
A liquidation magnet is a cluster of forced orders that price is drawn toward. Because crowded leveraged positions produce clustered liquidation levels, those levels hold a pool of forced buy or sell orders - fuel. Markets seek liquidity, so price tends to be pulled toward the largest nearby pool, sweep it, trigger the forced orders, and often reverse once the fuel is spent. The strength of the pull depends on the pool's size, which scales with how much volume and leverage the anchoring crowd used.
No. TradingView indicators cannot access exchange liquidation feeds or order-book data - any tool claiming to show "real" liquidations is estimating with extra steps. Honest liquidation tools, including the Quantum Algo Liquidation Magnet, compute estimates from visible price structure and the fixed mathematics of leverage tiers, label those levels as estimates everywhere, and compensate by measuring their own historical hit rate on your chart. The estimates line up with reversals often because leverage math is public and mechanical, not because of private data.
The classic method is the sweep-and-reverse: wait for price to purge a strong liquidation pool, treat that purge as a candidate exhaustion point, check the historical reversal rate for that direction on your symbol, and look for an entry in the opposite direction as the forced flow dies. Liquidation pools also serve as profit targets, since price is drawn toward them, and as places to avoid resting stops - a stop just beyond a hot pool is exactly where the market has an incentive to reach.
No, and assuming they do is a common mistake. Sometimes a purge is the start of a genuine trend continuation rather than an exhaustion point. That is why an honest approach measures the actual reversal rate after purges on your specific symbol and timeframe, shrinking the statistic toward neutral at small sample sizes so early numbers cannot overstate the edge. The rate describes that chart's history only; it is never a guarantee. Always confirm a suspected reversal with structure before acting.
More guides
References & Related Guides
More in this topic
- Day Trading Crypto: A Market With No Sessions, a Clock That Still Matters, and the Trades That Fit It
- What Is Margin Trading? Initial vs Maintenance Margin, Margin Calls and a Calculator
- What Is Notional Value in Trading? (Notional vs Margin vs Risk + Calculator)
- Liquidity Sweep Trading: Stop Hunts Explained (2026)
- Funding Rate Trading: Complete Guide 2026
- Open Interest Explained 2026 - Complete Guide
- Liquidity Trading Guide 2026 - Raids & Kill Zones
- Smart Money Concepts (SMC): Ultimate Trading Guide 2026
- Optimal Trade Entry (OTE): Complete Guide 2026
- Order Flow Trading 2026 - Read the Footprint of Institutions
- Delta Divergence: Complete Guide 2026
- Risk Management in Trading 2026 - Complete Guide
- Cumulative Volume Delta (CVD): Complete Guide 2026
- BOS & CHoCH: Complete Market Structure Guide 2026
- Wyckoff Method 2026 - Complete Institutional Trading Guide
Core reading
- Liquidity Sweep Trading: Stop Hunts Explained (2026)
- Funding Rate Trading: Complete Guide 2026
- Open Interest Explained 2026 - Complete Guide
- Risk Management in Trading 2026 - Complete Guide
- Smart Money Concepts (SMC): Ultimate Trading Guide 2026
- All Premium Guides
- Quantum Algo on TradingView
- Public Verified Track Record