Adaptive Lorentzian Classification [Quantum Algo]
A machine-learning classifier that compares this bar's six-feature fingerprint against thousands of past bars, lets the most similar ones vote with a confidence score, and measures similarity with Lorentzian distance so news-driven outliers cannot hijack the neighbourhood — independently re-derived, time-aligned, with no library imports.
The short answer
The Adaptive Lorentzian Classification — the Quantum ML Engine on the chart — is a free, open-source TradingView machine-learning classifier that predicts price direction over a configurable horizon using an Approximate Nearest Neighbours search across historical feature vectors. Instead of one oscillator, it compares the current bar's fingerprint — up to six normalised features — against thousands of past bars, finds the most similar market conditions and lets their outcomes vote on what is likely next. By default it measures similarity with Lorentzian distance, log(1 + |Δ|), which compresses the outliers around CPI prints, FOMC and black swans so a single extreme bar cannot dominate the neighbour selection. A fully self-contained implementation with zero library imports.
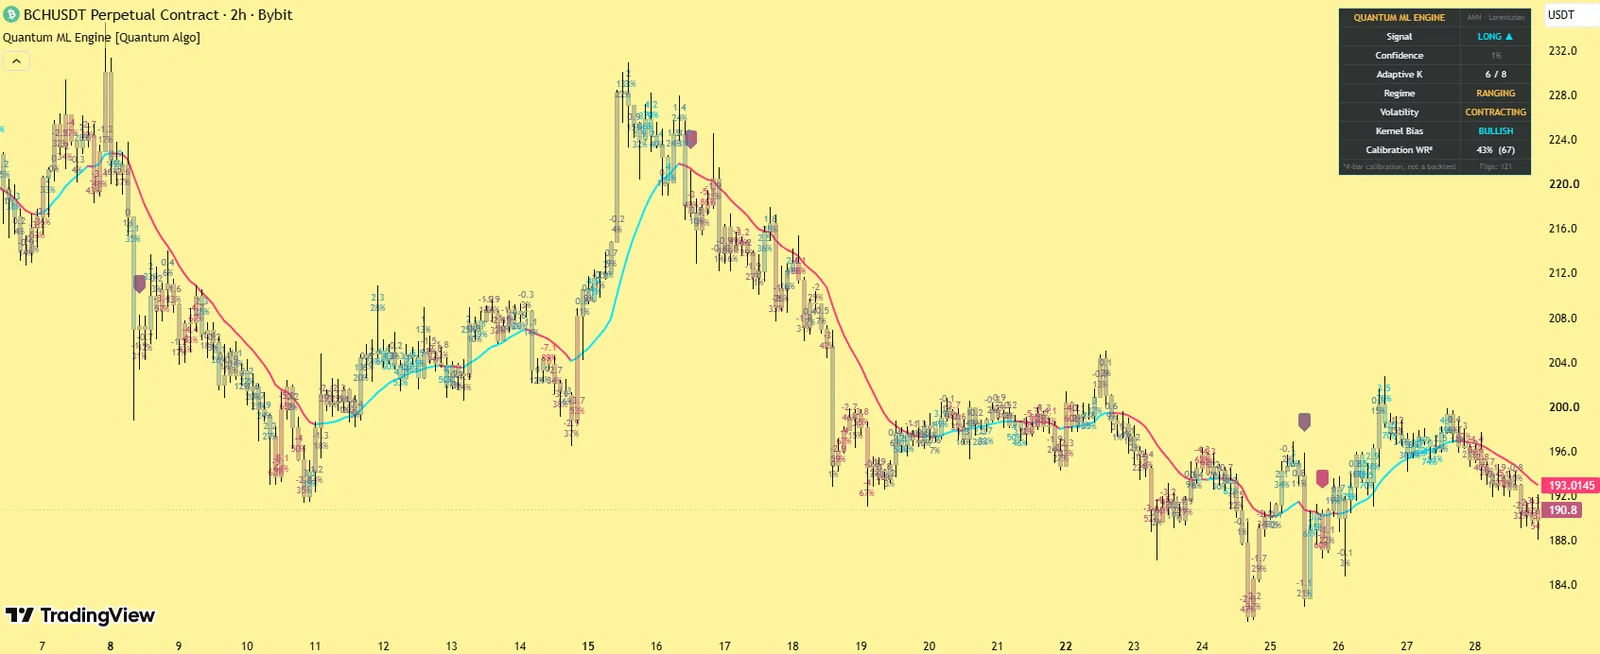
Classified bar colours, prediction labels with confidence, the kernel estimate, an optional ATR trail and a dashboard with adaptive K and regimes.
Time-aligned training with neutral-zone labels, weighted features, four metrics, confidence gating and adaptive K.
Bar-close evaluation; training samples enter only once realised — no lookahead.
Lorentzian distance, and why
Euclidean distance squares the differences between features, so one extreme reading dominates the neighbourhood. Lorentzian distance grows with the logarithm of the difference — large gaps are compressed, analogous to how mass warps space-time — so the neighbours chosen reflect the whole fingerprint rather than the wildest component. The concept of applying it to kNN classification on charts was pioneered by jdehorty, building on capissimo's kNN studies; this script re-derives the approach independently and extends it.
What it draws
Bar colours
By the live classification.
Prediction labels
With the vote value and the 0–100% confidence.
The optional ATR trailing stop
Level when that exit mode is on.
The kernel regression estimate
When the Nadaraya-Watson filter is enabled.
The dashboard
Live signal, confidence, current adaptive K, volatility and trend regime, kernel bias, and a calibration win rate that exists only for tuning feedback.
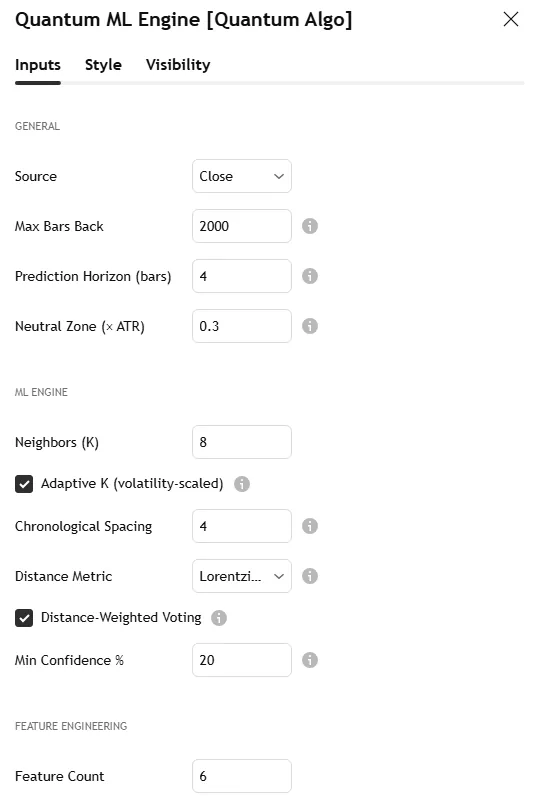
The BCH/USDT 2-hour screenshot on this page shows the classification with confidence labels and the dashboard; the settings screenshot shows the Inputs tab.
What is different in this implementation
Time-aligned training set.
Each sample pairs the feature vector at a bar with the realised outcome over the following H bars; a sample enters only once its outcome is realised — no lookahead.
ATR neutral-zone labelling.
Moves smaller than a multiple of ATR are labelled NEUTRAL, so sideways noise never teaches a false directional lesson.
Six engineered features with importance weights
RSI, WaveTrend, CCI, ADX, MFI and Fisher Transform, each normalised to 0–1, each with its own weight.
Four distance metrics
Lorentzian, Manhattan, Euclidean and a 50/50 hybrid.
Distance-weighted voting with a confidence score
Closer neighbours vote louder (1 / (1 + distance)); a minimum-confidence gate suppresses low-conviction signals.
Adaptive K
The neighbour count shrinks up to 40% when volatility ranks high, expands in quiet regimes.
Sliding training window
Always the most recent N bars.
Configurable horizon
(1–20 bars), three exit modes (fixed horizon, kernel-slope, ATR trailing) and a higher-timeframe EMA confluence filter.
How it works
On every bar, six features are computed and normalised.
The vector is compared against samples in the sliding window, with a minimum chronological spacing (default 4 bars) so neighbours come from distinct episodes.
A monotonic distance threshold maintains a stable pool of approximate nearest neighbours; when the pool exceeds K, the threshold resets to the 75th-percentile distance so closer samples rotate in.
Neighbours vote long / short / neutral, weighted by proximity; the weighted sum is the prediction, the agreement the confidence.
The raw signal passes optional filters — volatility regime, trend regime, ADX, EMA/SMA, higher-timeframe trend, and a Nadaraya-Watson rational-quadratic kernel with a Gaussian crossover mode.
Entries print only when the ML signal, the confidence gate and every enabled filter agree — on bar close.
Settings
| Group | Input | What it does | Where to start |
|---|---|---|---|
| General | Source, training window, prediction horizon, neutral-zone width | The problem definition | close; 2000; 4 bars; 0.5 ATR |
| ML Engine | K, adaptive K, chronological spacing, distance metric, distance weighting, minimum confidence | The classifier | 8; on; 4; Lorentzian; on; 60% |
| Feature Engineering | Type, parameters and weight for six slots | The fingerprint | RSI 14, WT 10/11, CCI 20, ADX 20, MFI 14, Fisher 9; weights 1.0 |
| Filters | Volatility, regime, ADX, EMA/SMA, higher-timeframe | Gates | volatility on; HTF on for swing |
| Kernel | Lookback, relative weighting, regression level, lag, smoothing | Nadaraya-Watson | 8 / 8 / 25 / 2 |
| Exits | Fixed vs dynamic, ATR trailing stop and multiplier | How positions close | fixed horizon; trail off |
| Display | Bar colours, prediction labels, dashboard, colour compression | Appearance | — |
Alerts
Long and short entry conditions, evaluated on bar close, gated by confidence and every enabled filter; create them from the indicator's alert list.
How to use it
Start with the defaults on a 1H–4H chart and let the training window fill.
Raise minimum confidence for fewer, more selective signals; raise chronological spacing on lower timeframes to diversify neighbours.
Retune the features and metric per market — crypto, FX, indices and equities behave differently.
Read the calibration win rate as tuning feedback only. It is not a backtest, includes no costs, and is not a performance claim.
Use it as a confluence layer inside a complete plan with your own risk management, never as a standalone system.
Three ways to trade it
The high-confidence agreement.
A long classification at 75%+ confidence with the HTF filter passing, on a return to a demand block — the ML vote confirms the structure entry; stop below the block.
The disagreement stand-down.
Structure says long, the classifier says short with high confidence — reduce size or wait; the two rarely disagree for long.
The kernel-slope exit.
In a trend trade, the dynamic kernel-slope exit turns the classifier into a trailing decision rather than a fixed horizon.
Recommended settings by market
Crypto, 1H–4H:
Lorentzian, K 8, confidence 60%, spacing 4, volatility filter on.
Forex, 15m–1H:
Manhattan or hybrid metric often neighbours better on smoother data; spacing 6; MFI weight 0.5 (tick volume).
Indices and stocks, 1H–daily:
Lorentzian, K 10, HTF filter on, horizon 5.
How it compares
Against the original Lorentzian Classification: same concept, independently re-derived, with time-aligned training, neutral-zone labels, weighted features, four metrics, confidence gating, adaptive K, a sliding window, three exit modes and an HTF filter. Against the Neural Confluence Engine: that is a fixed-weight composite of eight factors; this learns from the chart's own history by similarity. Against Zeno: Zeno's signals come from institutional structure; the classifier is a free confluence vote on the same bar.
Limitations
The classifier learns from the recent window only; regime changes reduce neighbour quality until the window refills. Like any bar-close logic, the in-progress bar can change until it closes. The calibration statistic is feedback, not performance. Six features normalised to 0–1 cannot see news.
Credits
Concept inspiration: jdehorty (Machine Learning: Lorentzian Classification) and capissimo (kNN implementations) — full credit to both for the foundational research. This script is an independent, original implementation by Quantum Algo with the extensions above, published open source; no code was reused.
Step-by-step: adding it to your TradingView chart
Open the script page on TradingView (link above) and click Add to favorites, then Use on chart — or on any chart open Indicators, search "Adaptive Lorentzian Classification Quantum Algo" and add it. Free on every TradingView plan.
Open the indicator's settings and set the inputs for your market and timeframe from the table above; the defaults are tuned for crypto on 1-hour to 4-hour charts.
In the Style tab, match the colours to your chart theme; the dashboard position and text size are in Inputs.
To set alerts, right-click the chart → Add alert, choose the indicator as the condition and pick the event; set "Once per bar close" so alerts match the closed-bar logic.
Save the layout, and add the other free Quantum Algo tools to it — they are designed to sit together.
To read or reuse the code, click Source code on the script page; republishing is subject to TradingView's house rules.
Inside the code, for developers
Pine Script, open source. Worth reading if you want to modify it: every detection and signal gated on barstate.isconfirmed; state held in capped arrays of drawing objects with explicit create, update and retire functions; where statistics are kept, first-in-first-out arrays with shrinkage and a Wilson bound computed inline; named alertcondition calls so webhooks receive a consistent payload. The Academy's Pine Script tutorials and the TradingView backtesting guide cover strategy conversion.
Using it with the other free indicators
The free tools layer on one chart: the Smart Money Concepts Engine for bias and the Confluence Score; Order Blocks with Volume, Fair Value Gaps + Inversion and Institutional Key Levels for the zone; Liquidity Sweeps, Sessionscope and Liquidation Magnet for the liquidity and the trigger; OTE + Silver Bullet for the time-qualified entry; the Institutional Volume Profile and Pressure Oscillator for whether volume agrees; the trend and volatility family — the Adaptive Trend Sentinel, SuperTrend Engine, Golden Cross Engine, Anchored VWAP Engine, Trendline Architect, Keltner Rings and Volatility Storm Tracker — for regime, direction and room; and the momentum and statistics family — MACD Matrix, the Multi-Oscillator Divergence Scanner, the Event Probability Engine, the Market Bottom Finder, the Neural Confluence Engine, the Adaptive Lorentzian Classification and the Directional Strength Index — for momentum, probability and strength. The free-indicators hub lists every tool; the SMC guide is the method behind the layering.
Common mistakes with this indicator
- Trusting the developing bar — every event waits for the close.
- Trading every marker — the tool gives momentum and context; the entry needs a structure level and a stop beyond it.
- Default lengths on the wrong timeframe — adjust the inputs, as the settings table shows.
- Reading the statistics as promises — they describe this chart's history, shrunk toward neutral on purpose.
- Stacking ten random scripts — the free tools layer because they were built to.
Want the signal, not just the structure?
Zeno reads Smart Money structure across timeframes and prints the entry, stop, TP1 and TP2 on your chart — with a public record of 160 posted trades, 120 wins and 40 losses at the stated levels. QuantumBot executes it on Bybit, Binance, OKX, Bitget and Kraken.

Glossary for this indicator
Frequently asked questions
Does the Adaptive Lorentzian Classification repaint?
Signals are evaluated on bar close; the in-progress bar can change until it closes, as with any bar-close logic. Training samples enter only once their outcome is realised, so there is no lookahead.
What is Lorentzian distance?
log(1 + |Δ|) per feature — a distance that compresses large differences so outlier bars around news events cannot dominate neighbour selection.
What does the confidence percentage mean?
The agreement between the weighted votes of the nearest neighbours; the minimum-confidence gate suppresses signals below your threshold.
Is the calibration win rate a backtest?
No. It checks whether price moved in the predicted direction over the horizon after each signal, with no costs or risk management — feedback for tuning features, never a performance claim.
Which distance metric should I use?
Lorentzian by default; Manhattan or the hybrid on smoother series; Euclidean when you want outliers to matter. Switching metrics is the strongest tuning lever per asset class.
How does it relate to Zeno?
Zeno prints structure signals with stop and targets; the classifier is a free confluence vote on the same bar — agreement adds conviction, disagreement is a reason to wait.
What is the Lorentzian Classification indicator?
A nearest-neighbour classifier that measures similarity between bars with Lorentzian distance; this is Quantum Algo's independent implementation with time-aligned training, neutral labels, weighted features and a confidence gate.
Does it use lookahead?
No. A training sample enters only once its outcome over the horizon is realised, and higher-timeframe values are requested without lookahead.
Which features should I weight?
Start at 1.0 across the six; lower MFI on tick-volume symbols; raise ADX for trend-following markets. The weights are the tuning levers, not a black box.
How many bars does it need?
The training window (2000 by default) should be filled; on a new chart, wait for it to load before reading confidence.
Is it an AI buy/sell indicator?
It is a transparent kNN classifier with every input visible — no hidden model — and it is designed as a confluence layer, not a standalone system.
Why does the dashboard show a win rate?
A calibration statistic for tuning: did price move in the predicted direction over the horizon? No costs, no risk management — never a performance claim.
The momentum and statistics family
Momentum, probability and strength — the reads that sit under the Smart Money layer and beside the trend tools.
Add Adaptive Lorentzian Classification to your chart
One click on TradingView, free on every plan, code you can read. Nothing repaints.