Engineered Liquidity
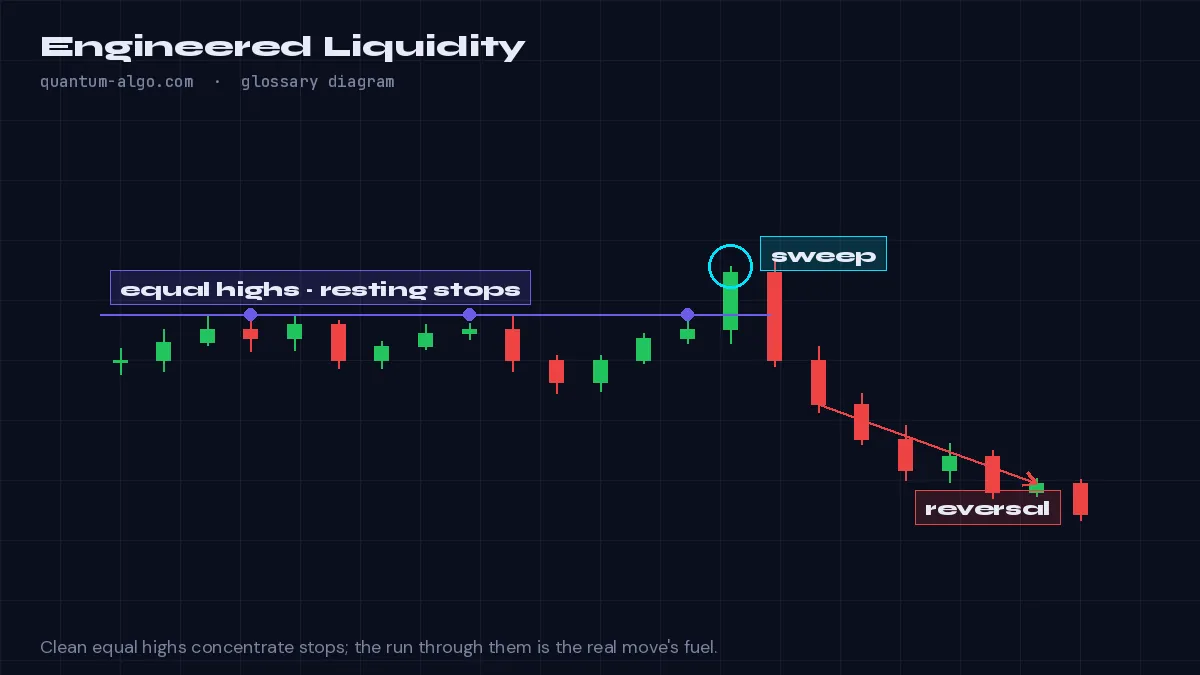
Engineered liquidity is a cluster of stop orders deliberately built by price action that looks tradeable — equal highs, a clean trendline, a textbook pattern — so that the obvious entries and stops become the fuel for the real move.
What it means
Markets need counterparties to fill large orders. Engineered liquidity is the idea that price is guided to create obvious technical formations — equal highs and lows, a rising trendline touched three times, a head-and-shoulders neckline — because those formations concentrate retail stops and breakout orders at predictable prices. When enough orders have accumulated, the level is run.
The tell is cleanliness. A perfectly respected trendline or a triple bottom with identical lows is suspicious precisely because it is perfect; organic price rarely lines up so neatly. Smart Money traders map these formations not to trade the pattern but to anticipate the sweep of the stops behind it.
The trade is on the far side of the run: wait for the engineered level to be taken, then for the displacement that follows, and enter with the displacement. Trendline Architect and Liquidity Sweeps draw the formations and mark the runs.
How to identify it on a chart
- Look for very clean, repeatedly respected levels: equal highs/lows, textbook trendlines, pattern necklines.
- Assume stops and pending orders sit just beyond them.
- Trade the sweep and the displacement after it, not the pattern itself.
Worked example
A rising trendline on BTC 1-hour has four perfect touches. The fifth touch breaks the line, stops out the longs, then price reverses with a bullish displacement candle — the trendline was the engineered liquidity and the break was the entry, not the exit.
See it on the chart, read it in depth
Frequently asked questions
Who engineers the liquidity?
Nobody in the conspiracy sense; large participants' algorithms are drawn to where orders concentrate, and the resulting price behaviour builds the formations. The effect is the same as if it were planned.
Are trendlines useless then?
No — they are useful as maps of where stops rest. Trade the reaction to the break rather than the break.
How is this different from inducement?
Inducement is a specific minor level placed before a point of interest; engineered liquidity is the broader idea that clean formations attract stops.
Which indicator helps?
Trendline Architect for the lines and their breaks, Liquidity Sweeps for the equal highs and lows.
Related terms
See Engineered Liquidity on your TradingView chart
Zeno reads Smart Money structure across timeframes and prints the entry, stop and targets — with a public record of every posted trade. The free indicators draw the concepts this page defines.