Power of Three (AMD)
Power of Three is the ICT model of a session or candle in three acts: accumulation (a tight range), manipulation (a false move against the true direction that takes liquidity) and distribution (the real move), so the open is rarely where the real move starts.
What it means
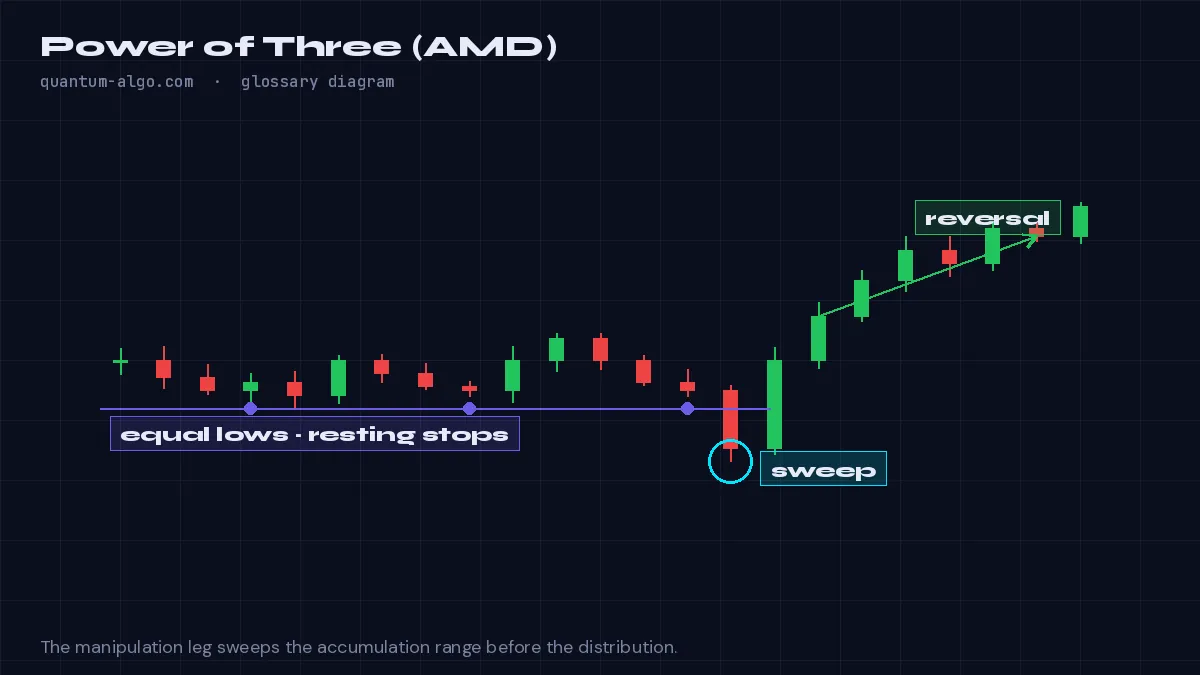
Power of Three — accumulation, manipulation, distribution — describes how a daily, weekly or session candle is built. Accumulation is the quiet range near the open where positions are built. Manipulation is the move against the eventual direction, usually a liquidity sweep of the accumulation range, that shakes out early participants. Distribution is the expansion in the true direction that forms the candle's body.
The model gives a trader a script for the day: expect the open to be near one extreme of the candle, expect a fake move first, and expect the real move after the fake. For a bullish day the manipulation is a sweep below the opening range; the low of the day often prints in the London killzone before the distribution into New York.
The Judas swing is the manipulation leg named; the killzones are when the manipulation and the distribution tend to occur. Power of Three is fractal — it applies to a weekly candle built from daily sessions as well as to a one-hour candle built from minutes.
How to identify it on a chart
- Mark the open of the period (daily open, session open).
- Watch for a range, then a run beyond it that sweeps liquidity — the manipulation.
- A displacement back through the open in the opposite direction starts the distribution; trade with it.
Worked example
BTC opens the daily at 64,000, ranges 63,800–64,200 through Asia, drops to 63,550 in London taking the range low, then displaces to 65,300 by the New York close. Accumulation, manipulation, distribution — a bullish PO3 day.
See it on the chart, read it in depth
Frequently asked questions
How do I know which direction the distribution will go?
From the higher-timeframe bias. If the daily is bullish, expect the manipulation to be a sweep of the lows and the distribution to be up.
Does Power of Three work on crypto?
Yes, with the daily open at 00:00 UTC and the manipulation typically around the London or New York opens.
Is Power of Three the same as the Judas swing?
The Judas swing is the manipulation leg of PO3; Power of Three is the whole three-part model.
What timeframe should I read PO3 on?
Read the model on the daily candle and trade its legs on the 5–15 minute chart.
Related terms
See Power of Three (AMD) on your TradingView chart
Zeno reads Smart Money structure across timeframes and prints the entry, stop and targets — with a public record of every posted trade. The free indicators draw the concepts this page defines.