Keltner Rings [Quantum Algo]
Keltner Channels that tell you how to read them: three rings as a volatility field, a regime classifier that says whether an upper-band touch is strength or fade material, band walks painted as the continuation they are, and three signal families — W, R, S — each scored on your symbol.
The short answer
Keltner Rings is a free, open-source TradingView indicator that turns Keltner Channels into a complete reading system: three nested rings form a gradient volatility field around an exponential moving average, a regime classifier decides whether you are in Trend Up, Trend Down, Range or Squeeze, and the dashboard translates it into plain instructions — when riding the upper band is strength, and when the very same touch is fade material. Three separate signal families never get confused with each other: W for the start of a band walk (continuation), R for a middle-ring rejection in a range regime (reversion), S for a squeeze release through the inner ring (expansion) — and each family's historical performance is scored on your exact symbol and timeframe.
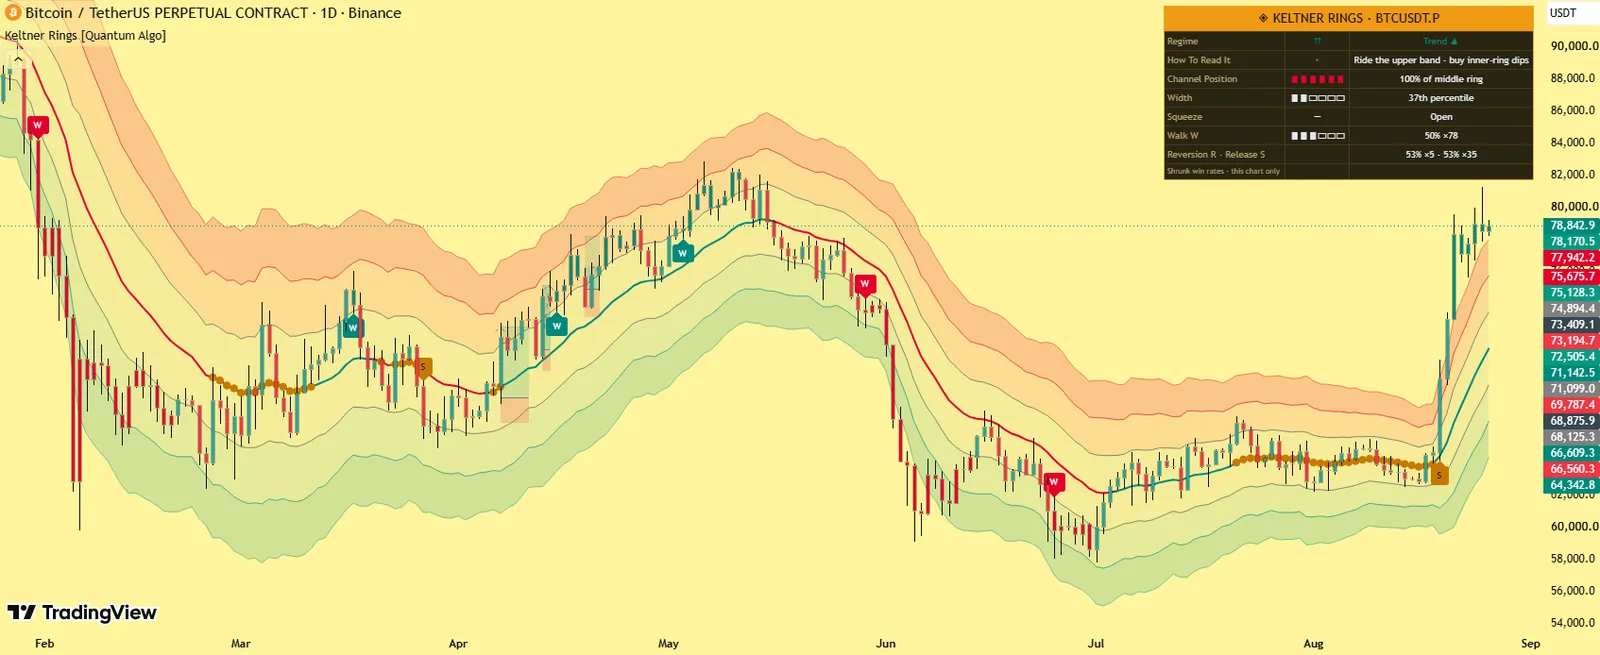
Three ATR rings with gradient fills, painted band walks, W/R/S signals, squeeze coils and a dashboard with the regime and a guidance row.
Regime-aware interpretation — reversion signals only in ranges, walks read as strength.
No — all signals on confirmed closes.
What Keltner Channels are
Keltner Channels are volatility bands around a moving average. The concept originates with Chester W. Keltner (1960); the modern formulation — an EMA with bands offset by multiples of the Average True Range — was popularised by Linda Bradford Raschke. Because ATR expands and contracts with real movement, the channel breathes with the market: wide in storms, tight in calm. This tool extends the single channel into three rings — inner, middle and outer — a graded map of how far price has travelled from its average in volatility-adjusted terms. Our Keltner Channels guide covers the classic version; this page is the rings.
What a band walk is
In a genuine trend, price does not oscillate politely around its average — it presses against the channel and rides it, closing beyond the inner ring bar after bar. This is the band walk, and it is the single most misread behaviour in channel trading: it looks overbought, and it is actually strength. Keltner Rings detects the walk explicitly (a configurable count of consecutive closes beyond the inner ring), paints the walking bars in full trend colour, and marks the walk's beginning as a continuation signal rather than a fade.
What it draws
Three rings
Inner, middle, outer at configurable ATR widths — with five gradient fills rendering the volatility field between them.
Band-walk painting
Bars locked beyond the inner ring in full trend colour.
W, R and S signals
Continuation, reversion and expansion, each in its natural regime only.
Squeeze coil markers
On the average while Bollinger Bands sit inside the Keltner ring, with duration tracking.
The dashboard
The regime, the "How To Read It" guidance row, the width percentile, the squeeze state, and the three family records side by side.
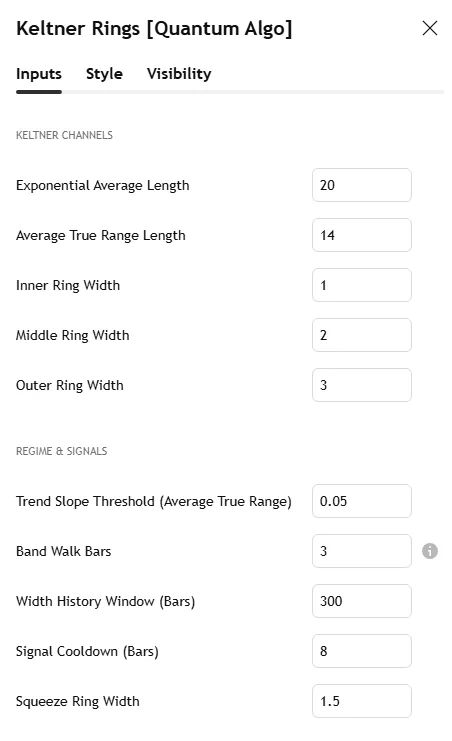
The Bitcoin daily screenshot on this page shows the three-ring field, a painted band walk and the dashboard; the settings screenshot shows the Inputs tab.
Why it is different
Regime-aware interpretation.
Average slope, band-walk state, squeeze condition and the channel's own width percentile combine into four regimes, and the guidance row states, live, how touches should be read right now. The tool teaches its own correct usage.
Three signal families, separated on purpose.
Continuation, reversion and expansion never get confused; reversion is disabled outside ranges by design.
Per-family statistics.
Each family's ten-bar outcomes are tracked, shrunk toward neutral at small samples, with Wilson bounds; every signal's tooltip quotes its family record on this symbol.
The width cone.
Width is ranked as a percentile inside its own recent history — "tight" and "wide" are defined by this symbol, never by fixed numbers.
The squeeze, integrated.
Bollinger Bands closing inside the Keltner ring — John Carter's compression concept — with duration, coil markers and directional release signals.
How it works
The EMA and ATR build three rings at configurable widths; gradient fills render the field.
Average slope, walk counters, squeeze state and width percentile feed the regime classifier every bar.
W fires when the walk count is reached with the trend; R fires on middle-ring rejections in range regimes; S fires when a mature squeeze releases through the inner ring.
Each family's outcomes feed its own statistics; the dashboard and tooltips report them with sample counts.
All signals are evaluated on confirmed bars and do not repaint; drawings are capped.
Settings
| Group | Input | What it does | Where to start |
|---|---|---|---|
| Keltner Channels | EMA length | The centre | 20 |
| ATR length | Volatility basis | 10 | |
| Three ring widths | Inner, middle, outer in ATR multiples | 1 / 2 / 3 | |
| Regime & Signals | Trend slope threshold | When the average counts as trending | default |
| Band-walk bar count | Consecutive closes to lock a walk | 3 (higher = stricter) | |
| Width history window | For the percentile | 200 | |
| Cooldown | Bars between signals | 8 | |
| Squeeze ring width | Bollinger-inside-Keltner test | inner | |
| Statistics | Sample cap, minimum samples, shrinkage strength, Wilson z | The family records | 60 / 10 / default / 1.28 |
| Visuals & dashboard | Colours, band-walk painting toggle, position, text size | Appearance | — |
Alerts
Five named conditions: Squeeze Started, Squeeze Release Up, Squeeze Release Down, Band Walk Started, and Reversion Signal.
How to use it
Read the regime row first, then the guidance row — they tell you which family is in its natural habitat.
In trends: inner-ring pullbacks are entries with the trend; let the painted walk carry the position; the walk ending is the first warning.
In ranges: middle-ring touches with rejection candles target the average — the R family's record shows how this symbol respects that logic.
In squeezes: coil duration and width percentile say how compressed the spring is; the S release gives direction; the family record says how trustworthy releases have been here.
Nothing needs retuning per symbol — every threshold is volatility-adjusted or percentile-based.
Three ways to trade it
The walk continuation.
W prints, the bars paint; enter the next inner-ring pullback with the trend, stop below the middle ring, and hold until the walk ends — a trailing exit the Adaptive Trend Sentinel can also manage.
The range reversion.
R at the middle ring with a rejection candle while the regime reads Range; target the EMA, stop beyond the outer ring; check the Choppiness Index agrees.
The squeeze release.
A long coil, width percentile in single digits, then S through the inner ring — the expansion trade; the Volatility Storm Tracker's pressure gauge usually charged first.
Recommended settings by market
Crypto, 4H–daily:
Defaults; band walks are long and the W family's record is usually the strongest.
Forex and gold, 15m–1H:
EMA 20, ATR 10, rings 1/2/3; squeezes cluster into the London open.
Indices, 5m–15m:
Walk count 4 to avoid false walks at the open.
How it compares
Against standard Keltner Channels: one channel and no interpretation versus a three-ring field, a regime classifier, a band-walk engine, three signal families and per-family statistics. Against Bollinger Bands: different questions — Bollinger reacts to close-to-close variance, Keltner breathes with the full range; this tool uses both, the channel as structure and the Bollinger relationship as the squeeze detector. Against Zeno: Zeno's signals come from structure; the rings read whether the move has room.
Limitations
Regime classification is descriptive, not predictive: regimes are identified as they form, and transitions are visible only once under way. Reversion logic is disabled outside range regimes by design. Statistics describe the current chart's history only.
Credits
The original channel concept is by Chester W. Keltner (1960); the modern EMA-and-ATR formulation was popularised by Linda Bradford Raschke; ATR is by J. Welles Wilder Jr. (1978); Bollinger Bands by John Bollinger; the squeeze concept was popularised by John F. Carter; the Wilson score interval by Edwin B. Wilson (1927). The regime classifier, three-ring field, band-walk engine, signal families, per-symbol statistics and all code are original work by Quantum Algo, published open source.
Step-by-step: adding it to your TradingView chart
Open the script page on TradingView (link above) and click Add to favorites, then Use on chart — or on any chart open Indicators, search "Keltner Rings Quantum Algo" and add it. Free on every TradingView plan.
Open the indicator's settings and set the inputs for your market and timeframe from the table above; the defaults are tuned for crypto on intraday and 4-hour charts.
In the Style tab, match the colours to your chart theme; the dashboard position and text size are in Inputs.
To set alerts, right-click the chart → Add alert, choose the indicator as the condition and pick the event; set "Once per bar close" so alerts match the closed-bar logic.
Save the layout, and add the other free Quantum Algo tools to it — they are designed to sit together.
To read or reuse the code, click Source code on the script page; republishing is subject to TradingView's house rules.
Inside the code, for developers
Pine Script, open source. Worth reading if you want to modify it: every detection and signal gated on barstate.isconfirmed; state held in capped arrays of drawing objects with explicit create, update and retire functions; statistics kept in first-in-first-out arrays with shrinkage and a Wilson bound computed inline; named alertcondition calls so webhooks receive a consistent payload. The Academy's Pine Script tutorials and the TradingView backtesting guide cover strategy conversion.
Using it with the other free indicators
The free tools layer on one chart: the Smart Money Concepts Engine for bias and the Confluence Score; Order Blocks with Volume, Fair Value Gaps + Inversion and Institutional Key Levels for the zone; Liquidity Sweeps, Sessionscope and Liquidation Magnet for the liquidity and the trigger; OTE + Silver Bullet for the time-qualified entry; the Institutional Volume Profile and Pressure Oscillator for whether volume agrees; and the trend and volatility family — the Adaptive Trend Sentinel, SuperTrend Engine, Golden Cross Engine, Anchored VWAP Engine, Trendline Architect, Keltner Rings and Volatility Storm Tracker — for regime, direction and the room a move has. The free-indicators hub lists every tool; the SMC guide is the method behind the layering.
Common mistakes with this indicator
- Trusting the developing bar — every event waits for the close.
- Trading every marker — the tool gives regime and context; the entry needs a structure level and a stop beyond it.
- Default lengths on the wrong timeframe — adjust the inputs, as the settings table shows.
- Reading the statistics as promises — they describe this chart's history, shrunk toward neutral on purpose.
- Stacking ten random scripts — the free tools layer because they were built to.
Want the signal, not just the structure?
Zeno reads Smart Money structure across timeframes and prints the entry, stop, TP1 and TP2 on your chart — with a public record of 160 posted trades, 120 wins and 40 losses at the stated levels. QuantumBot executes it on Bybit, Binance, OKX, Bitget and Kraken.

Glossary for this indicator
Frequently asked questions
Does Keltner Rings repaint?
No. All signals are evaluated on confirmed closes; a printed signal never changes.
Keltner Channels or Bollinger Bands?
They answer different questions — Bollinger reacts sharply to close-to-close variance, Keltner breathes with the full bar range. Keltner Rings uses both: the channel as the structure and the Bollinger relationship as the squeeze detector.
What do the family percentages mean?
The share of past signals in that family after which price moved favourably ten bars later on this symbol and timeframe, shrunk toward 50% at small samples. They describe history, not predictions.
Which settings matter most?
Band Walk Bars (higher = stricter walks, fewer W signals) and the ring widths — the defaults of 1, 2 and 3 ATR follow common practice.
Why is there no R signal in a trend?
By design — reversion is disabled outside range regimes, because fading a band walk is how channel traders lose money.
How does it relate to Zeno?
Zeno prints structure signals; Keltner Rings tells you the regime those signals fire in and whether the move has room — walk, range or squeeze.
What are the best Keltner Channel settings?
EMA 20, ATR 10, rings at 1, 2 and 3 ATR — the defaults follow common practice; Band Walk Bars is the setting that changes behaviour most.
Keltner Channels vs Bollinger Bands — which is better?
Different questions: Bollinger reacts to close-to-close variance, Keltner breathes with the full range. Keltner Rings uses both, the channel as structure and the Bollinger relationship as the squeeze detector.
What is a Keltner squeeze?
Bollinger Bands closing inside the Keltner ring — compression; the coil markers count its duration and the S signal fires on the release.
Why no reversion signal when price is at the outer ring in a trend?
Because fading a band walk is how channel traders lose; reversion is disabled outside range regimes by design.
Does it work on stocks and forex?
Yes — every threshold is volatility-adjusted or percentile-based, so nothing needs retuning per symbol.
How does it relate to Zeno?
Zeno prints structure signals; the rings say which regime they fire in and whether the move has room — walk, range or squeeze.
The trend and volatility family
Regime, direction and room — the tools built to sit under the Smart Money layer.
Add Keltner Rings to your chart
One click on TradingView, free on every plan, code you can read. Nothing repaints.