High- and Low-Resistance Liquidity Runs
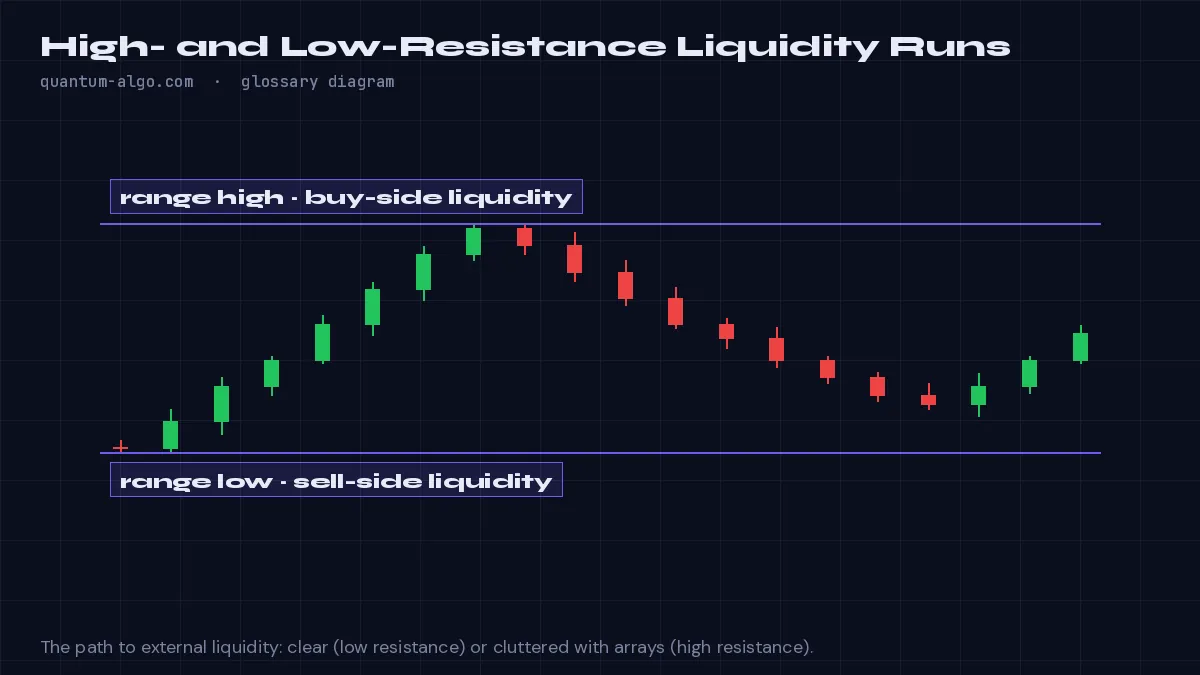
A low-resistance liquidity run is a move toward a liquidity pool with little structure in the way, so it travels fast and far; a high-resistance run faces many order blocks and gaps and grinds, stalls or fails — the distinction tells you which trades to size up.
What it means
ICT classifies the path to a target by how much price has to fight. A low-resistance liquidity run (LRLR) heads toward stops through a region with few unmitigated order blocks, few gaps and no strong swing points — the market has nothing to react to, so it moves cleanly. A high-resistance liquidity run (HRLR) must pass several PD arrays on the way, each a possible reversal point.
The classification sets expectations. In an LRLR, hold the position toward the target and trail loosely. In an HRLR, take partials at each array, or skip the trade if the reward to the first obstacle is too small. Trend continuations after a sweep are usually LRLRs in the direction of the trend; counter-trend moves are usually HRLRs.
The Smart Money Concepts Engine draws the unmitigated arrays between price and the next liquidity pool; counting them is the practical test.
How to identify it on a chart
- Identify the target liquidity pool.
- Count the unmitigated order blocks, gaps and swing points between price and the target.
- Few or none: low resistance, hold for the target. Several: high resistance, take partials or pass.
Worked example
After a sweep of the 4-hour low, the path up to the previous day's high has one small FVG and no order blocks — a low-resistance run; the long holds to the target. The reverse path down passes three unmitigated bullish blocks — a high-resistance run to be avoided.
See it on the chart, read it in depth
Frequently asked questions
How many arrays make a run high-resistance?
There is no fixed number; two or more unmitigated arrays inside the path is a reasonable threshold for taking partials.
Does a low-resistance run always reach its target?
No, but it fails less often and travels faster; the classification is about odds and management, not certainty.
Which direction is usually low resistance?
With the higher-timeframe trend, after a liquidity sweep against it.
Is this the same as a liquidity void?
A void is one kind of low-resistance region; the run classification looks at every obstacle on the path.
Related terms
See High- and Low-Resistance Liquidity Runs on your TradingView chart
Zeno reads Smart Money structure across timeframes and prints the entry, stop and targets — with a public record of every posted trade. The free indicators draw the concepts this page defines.