The Best Indicator for Stocks: Reading Institutional Accumulation
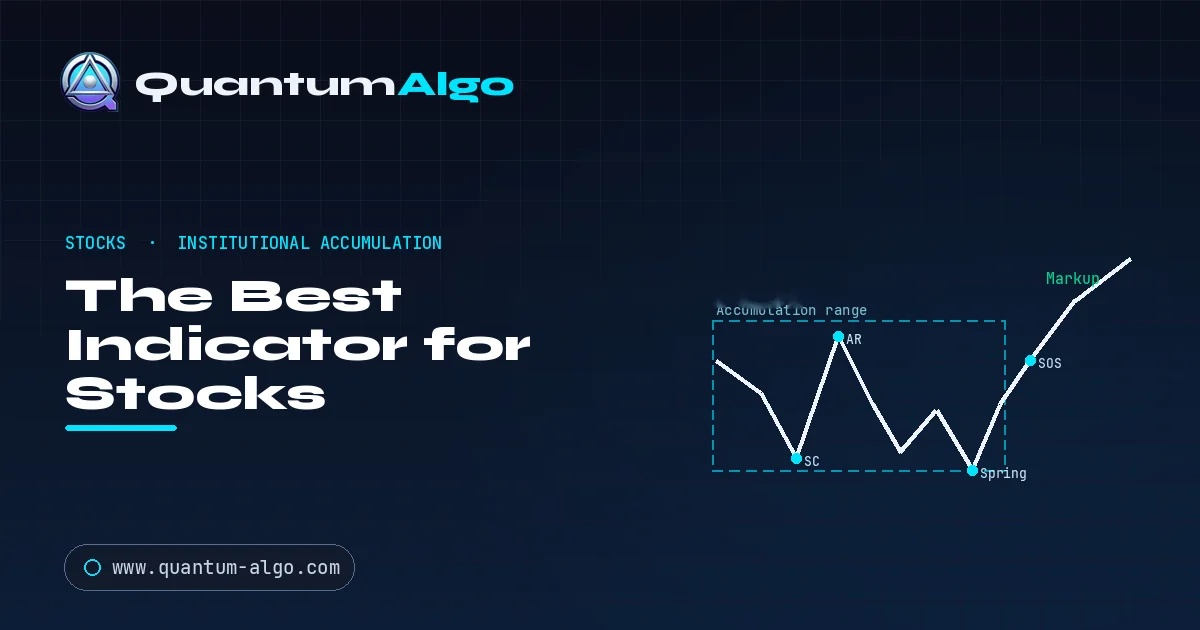
The best indicator for stocks is a Smart Money Concepts structure engine that reads institutional accumulation (Wyckoff range, spring, sign of strength) rather than momentum; moving averages and RSI confirm trends only after funds are positioned. Quantum Algo with Zeno Stocks flags them as non-repainting Buy/Sell signals (entry, stop, targets) with a 75% win rate over 160 trades.
A stock does not move because an oscillator crossed a line. It moves because a fund decided to build — or unload — a position measured in millions of shares, and it cannot do that at one price without moving the market against itself. So it accumulates quietly over days and weeks, absorbing supply near a floor, shaking out weak holders, and only then letting the stock run. The best indicator for stocks is the one that sees that accumulation while it's happening, not one that confirms the trend after the fund is already positioned. That is what Quantum Algo is built to do.
Equity traders moving from shares to indices can use the FTSE 100 London-open indicator guide to separate sector leadership from a clean cash auction.
The same accumulation logic changes character at the European open; the DAX cash-open framework shows how to read that handoff.
Indicators that prove themselves in public.
One engine, four precision tools — the Gold (XAU) Scalper, the institutional Gravity Zone, the Zeno momentum Oscillator, and Zeno Stocks for equities.
This guide is about institutional footprints in equities — the accumulation-and-distribution cycle that Wyckoff described a century ago and that Smart Money Concepts reads on a modern chart. You'll see how a position gets built through a trading range, why moving averages and RSI miss the entire process, and how a structure engine plus the dedicated Zeno Stocks tool turns that footprint into a non-repainting trade with a defined plan.
| What actually moves stocks | Institutions accumulating and distributing large positions over time |
| What it is | A Smart Money Concepts structure engine that reads accumulation, not momentum |
| Best for | Large-cap stocks, ETFs and indices on TradingView — 1H up to daily / weekly swings |
| Reads | Accumulation ranges, springs, order blocks, FVGs, structure shifts, MTF bias |
| Signals | Non-repainting, close-confirmed Buy / Sell with exact entry, stop, two targets |
| Proof | Public, timestamped record — 75% win rate over 160 closed signals |
How do institutions actually build a stock position?
Picture a fund that wants ten million shares. If it simply bought at market, its own demand would spike the price and it would pay far more for the last shares than the first. Instead it works the order over a trading range. Early on it absorbs panic selling near a floor — a selling climax where retail capitulates and the institution quietly takes the other side. It lets the stock bounce, then tests the lows again to see if any supply remains. Often it engineers one final flush below the obvious low — a spring — to trigger the last stop-losses and grab the cheapest shares from the traders who just gave up. Only once supply is exhausted does it let the stock leave the range on a sign of strength, and the markup begins.
This is the accumulation cycle, and its mirror is distribution at the top. Every large equity move you've ever seen was preceded by one of these processes. If your indicator can't see the range, the spring and the sign of strength, it is blind to the only thing that actually determines the trend.
The schematic above is the classic accumulation sequence — preliminary support, selling climax, automatic rally, secondary test, the spring, and the sign of strength that confirms institutions are positioned. Quantum Algo doesn't require you to hand-label these; its structure engine flags the order block left by the climax, the sweep of the spring, and the break of structure that signals markup — the same events, detected automatically.
Why do moving averages and RSI miss accumulation?
The classic equity indicators were built to measure one thing: how far price has stretched from its recent average. A 50/200-day golden cross confirms a trend that is usually well underway — the fund finished accumulating weeks ago, and you are buying as it begins to distribute. RSI flags "oversold" during the selling climax and "overbought" at the sign of strength, which is precisely backwards: the climax is where institutions buy and the sign of strength is where the real move starts. These tools aren't broken; they simply answer a question — "is price stretched?" — that has almost nothing to do with the question that matters, which is "who is accumulating, and is supply exhausted?" Only order-flow structure answers that.
| Moving averages / RSI | Quantum Algo (SMC) | |
|---|---|---|
| Reads | Distance from a moving average | Accumulation & distribution structure |
| The spring | Sees fresh weakness — exits | Sees supply exhausted — enters |
| Timing vs. the fund | Confirms after markup starts | Positions during accumulation |
| Distribution top | Lags the reversal | Flags the structure shift |
| Trend context | Single timeframe | Weekly / daily confluence |
| Output | A line to read | Entry, stop, two targets |
How Quantum Algo reads equity order flow
Quantum Algo is one engine with four tools, and equities lean on the whole stack plus Zeno Stocks, tuned for the Nasdaq, S&P 500 and major US names. The Structure engine detects the accumulation range, grades the order blocks the climax leaves behind, and confirms the sign of strength — so you enter on completed accumulation, not hope. It tracks premium and discount within the range so you buy near the floor, where the fund is buying, not in the middle. The Gravity Zone maps the liquidity price is drawn toward around gaps and the opening auction. The Oscillator serves only as an exhaustion filter, and the multi-timeframe panel keeps swings aligned with the weekly trend. One non-repainting signal, one defined plan.
How do earnings, gaps and the opening auction affect stock trades?
Equities have event risk no other market shares, and it shapes how you use the tool. Earnings create violent gaps that no indicator predicts — most disciplined swing traders simply avoid holding through the print, and the tool is used to trade the structure that forms after the gap, once the new range establishes. The opening auction each morning creates a burst of liquidity and often a fake move that reverses; the Gravity Zone maps that opening liquidity so you fade the trap rather than chase it. And gaps themselves frequently act as Fair Value Gaps that price returns to fill, giving structure-based entries a natural target. The point isn't to predict events — it's to read the institutional footprint they leave once the dust settles.
The public record
Most "best stock indicator" claims rest on a few cherry-picked winners. Quantum Algo's answer is a public ledger: Zeno calls posted on TradingView with a timestamp before the outcome, kept permanently — wins, losses and breakevens, never edited. Across it: a 75% win rate over 160 closed signals, 2.3:1 planned risk-to-reward. The curve below shows disciplined 1%-per-trade sizing applied to an edge like that.
The drawdowns are the honest part — every real system has them, and a run of stopped swings while a name chops in its range is normal. What compounds the account is the pairing of the edge with fixed-fractional risk management: the signals find accumulation, your sizing turns it into a curve that slopes up over a large sample.
What does a structure-based stock trading workflow look like?
Screen for context — a name in a strong weekly trend or one carving a clean accumulation range. Set the bias on the multi-timeframe panel and trade only with it. Wait for the range to resolve: mark the graded order block from the climax and watch for the spring and sign of strength. Enter on the close-confirmed signal near the floor, not mid-range. Define risk with a stop below the spring low and let the two targets run, moving to breakeven at the first. Sidestep the earnings print unless you're deliberately trading the post-gap structure. Journal every swing and your numbers will converge on the system's.
How do you backtest an indicator on stocks?
Because Quantum Algo doesn't repaint, you can scroll back through any ticker and see every accumulation range, spring and signal exactly as it printed — no hindsight. Test on liquid names where institutional footprints are clean; thin small-caps have erratic structure that flatters or breaks any method. Record at least fifty swings with fixed risk, and track win rate, average R and maximum drawdown together. If your results track the public ledger, the edge is real in your hands. The best indicator for stocks isn't the one that draws the tidiest moving average — it's the one that shows you the accumulation before the crowd sees the trend.

Automate your trades. Let Quantum Algo trade for you.
Every signal executed on your own account — 24/7, hands-off.
Frequently Asked Questions
The best stock indicator reads institutional accumulation and distribution rather than momentum. Quantum Algo is a Smart Money Concepts engine that detects accumulation ranges, springs and signs of strength — the footprints funds leave while building positions — and fires non-repainting Buy/Sell signals with a defined plan, backed by a 75% win rate over 160 closed signals.
Because a moving-average cross confirms a trend that is already underway. By the time the 50/200-day golden cross prints, the fund finished accumulating weeks earlier and may be starting to distribute — so you buy as smart money begins to sell. Structure reads the accumulation while it's happening.
A spring is a final flush below an obvious support that triggers the last stop-losses so institutions can grab the cheapest shares before markup. It's the single most reliable accumulation entry. Momentum tools misread it as fresh weakness; a structure engine reads it as accumulation completing.
Yes. It works best on liquid large-caps, major ETFs and indices, from 1-hour up to weekly swing timeframes, with the dedicated Zeno Stocks tool tuned for the Nasdaq, S&P 500 and major US names. The accumulation logic applies across liquid equities.
No indicator predicts an earnings gap, so most swing traders avoid holding through the print. Use the tool to trade the structure that forms after the gap, once a new range establishes — the post-earnings accumulation or distribution is where the clean, readable footprint appears.
They do different jobs and work well together. A screener finds candidates; Quantum Algo tells you exactly where and when to enter and exit a specific name with defined risk. Screen for a name in a strong weekly trend, then trade its accumulation structure.
No. Every signal is confirmed on candle close and never changes, which is essential for honest backtesting — you can scroll back through any ticker and see each accumulation range and signal exactly as it printed.
Yes. The same structure logic applies intraday, where the opening auction and gaps create the liquidity events the Gravity Zone maps. Swing traders use daily/weekly structure; day traders use 5-minute to 1-hour with the same accumulation and sweep logic.
The public record shows a 75% win rate over 160 closed signals at a 2.3:1 planned risk-to-reward. Your results depend on trading with the weekly bias, taking only completed-accumulation setups, and using fixed-fractional risk. The verifiable ledger is how you judge the edge.
Where a broker webhook is supported, signals can route to automated execution with stop-loss, take-profit and breakeven handling. Otherwise you receive the same signals as TradingView push notifications with the full trade plan to execute manually.
Matrix is $19/month for core signals, Atlas $39/month for the full SMC toolkit with filtering and backtesting, and Zeno $79/month for professionals with exact trade plans and the premium suite including Zeno Stocks. Annual billing saves 25%.
References & Related Guides
More in this topic
- How to Start Trading Stocks: Accounts, Rules, Your First Trade, and the Week That Follows
- How to Find Stocks for Day Trading: The Screen That Finds Today's Stocks Every Day
- Koyfin Review: A Bloomberg-Lite for Fundamentals — and Where Traders Should Still Use TradingView
- Unusual Whales Review: Options Flow, Dark Pools and Congress Trades — What the Data Can and Can't Tell You
- What Is After-Hours Trading? Extended Hours, Earnings Gaps and Why the Spread Is the Catch
- ADX Indicator: Complete Trading Guide
- AlphaTrend Indicator: Complete Trading Guide
- ATR (Average True Range): Complete Trading Guide
- Awesome Oscillator: Complete Indicator Guide
- What Are the Best Volume Indicators?
- Bollinger Bands — Complete Trading Indicator Guide
- CCI Indicator: Complete Guide
- Chandelier Exit: Complete Trading Guide
- Donchian Channels: Complete Indicator Guide
- Fibonacci Bollinger Bands: Complete Trading Guide
- Fibonacci Retracement — Complete Trading Guide
- Hull Moving Average (HMA): Complete Trading Guide
- Gaussian Channel Indicator Guide
- Best Buy/Sell Indicator Guide
Core reading
- BOS & CHoCH: Complete Market Structure Guide
- Order Blocks Trading: Complete Guide
- Best TradingView Indicators — Complete Guide
- Risk Management in Trading — Complete Guide
- Candlestick Patterns Guide — Engulfing, Pinbar & More
- All Premium Guides
- Quantum Algo on TradingView
- Public Track Record
Authoritative sources
For a focused comparison, read the Advance-Decline breadth for stocks before applying the setup.