What Is the Advance-Decline Line and How Do You Use It?
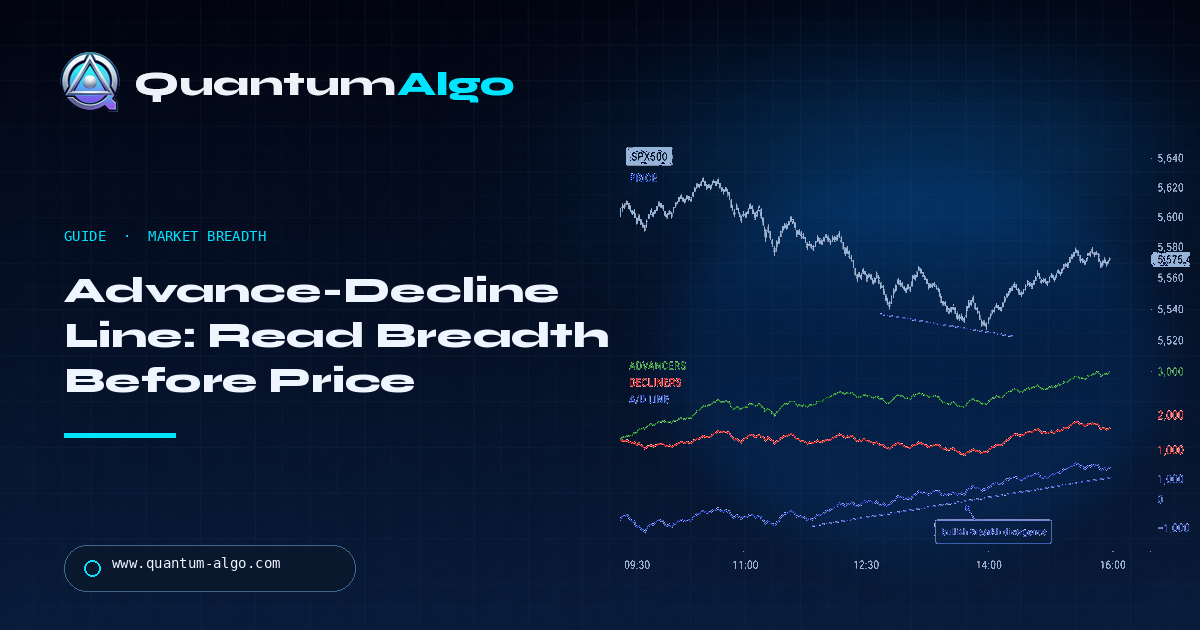
The Advance-Decline Line measures whether more listed stocks are rising or falling beneath an index move. Its edge is not prediction; it is breadth context. When SPX500 rises while the A/D Line makes a lower high, I treat the rally as less broadly supported and demand better price confirmation.
An index can look healthy while a surprisingly small group of names carries it. The Advance-Decline Line exposes that concentration by tracking the running difference between advancing and declining issues. I use it before taking an SMC signal on SPX500, NAS100 or a stock basket: if breadth agrees, the setup has participation behind it; if breadth diverges, the setup needs a tighter standard.
Indicators that prove themselves in public.
One engine, four precision tools — the Gold (XAU) Scalper, the institutional Gravity Zone, the Zeno momentum Oscillator, and Zeno Stocks for equities.
Use the guide as a decision filter, not as a collection of labels. The market, the session and the invalidation still decide whether an idea deserves risk.
What does the Advance-Decline Line tell traders?
The A/D Line tells you how broad the internal participation is behind a market move. It rises when advancing issues outnumber declining issues and falls when decliners dominate. Because it accumulates the daily net difference, it can reveal a quiet improvement or deterioration before the headline index makes it obvious.
That does not make it a timing trigger. The line can rise while price pulls back, or flatten while price trends. I read it as a question: are enough constituents participating to make this move durable?
| Item | Value / rule | Why it matters |
|---|---|---|
| Formula | A/D line = previous value + (advancing issues − declining issues) | Cumulative, so the slope matters more than the level |
| Universe | NYSE composite (≈2,000+ issues) or S&P 500 constituents | Index-weighted price can rise while most issues fall |
| Classic divergence | Index prints a higher high, A/D line prints a lower high | Narrow leadership: the rally rests on fewer stocks |
| Breadth thrust (Zweig) | 10-day average of advances ÷ (advances + declines) moves from below 0.40 to above 0.615 within 10 sessions | Rare, historically associated with the start of strong up-legs |
| Related breadth tools | % of stocks above 50-day / 200-day MA · new highs − new lows · McClellan Oscillator | Cross-check when the A/D line is ambiguous |
| Reading cadence | Daily close for swing context; intraday A/D for index day trades | Intraday A/D confirms or denies an opening drive |
How is the A/D Line calculated?
The basic calculation is simple: today’s net advances equal advancing issues minus declining issues, and the A/D Line adds that net figure to the previous reading. If 3,200 stocks advance and 1,400 decline, the day contributes +1,800 to the line. Unchanged issues do not add to either side.
The exact universe matters. A broad NYSE line, an exchange-specific line and a broker’s synthetic breadth feed are not interchangeable. Before comparing a breadth reading with an index, confirm the constituent universe, session, timezone and whether the data is adjusted.
Why can breadth diverge from the index?
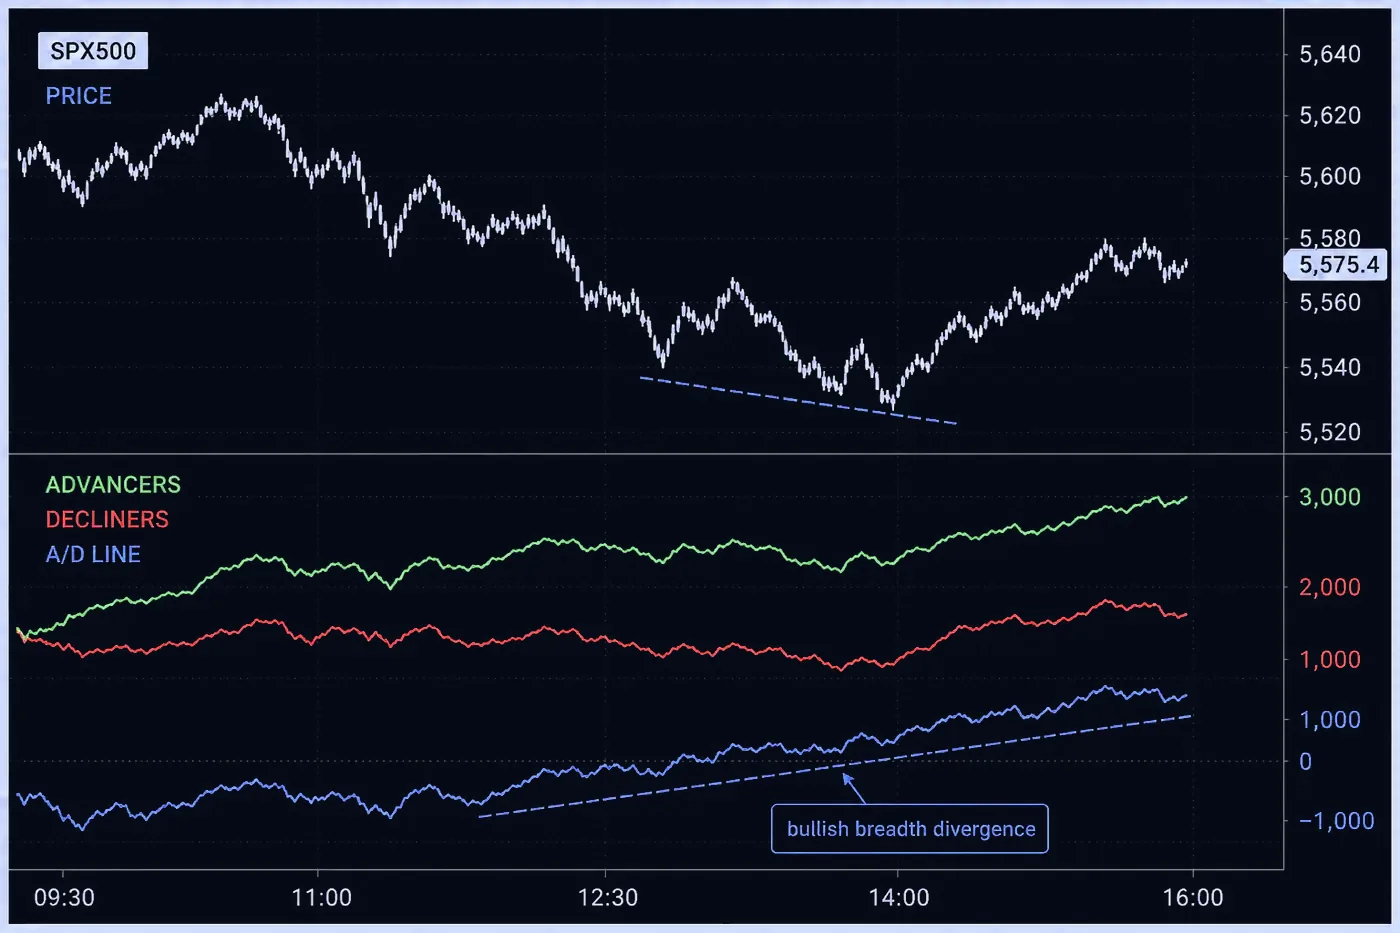
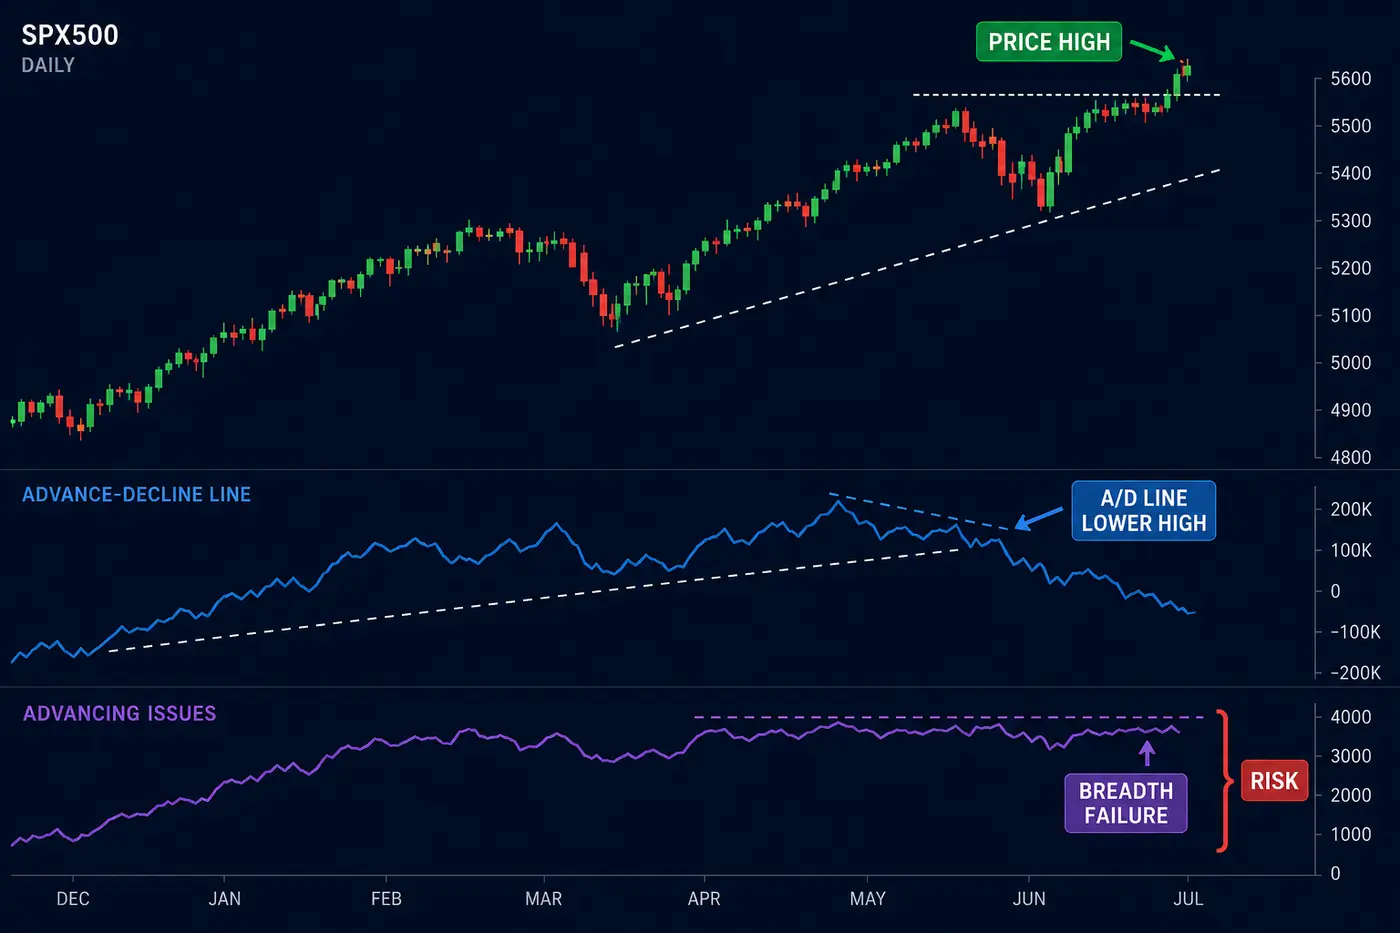
Capitalization-weighted indices can be lifted by a handful of large companies. The index prints a higher high, but the average listed stock may be flat or lower. That is the classic bearish breadth divergence. The reverse also matters: price can sit in a range while the A/D Line quietly improves, creating a wider base for a later breakout.
I do not short the index simply because breadth is weak. I wait for price to lose a level, fail a retest or reject liquidity. Breadth tells me which break deserves attention.

Automate your trades. Let Quantum Algo trade for you.
Every signal executed on your own account — on your account, with the plan you define.
What is a breadth thrust and when is it useful?
A breadth thrust is a rapid expansion in participation: advancing issues surge relative to decliners and the A/D Line moves sharply out of a depressed area. It can mark a transition from a damaged market to a more constructive regime. The important part is the change in participation, not a magic threshold copied from a different data set.
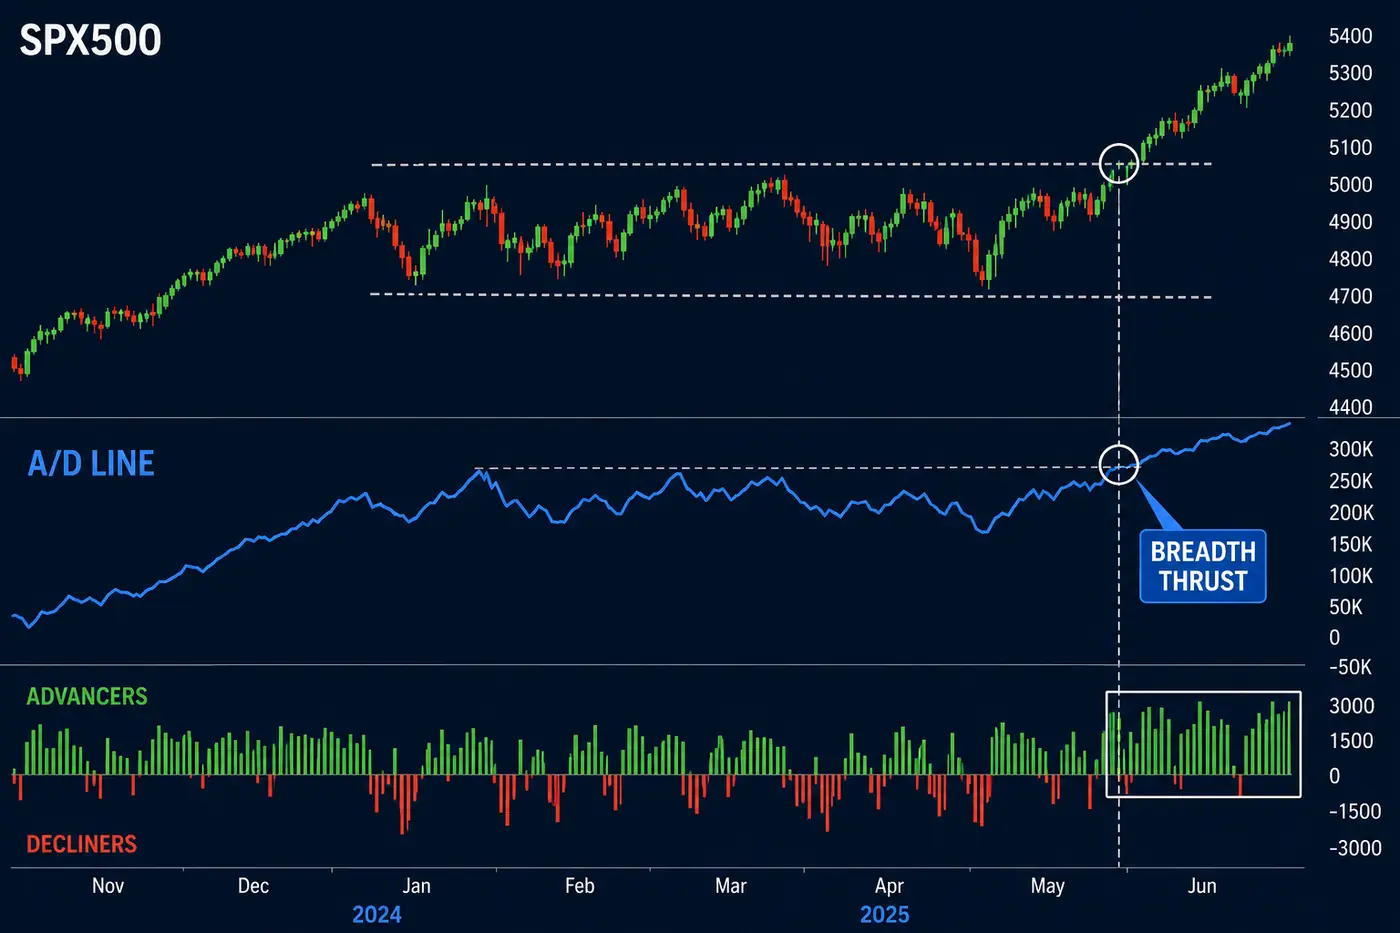
Use it as a regime filter. If the index is reclaiming VWAP and the A/D Line is thrusting higher, long setups get a better backdrop. If the index is rising but the thrust is absent, I ask whether the move is narrow and vulnerable.
Which market should you compare with the A/D Line?
Match the breadth series to the market you are trading. For a broad US index, a broad US breadth series is more useful than an unrelated sector line. For a stock, compare the stock with its sector and the parent index. For NAS100, remember that its largest constituents can dominate the index even when many smaller names are fading.
The same principle applies to session selection. A/D readings captured at the cash open answer a different question from readings taken during the final hour. Keep the sampling window consistent in your journal.
How do you use breadth with VWAP and SMC?
My sequence is location, participation, then execution. Use the free public Quantum Algo indicators to map order blocks, fair value gaps and displacement. Use VWAP to describe intraday acceptance. Use the A/D Line to check whether enough constituents are participating. Three panels do not create three votes; each panel answers a different question.
A bullish SPX500 reclaim above VWAP at a demand zone is more interesting when the A/D Line is rising and advancers are expanding. If breadth is falling, wait for the reclaim to prove itself or reduce the trade frequency. Quantum Algo’s free public indicators mark order blocks and fair value gaps; Zeno provides confirmed Buy/Sell signals with stop-loss, take-profit and built-in risk management. QuantumBot is the $199/mo automated execution service. Plans are $19, $39 and $79 per month; cancel anytime.
What does a breadth failure look like?
Breadth failure is not simply a red A/D Line. It is a mismatch between the price move you want to trust and the participation underneath it. A breakout with fewer advancing issues, a lower A/D high or a sudden return of decliners is a warning that the move may be narrow.
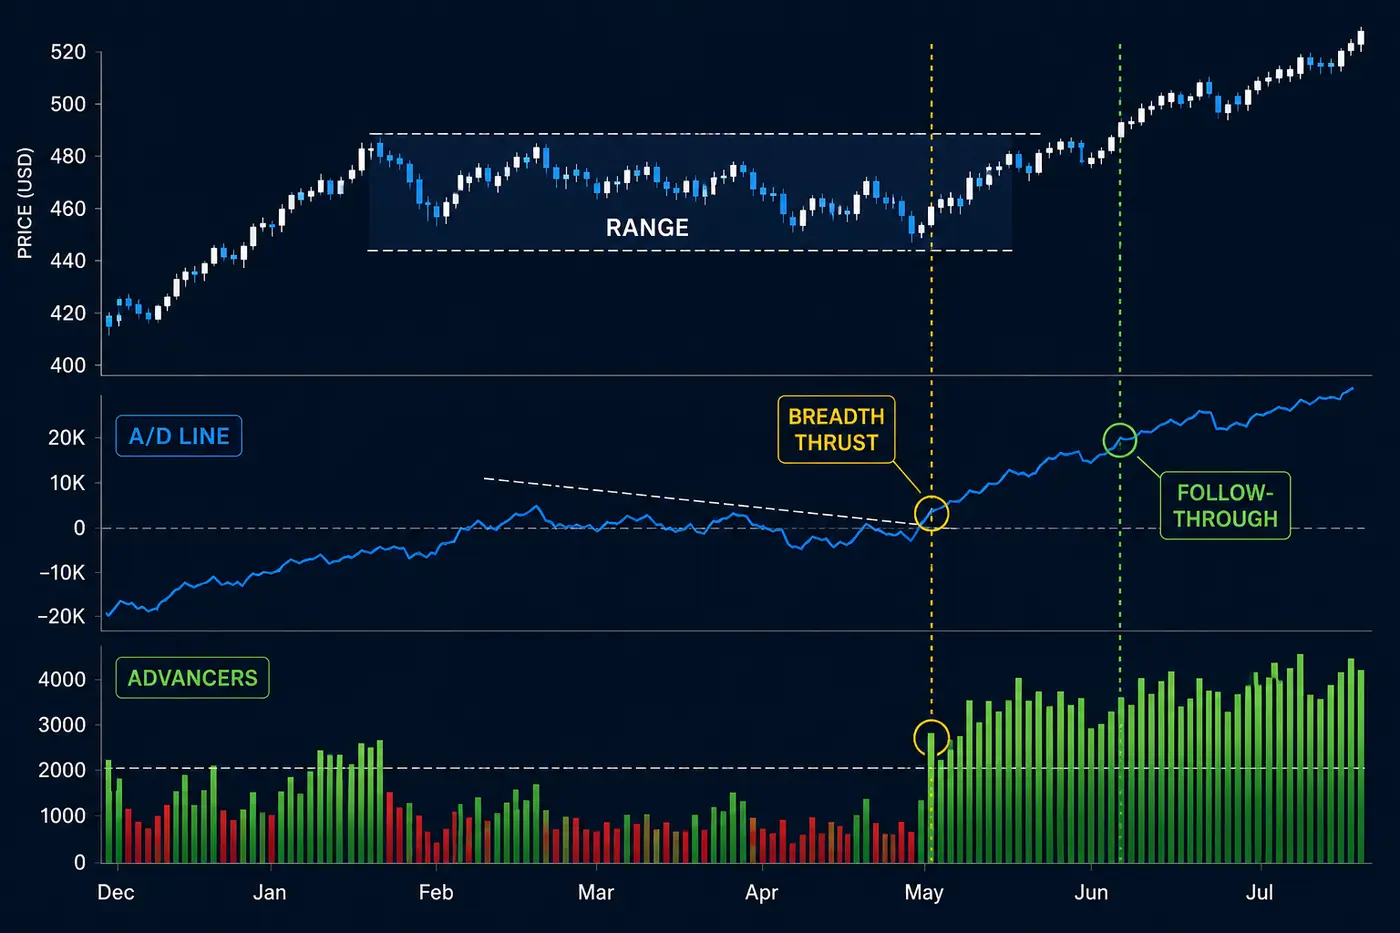
When the failure appears, I shorten the decision window. I do not widen the stop to compensate for weak participation. If the trade has no clean invalidation, it is not ready.
How do you build an A/D confirmation plan?
For an intraday index setup, mark the opening range, the prior-day extremes and VWAP. Decide which price event would create the trade: reclaim, break-and-retest or liquidity sweep. Then ask whether breadth is improving, deteriorating or merely flat. Only after that do I choose an entry and stop.
The example is conditional. If the A/D Line rolls over while price loses the reclaim, the long thesis is invalid. For related execution context, compare the stocks indicator guide, the Nasdaq guide and the VWAP guide.
Can a bot execute a breadth-filtered signal?
Automation can execute a breadth-filtered signal when the breadth feed, symbol mapping and rule timing are defined. A bot cannot repair a feed that updates late or a rule that says “breadth looks good.” Define the threshold, the session and the failure condition before connecting an execution service.
Quantum Algo’s free public indicators mark order blocks and fair value gaps; Zeno provides confirmed Buy/Sell signals with stop-loss, take-profit and built-in risk management. QuantumBot is the $199/mo automated execution service. Plans are $19, $39 and $79 per month; cancel anytime.
| Tool | What it measures | Its job in the plan |
|---|---|---|
| A/D Line | Advancers minus decliners over time | Breadth behind an index move |
| Price only | Index level and candles | Headline direction without internals |
| VWAP | Volume-weighted session value | Intraday acceptance and location |
| Breadth thrust | Rapid participation expansion | Regime shift confirmation |
How does index weighting distort a breadth read?
The headline index and its constituents do not carry equal influence. A capitalization-weighted index can rise because a few very large companies are bid while a much larger number of smaller names are flat or falling. The A/D Line gives each advancing and declining issue a vote, so it answers a different question from the index price. Neither is the “real” market by itself. The useful comparison is the gap between the two.
On NAS100, I want to know whether the move is a broad technology bid or a narrow push from the largest names. If the index is above VWAP and breadth is expanding, a pullback into a clean demand zone has a better backdrop. If the index is higher but the A/D Line is rolling over, I do not automatically short the first red candle. I reduce the number of continuation trades I will accept and require a clearer sweep, reclaim or break-and-retest.
The same problem appears inside sectors. A stock can outperform while its sector breadth weakens, or a sector can improve while the stock remains below a broken level. That is why I label every breadth chart with its universe. “Breadth is strong” is incomplete until the trader says: NYSE, Nasdaq, S&P constituents, sector basket, or another defined set.
What is the difference between breadth thrust and breadth divergence?
A thrust describes acceleration in participation. Divergence describes disagreement between participation and price. They can occur together, but they are not interchangeable. A thrust can support a breakout when advancing issues expand quickly. A divergence can warn that a new index high is narrow. Calling every rising A/D Line a thrust makes the word meaningless and encourages overconfidence.
I use a simple three-state journal label: expanding, contracting or mixed. “Expanding” means the line is making higher highs or breaking a prior breadth range with price support. “Contracting” means the line is making lower highs, losing a base or showing declining participation into a price advance. “Mixed” means price and breadth are not giving a clean relationship. Mixed is a valid output; it is not a problem that needs a forced trade.
For an opening-range setup, the breadth state can change quickly. The first fifteen minutes may show a surge in advancers, then a reversal as the opening auction settles. I take a second reading after the first meaningful pullback. If the index retests VWAP but breadth fails to recover, that retest is lower quality than the initial breakout suggested. The filter is most valuable when it changes the decision, not when it merely confirms a trade already chosen.
How should stock traders use breadth without overfitting?
Use breadth as a context layer, then keep the trade rule on the instrument you can actually execute. For a single stock, define the parent index, sector and breadth universe before the sample starts. Avoid changing from NYSE breadth to Nasdaq breadth because one happens to look better after the fact. Record the breadth state at entry and at exit so you can test whether it improved selection or only improved the explanation.
News days deserve a separate tag. A large CPI, earnings or central-bank move can make breadth jump in both directions while the index travels far. That is not automatically a clean breadth signal; it may be a repricing event. Keep the risk smaller or wait for the post-news range to form. The A/D Line cannot tell you the size of a gap, the spread you will pay or whether a broker will fill the same level you see on a cash index.
When is the A/D Line least reliable?
The line becomes harder to interpret when the universe, session or data feed changes. A broad exchange breadth series can be open while your index CFD feed is quoting a different contract or timezone. It is also noisy around large gaps, rebalances and major news. I label those conditions rather than pretending the same threshold applies on every session.
For an opening trade, I take a snapshot only after the first burst of orders has printed. Before that, advancing and declining counts can swing because a small number of constituents update at different times. The first snapshot is still useful as an observation, but I do not let it override a clear price rejection. Breadth is a context layer; execution belongs to the instrument and the broker feed.
There is a practical distinction between confirmation and permission. Confirmation means breadth agrees with a trade idea already created by price. Permission means breadth is used to decide which setups are worth examining. I prefer permission. If the A/D Line is contracting, I may still take a high-quality reversal at a major level, but I will not treat every intraday higher high as a continuation opportunity.
For a fair review, save a chart screenshot or numeric reading at entry. Do not reconstruct breadth from a later chart after the outcome is known. The useful question is not “could breadth have predicted the move?” It is “did the rule improve the quality of the decisions made with information available at that moment?”
What does breadth look like during a healthy index pullback?
A healthy pullback does not require the A/D Line to rise every minute. I want to see the line hold above the prior breadth swing or recover while price tests VWAP or a demand zone. If the index pulls back, breadth contracts modestly and then expands as price reclaims the level, the internal structure is healthier than a price-only chart suggests.
A damaged pullback is different. Price may remain near its high while the A/D Line makes lower highs, advancers fade and the retest fails. That is a reason to lower the quality rating of continuation trades. It is not a command to sell short at the first divergence. Price still has to show the level that failed.
For stock traders, I also compare the individual name with its sector breadth. A stock can be strong for idiosyncratic reasons while the sector weakens. In that case the market-wide A/D Line may be too broad to decide the trade. The more specific the execution, the more carefully the context universe must be chosen.
What is the breadth rule I would actually trade?
I would use the A/D Line to select which index setups deserve attention: price provides the level and trigger, breadth describes whether participation supports the move, and the stop remains at the price invalidation. A falling breadth line can downgrade a continuation without forcing a short.
That rule keeps the indicator honest. It is allowed to filter trades, not to predict every tick. I would rather miss a narrow rally than pretend a headline index high represents broad demand when the internal data says otherwise.
What should the breadth checklist leave out?
It should leave out a universal bullish or bearish reading. Breadth must be matched to the index universe, session and price event. Its job is to expose participation, not to replace the chart that supplies the entry and invalidation.
The A/D Line is a participation test. Match the breadth universe to the market, compare it with price structure and VWAP, and treat divergence as a filter—not a short signal. A strong SMC level still needs a defined invalidation.
◆ Interactive check
Can you read breadth before price?
Questions traders ask about market breadth
The Advance-Decline Line is a cumulative market-breadth indicator. Each period adds advancing issues minus declining issues to the prior reading, showing whether participation is broadening or narrowing.
Subtract the number of declining issues from advancing issues for the selected market universe, then add that net figure to the previous A/D reading. The universe and data session must stay consistent for comparisons to mean anything.
A rising line means advancing issues are outweighing declining issues over the accumulation window. It suggests improving participation, but it does not specify the exact entry or guarantee that price will rise.
It means price makes a stronger high while the A/D Line makes a weaker high. The move may be narrower than it looks, so wait for price confirmation before treating it as a short idea.
A breadth thrust is a rapid expansion in advancing participation relative to decliners. Traders use it as evidence of a possible regime improvement, then wait for price follow-through and risk-defined entries.
It can be useful during cash-market sessions when the breadth feed updates reliably. Use it as an intraday context filter beside VWAP and price structure rather than as a standalone signal.
Yes. Use SMC structures for location and displacement, then compare the A/D Line with the index move. The two tools answer different questions: structure describes price, breadth describes participation.
Quantum Algo’s public tools focus on Smart Money Concepts structures such as order blocks and fair value gaps. Zeno provides confirmed Buy/Sell signals with SL/TP and built-in risk management; it does not draw breadth structures.
A capitalization-weighted index can rise because a few large constituents are strong while more stocks are flat or falling. That concentration is why breadth can add information the headline index hides.
QuantumBot can execute a defined signal plan where a supported connection is available. The rules still need a symbol, breadth feed, entry, stop, target and risk limit.
Quantum Algo publishes a timestamped ledger showing 75% across 160 posted trades, with 120 wins and 40 losses. It is a record to verify, not a promise for a breadth setup or individual account.
References & Related Guides
Read next
- Best Indicator for Stocks
- Best Indicator for Nasdaq
- Best Indicator for S&P 500
- Correlation Trading Academy Lesson