What Is the Best Indicator for S&P 500 (SPX500)?
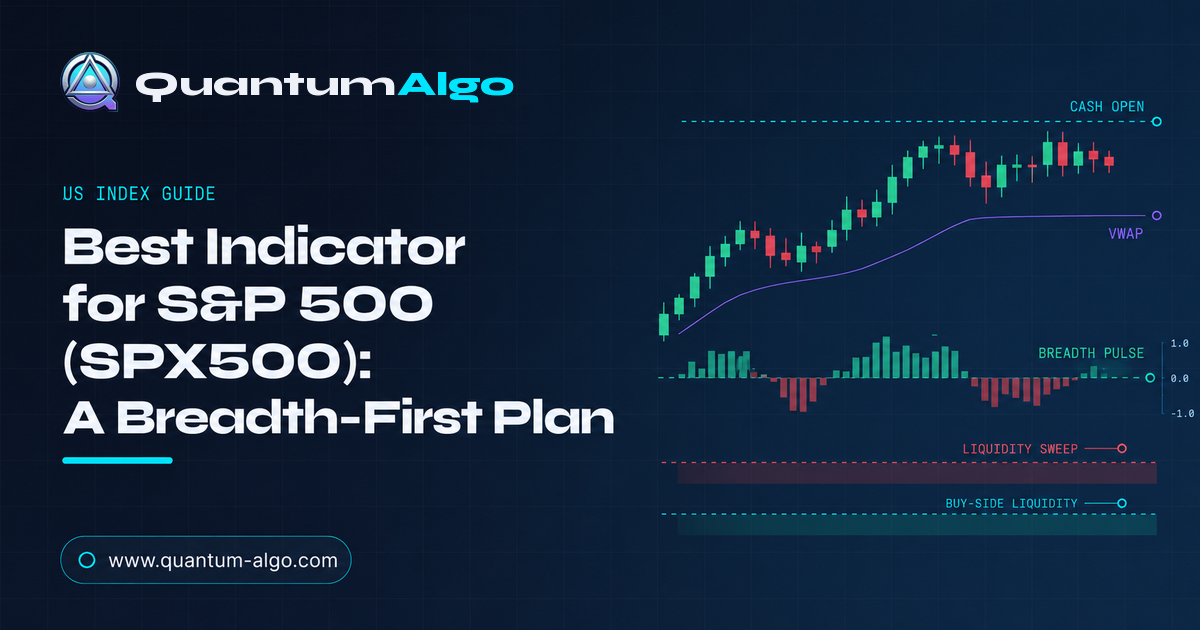
A 1.2% S&P 500 rise with an advance/decline ratio below 0.8 is not broad strength. For the best indicator for S&P 500 trading, that is the first filter: SPX500, US500, ES and the cash index can print the same bullish candle while the average constituent quietly loses participation. Quantum Algo’s TradingView workflow treats that divergence as a veto question before trusting the structure.
The best indicator for S&P 500 trading is a structure tool paired with a participation check: mark the overnight and prior-day range, watch the cash open, compare price with breadth and VWAP, then require a sweep, displacement or reclaim before entry. Quantum Algo’s free public indicators mark order blocks and FVGs; Zeno supplies confirmed Buy/Sell signals with SL/TP and built-in risk management.
The S&P 500 is a breadth problem before it is an indicator problem: the index can rise while a small group of mega-cap names carries the chart, so the useful tool is the one that tests participation before it confirms direction. I would rather miss a first push than buy an index that is rising on three names while the rest of the tape quietly deteriorates.
Indicators that prove themselves in public.
One engine, four precision tools — the Gold (XAU) Scalper, the institutional Gravity Zone, the Zeno momentum Oscillator, and Zeno Stocks for equities.
Use this guide for SPX500 CFDs, ES futures and the TradingView feed your broker supplies. The symbol can trade almost around the clock, but the NYSE cash open still changes the quality of the auction. S&P Dow Jones Indices’ S&P 500 overview describes the index as a large-cap US equity benchmark; that breadth is exactly why a price-only signal can hide internal weakness. CME’s E-mini S&P contract specification is the place to verify point value and tick details before translating a chart stop into dollars.
| Layer | Question | What I refuse to do |
|---|---|---|
| Structure | Where did price take liquidity and displace? | Buy every green candle above VWAP. |
| Breadth | Are enough stocks participating? | Treat mega-cap leadership as broad confirmation. |
| VWAP | Is price accepting above or below intraday value? | Fade every touch in a trend. |
| ATR | Is the stop realistic for current movement? | Use volatility as a direction signal. |
| Signal layer | Is there a repeatable Buy/Sell plan with SL/TP? | Assume a signal removes the sizing decision. |
What is the best indicator for S&P 500 (SPX500)?
For the S&P, I would choose a Smart Money Concepts structure tool and add breadth as a veto filter. The structure tells me where the index interacted with a prior-day high, overnight low, order block or fair value gap. Breadth tells me whether the move has enough participation to deserve continuation. VWAP tells me whether the auction is accepting value above or below the session average.
The important distinction is that breadth is not a buy or sell trigger. It is a quality check. A bullish structure break with improving participation is different from a bullish structure break driven by a single earnings-heavy stock group. This is why the S&P page should sit beside the broader best stock indicator guide, not replace it.
Why does the S&P need breadth before a signal?
The S&P 500 is capitalization-weighted. That means index price can look healthy while the average constituent is not making the same progress. You do not need a perfect advance-decline dataset to notice the practical risk: when price makes a higher high but participation makes a lower high, a breakout deserves less trust until the market proves acceptance.
S&P DJI’s index mathematics methodology explains why float-adjusted capitalization lets a few large constituents pull the headline index, which is why breadth belongs beside structure.
I use breadth in three states: expanding, flat and deteriorating. Expanding breadth supports a continuation plan. Flat breadth tells me to demand a deeper retracement or a cleaner reclaim. Deteriorating breadth makes me suspicious of late entries, especially when price is far above VWAP and the first target is already nearby. The liquidity sweep guide is useful here because a failed high with weak participation is a different event from a clean acceptance breakout.
Which tools separate index direction from mega-cap concentration?
VWAP, ATR and structure each answer different questions. VWAP is a useful reference for the intraday average, but VWAP cannot tell you whether the move above it is broad or narrow. ATR can tell you whether a 12-point stop is absurd on today’s range; it cannot tell you who is participating. The ATR guide explains that distinction in more detail.
The practical stack is therefore small: higher-timeframe structure, session liquidity, breadth state, VWAP location and one risk rule. If those inputs disagree, I do not add MACD, RSI and three more oscillators to create the illusion of certainty. I reduce the trade to a question that can be answered on the chart.
How does the cash open change an SPX500 setup?
The overnight session creates levels; the cash open tests them. A push above the overnight high before the open is not the same as a push that holds after the NYSE opens. NYSE’s market-hours page is the authority I would check for the official schedule, while the chart remains the place to judge acceptance.
On a 15-minute chart, I mark the overnight high and low, prior-day high and low, and the first 30-minute opening range. Then I watch whether the first expansion closes outside the range or falls back inside it. A reclaim back through the range can produce a clean reversal; a displacement candle that holds outside can produce continuation. Neither deserves an entry while it is still only a wick.

Automate your trades. Let Quantum Algo trade for you.
Every signal executed on your own account — 24/7, hands-off.
How do you build a breadth-first S&P trading plan?
Start with the 4-hour and 1-hour charts. Mark the nearest unswept external liquidity and decide whether the day is more likely to expand or rotate. On 15 minutes, classify the overnight range as tight, average or already extended. On 5 minutes, refine only after the higher-timeframe idea, cash-open event and breadth state agree.
My checklist is deliberately asymmetric. Structure can create the setup, breadth can downgrade it, VWAP can define location, and ATR can set the stop context. A signal is allowed to trigger execution, but it is not allowed to overrule an invalid symbol, a poor contract value or a position that risks more than the account rule permits. The free Academy entry-confirmation lesson is a good drill for this sequence.
When the S&P is trending, I prefer pullbacks into a reclaimed level rather than chasing a new high. When it is rotating, I prefer a sweep of an obvious range edge followed by a close back through value. The same indicator can support both; the session state decides which model is active.
What does a breadth-confirmed SPX500 setup look like?
Here is an illustrative 15-minute US500 example. The 4-hour structure is bullish. Overnight price forms a 24-point range below the prior-day high. After the cash open, the index dips through the overnight low, then closes back above it with a wide bullish candle while breadth improves from deteriorating to flat. I do not buy the spike. I wait for the retracement into the reclaim zone.
The invalidation is below the sweep low, not below the entry candle. The target sits near the prior-day high where opposing liquidity is visible. If one CME micro E-mini contract is worth $5 per index point on the product you trade, a 12-point stop is $60 of contract risk; verify the live specification before placing the order. For a $10,000 account risking 0.5%, the $50 budget would require a smaller unit or a different feed.
This is where a screenshot can mislead. An arrow at 5,220 looks brilliant after the move, but it changes the stop, cash risk and R multiple. The useful guide exposes the sequence: reference range, cash-open test, breadth state, reclaim, invalidation, target.
Is 5 minutes too fast for SPX500?
Use 4H and 1H for bias, 15m for the opening-range structure, and 5m for refinement. I would not build the entire plan on a 1-minute chart because the S&P can generate dozens of small structure changes before the first real auction decision is complete. More candles are not more information.
The NASDAQ guide is a useful contrast: the US100 often accelerates harder around the open, while the S&P can show a more balanced rotation. Use the same shell, but not the same expectations.
How wide should an SPX500 stop be at the cash open?
Use this breadth-versus-price checker when the cash index moves quickly. A positive index change with an advance/decline ratio below 0.8 is divergent; a negative change with a ratio above 1.2 is also divergent. In the middle, wait for a cleaner participation read.
For the formula and the habit of rounding down, use the Academy position-sizing lesson. If the stop doubles, the position should halve when account risk stays fixed.
Can QuantumBot execute a breadth-confirmed SPX500 signal?
Automation solves execution, not market understanding. QuantumBot is Quantum Algo’s automated execution service: it trades the signals for the user where a supported connection is available. The service is $199/mo; cancel anytime. Keep symbol selection, contract verification and risk limits separate from the execution layer. If you prefer signal-assisted execution, compare the Zeno AI Agent with the current plans.
Which breadth warning should stop an SPX500 plan?
Review the S&P by session, not by the prettiest historical entry. Open a replay at the start of the overnight range and record the prior-day extremes before looking at the indicator. Then note the breadth state, the distance from VWAP and the first cash-open event. If the indicator would have produced a long before those facts were visible, it is not giving you a complete plan; it is giving you a retrospective decoration.
I also separate leadership from participation in the journal. Write down whether the index move was supported by broad participation, carried by a narrow group, or fading while price still looked strong. That one sentence changes how you judge a losing trade. A failed long in a broad expansion is a normal outcome. A late long during deteriorating breadth is often a process error.
For backtesting, do not mark the final chart after the fact and call every perfect reclaim a signal. Use replay, freeze the information available at the candle close, record the entry, stop and target, then continue. This is especially important on the S&P because the most obvious index move can be explained by a single constituent headline after the trade began. The Academy backtesting lesson gives you a repeatable review routine.
Finally, compare the index with the instrument you actually execute. SPX500 CFD, US500 CFD, ES and MES may show slightly different spreads, sessions and point values. If the setup only works on one feed after the spread is included, that is useful information. It means the edge belongs to the execution environment, not to a universal S&P pattern.
My standard is simple: a good indicator should make the reason for the trade clearer before entry and the reason for the exit clearer after invalidation. If the explanation begins with “the arrow looked strong,” I have not done enough work.
That review also keeps the page honest about the product. The free public indicators mark the structures you can study directly on TradingView. Zeno adds the signal plan and risk layer, but neither tool removes the need to verify the exact S&P symbol and execution feed. The public ledger is evidence to inspect, not a substitute for a market-specific sample.
Once the process is stable, save the screenshots that show the decision before the result: the range, participation state, structure event and planned risk. Those are the artifacts that make a later review useful.
The final test is repeatability: can another trader read the same range, identify the same invalidation and calculate the same cash risk without needing your hindsight? If yes, the indicator has earned a place in the process. If not, simplify the chart before adding another tool.
That is the standard I would use for a buyer-intent page: the recommendation must survive a chart replay, a contract check and a risk calculation. A polished label is not enough. The decision should still make sense after the excitement of the opening candle is gone. That is the difference between a tool and a process you can audit later, before any new trade.
The S&P 500 is a breadth problem before it is an indicator problem: the index can rise while a small group of mega-cap names carries the chart, so the useful tool is the one that tests participation before it confirms direction. Mark the local range, wait for the active auction, require structure confirmation, use the market-specific context filter, place the stop beyond invalidation and size from cash risk. If you automate, automate a verified plan rather than a naked arrow.
◆ Interactive check
Can breadth rescue a weak index read?
Questions traders ask about S&P 500
There is no single magic oscillator. The strongest approach is a session-aware structure workflow that maps liquidity, confirms displacement or reclaim, uses VWAP or breadth as context, and sizes the stop from current volatility. Quantum Algo’s free public indicators mark order blocks and FVGs; Zeno adds confirmed Buy/Sell signals with SL/TP and built-in risk management.
VWAP is useful as an intraday location reference, not as a complete entry system. It can show whether price is accepting above or below an average, but it cannot tell you whether liquidity was swept, whether breadth agrees, or where the idea becomes invalid.
The most useful window is the local cash-market open and the first active overlap that follows it. Check the official exchange schedule, your broker chart timezone and daylight-saving changes; do not copy a fixed clock time from another feed.
Use 4H and 1H for bias, 15 minutes for the session structure, and 5 minutes only to refine a qualified setup. A 1-minute chart can help with execution, but it should not rewrite the higher-timeframe invalidation or the cash-risk calculation.
The free public Quantum Algo indicators mark Smart Money Concepts structures such as order blocks and fair value gaps. Zeno is the paid signal layer: it provides confirmed Buy/Sell signals with stop-loss, take-profit and built-in risk management; it does not draw those structures.
Quantum Algo is built for TradingView markets including indices. Test the exact symbol, exchange feed, point value and session representation supplied by your broker before committing capital.
The stop belongs beyond the price level that invalidates the idea, not at a fixed number copied from another trader. Use the session structure and current volatility to set the distance, then reduce position size when the stop is wider.
QuantumBot is the automated execution service that trades the signals for the user where a supported connection is available. It executes the signal plan; it does not replace symbol verification, contract selection, position sizing or the responsibility to check the connection.
Quantum Algo publishes a public timestamped ledger showing a 75% win rate across 140 posted trades, with 105 wins and 35 losses. That is a record to verify, not a promise for this index or for any individual account.
The logic can transfer, but the contract cannot be assumed to match. CFDs and futures can have different point values, spreads, trading hours and rollover behavior. Translate the chart stop into the exact cash value for the instrument you trade.
References & Related Guides
Read next
- Best Indicator for Nasdaq: Complete Guide
- Best Indicator for DAX (GER40): A Trading Plan
- VWAP Indicator: Complete Trading Guide
- ATR (Average True Range): Complete Guide
- Liquidity Sweep Trading Guide
- Smart Money Concepts Guide
Authoritative sources
- S&P Dow Jones Indices: S&P 500 overview
- CME: E-mini S&P 500 contract specifications
- NYSE: market hours and calendars
- Cboe: VIX methodology
- S&P DJI: index mathematics methodology
Verify the proof
For a focused comparison, read the S&P 500 breadth context before applying the setup.