Darvas Box: How to Draw It, Trade the Breakout and Trail the Stop

The Darvas box is Nicolas Darvas's breakout method: a new high not exceeded for three days becomes the box top, and the low that then holds for three days becomes the bottom. Buy the breakout above the top on rising volume, place the stop just under the bottom, and raise it to each new box.
Nicolas Darvas was a dancer, not a trader, and the method he built while touring the world is one of the simplest trend-following systems ever written down: draw a box around a strong stock's pause, buy when it breaks out, and let the next box move the stop. It has outlived most of the indicators invented since because it forces the two things most traders skip — waiting, and a stop defined before the entry. This guide covers what the box is, the three-day rule for drawing it, how boxes stack into a trailing stop, the techno-fundamental filter Darvas used, how it compares with similar patterns, a box builder for your own data, a worked breakout, and the mistakes that break the method.
Indicators that prove themselves in public.
One engine, four precision tools — the Gold (XAU) Scalper, the institutional Gravity Zone, the Zeno momentum Oscillator, and Zeno Stocks for equities.



What is the Darvas box?
The Darvas box is a breakout method that draws a rectangle around a rising stock's pause — the high it cannot get past and the low it will not give back — and buys when price escapes the top of that rectangle on rising volume, with a stop just under its bottom. It was developed by Nicolas Darvas (1920–1977), a Hungarian-born professional dancer who traded US stocks by telegram while touring, and who described the method in How I Made $2,000,000 in the Stock Market, published in 1960.
The idea is simple: a stock in a strong uptrend does not move in a straight line; it advances, pauses inside a range, then advances again. Darvas saw those pauses as a series of boxes stacked on top of each other. As long as price stayed inside the current box he did nothing. When it broke out of the top he bought; when a breakout failed and price fell back through the bottom he was stopped out. As the stock climbed into new boxes he raised the stop to the bottom of each one. It is a trend-following breakout system with the risk defined before the entry — the same logic behind the rectangle pattern and most modern breakout strategies.
The story comes with a caveat worth knowing. Darvas said he made about $2.45 million in roughly 18 months of the late-1950s bull market. The New York Attorney General later disputed the figure, putting the ascertainable profits far lower, and a court halted that investigation. The method does not depend on the headline number; it is a set of rules that can be tested on any chart.
How do you draw a Darvas box?
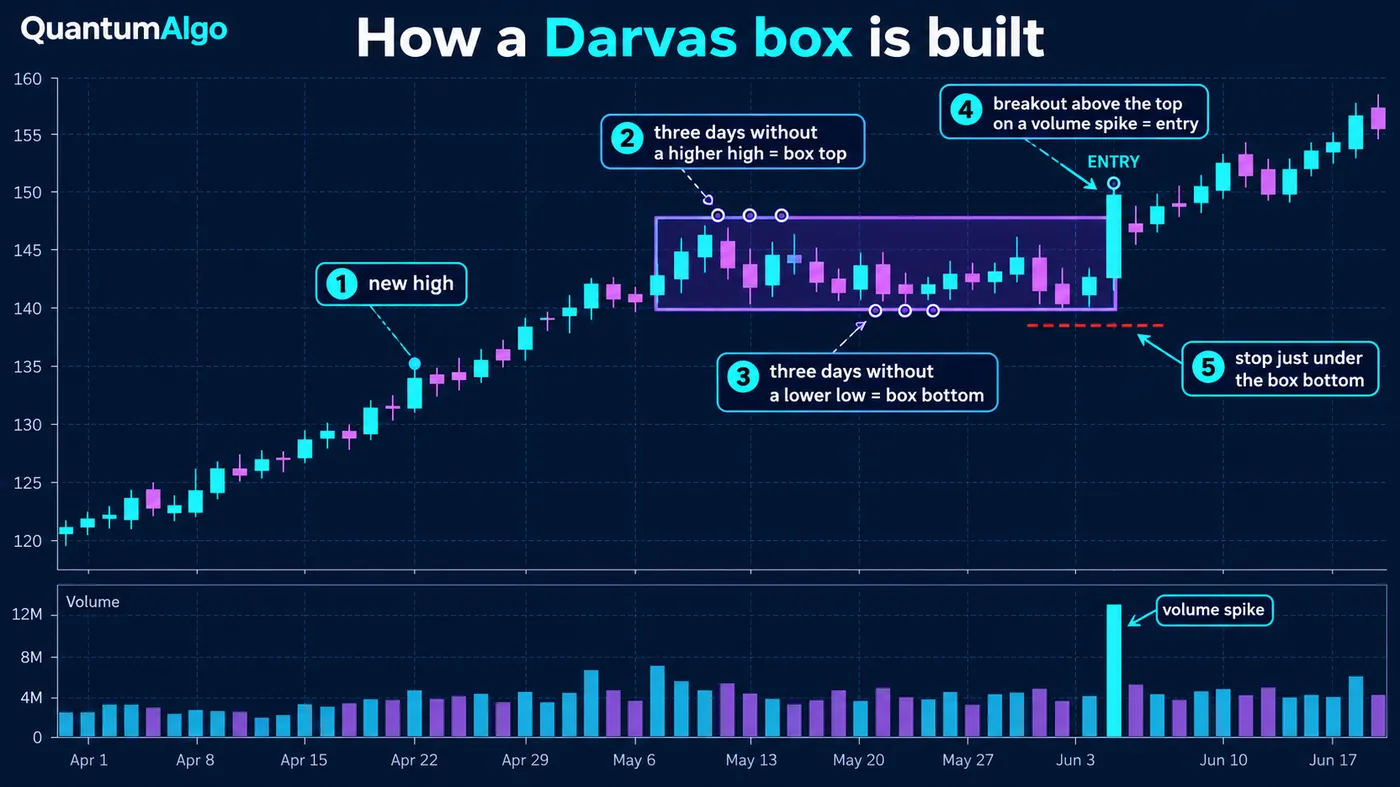
Darvas described his boxes in words rather than formulas, so charting tools use a mechanical version. The common one, used by most Darvas indicators, is the three-day rule:
- Find a new high. The stock makes a high above everything before it — ideally a new 52-week high.
- Confirm the top. If the next three days all fail to exceed that high, it becomes the box top.
- Find the low after the top. Track the lowest low the stock makes after the top is set.
- Confirm the bottom. If the next three days all hold above that low, it becomes the box bottom. The box is now complete.
- Wait inside. While price stays between top and bottom, do nothing. Fluctuations inside the box are noise.
- Buy the breakout. A move above the top — ideally a close, on volume clearly above average — is the entry.
- Place the stop. Just under the box bottom. If price falls back through it, the breakout has failed.
Two refinements matter in practice. If price drops below the box bottom before it breaks out, the box is broken down and the stock is discarded until it builds a new base. And if the stock makes a fresh high before the bottom is confirmed, the count restarts: the box was never complete.
How do Darvas boxes trail the stop in a trend?
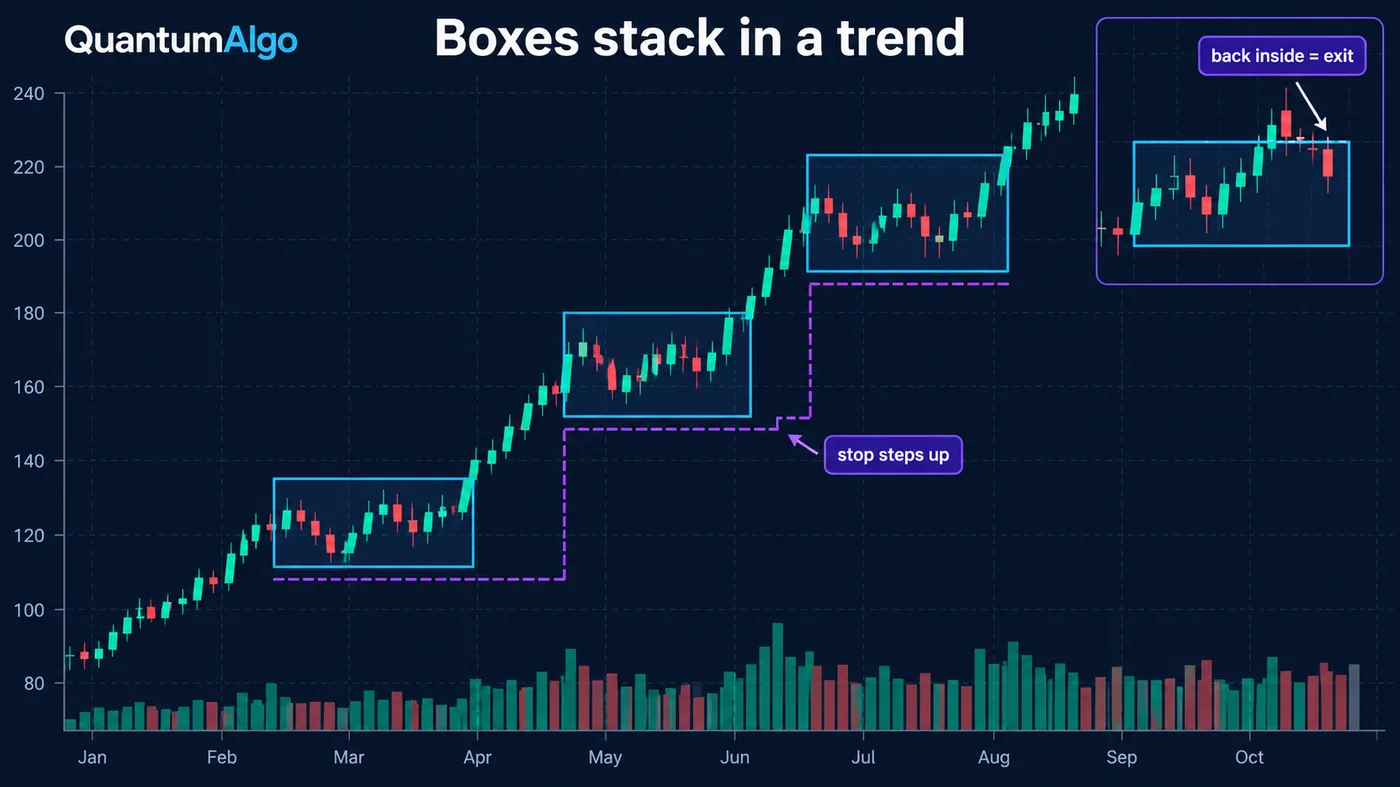
The method earns its money in the second and third boxes. After the breakout the stock builds a new box higher up, and the stop moves to the bottom of that new box; then the next, and the next. The position is never closed at a target. It is closed when price falls through the bottom of the latest box, which is the market saying the trend's structure has broken. This is the same logic as a structure-based trailing stop: the stop follows the higher lows the trend creates rather than a fixed distance.
It also means most trades are small losses. A breakout that fails falls back into the box and hits a stop placed a few per cent away. The winners are the few stocks that keep stacking boxes for months. That distribution — many small losses, a few large wins — is typical of trend-following, and it is why position sizing from the box height matters more than the win rate.

Automate your trades. Let Quantum Algo trade for you.
Every signal executed on your own account — on your account, with the plan you define.
What was Darvas's techno-fundamental filter?

Darvas did not box every stock that made a new high. He called himself a "techno-fundamentalist": the chart chose the moment, but he only traded stocks in growing industries whose earnings were rising, and he paid close attention to volume as evidence that serious buyers were involved. A box breakout in a company with shrinking earnings was, to him, a trap.
A modern version of the filter is easy to build: stocks at or near 52-week highs, outperforming their index, with rising earnings and revenue, in a sector that is itself trending. The stock-finding guide covers screening, and the best indicator for stocks covers the relative-strength and volume tools that do this job on TradingView.
How does the Darvas box compare with similar patterns?
| Pattern | What it shares with the Darvas box | How it differs |
|---|---|---|
| Rectangle pattern | Horizontal top and bottom; breakout trade | Can form anywhere; Darvas boxes are drawn only in stocks making new highs |
| Cup and handle | A pause before a breakout to new highs | Rounded base and a handle; longer to form |
| Flag | A short pause in a trend | Slopes against the trend; usually shorter than a box |
| Donchian channel breakout | Buys a breakout of a recent high | Fixed lookback window rather than confirmed top and bottom |
| Opening range breakout | A box and a breakout | Intraday, built from the first minutes of one session |
The closest relatives on the site are the cup and handle and the Donchian channel, whose breakout system is the other classic trend-follower's rule.
Darvas box builder
Paste the last few weeks of daily highs and lows, oldest first. The builder finds the latest box with the three-day rule, tells you whether price is inside it, has broken out or has broken down, and returns the entry trigger, the stop under the bottom, the position size for your risk and the first measured objective.
Reference data
| Item | Value |
|---|---|
| Developed by | Nicolas Darvas (1920–1977), dancer and self-taught investor |
| Book | How I Made $2,000,000 in the Stock Market (1960) |
| Market | Stocks in strong uptrends, ideally at 52-week highs |
| Box top (mechanical rule) | A new high not exceeded for three consecutive days |
| Box bottom (mechanical rule) | The low after the top, not broken for three consecutive days |
| Entry | Breakout above the box top on rising volume |
| Stop | Just under the box bottom; raised to each new box bottom |
| Filter | Rising earnings, growing industry, strong volume (techno-fundamentalism) |
| On TradingView | Community "Darvas Box" scripts implement the three-day rule |
| Checked | October 2026 |
Worked example: a box breakout and the first trail
The figures are the builder's default data, rounded to show the method. A stock in a strong sector makes a new high at 52.00. The next three days print highs of 51.60, 51.20 and 51.80 — none above 52.00 — so 52.00 is the box top. After the top, the lowest low is 49.50; the three days that follow hold at 49.70, 50.10 and 50.40, so 49.50 is the box bottom. The box is 49.50 to 52.00, about 5% tall, and the stock spends the next week inside it.
The entry is a close above 52.00 on volume well above its 20-day average; the stop is just under the bottom at about 49.40. On a $25,000 account risking 1%, the risk is $250 and the risk per share is about 2.65, so the position is about 94 shares. The stock breaks out to 52.40, runs to 55.80 over two weeks, then pauses: highs fail to exceed 55.80 for three days, and the low after it, 54.10, holds for three. The new box is 54.10 to 55.80, and the stop moves up to just under 54.10 — the trade can no longer lose money. Three boxes later the stock finally falls through a box bottom at 61.30, and the position closes there. No target was ever set; the boxes decided both the entry and the exit.
What mistakes do traders make with the Darvas box?
- Drawing boxes on stocks that are not at new highs. The method is for leaders, not for bases at the lows.
- Buying an intraday poke above the top instead of a close, and getting caught by the reversal.
- Ignoring volume. A breakout on below-average volume is the one most likely to fall back into the box.
- Moving the stop down when a box bottom breaks "just a little". The bottom is the line.
- Taking profits at a fixed target and missing the stacked boxes where the method earns its keep.
- Skipping the fundamental filter and boxing every stock that prints a new high.
- Sizing from the account rather than from the box height. A tall box needs a smaller position.
How do Darvas boxes fit with structure and the free indicators?
A Darvas box is market structure drawn as a rectangle: the top is a swing high the stock cannot break, the bottom is the higher low it defends, and the breakout is a break of structure. The free library maps that directly on TradingView: the Smart Money Concepts Engine prints the break of structure as the box resolves, the Volatility Storm Tracker shows the volatility contraction inside the box that tends to precede a hard break, and the Institutional Volume Profile shows where volume built inside it. Zeno, the premium engine, prints buy and sell signals with a stop and targets, and a Zeno buy that coincides with a box breakout on volume is the kind of agreement Darvas looked for. The swing points guide covers the highs and lows the boxes are built from.
Draw boxes only on stocks making new highs, confirm the top and bottom with the three-day rule, buy the close above the top on volume, stop just under the bottom, and trail the stop up box by box. Filter for growing businesses, size from the box height, and accept many small losses for the few stocks that keep stacking boxes.
◆ Interactive check
Can you draw a Darvas box?
Questions traders ask about the Darvas box
A breakout method developed by Nicolas Darvas that draws a box around a rising stock's consolidation — the top it cannot pass and the low it holds — and buys when price breaks above the top, with a stop just below the bottom.
The common mechanical rule: a new high that is not exceeded for three consecutive days becomes the box top; the lowest low after that, if not broken for the next three days, becomes the box bottom.
Trade only strong stocks at or near new highs, wait for a complete box, buy the breakout above the top on rising volume, place the stop just under the bottom, and raise the stop to the bottom of each new box as the trend continues.
He said he made about $2.45 million in around 18 months of the late-1950s bull market. The New York Attorney General disputed the figure, and a court halted that investigation, so the exact number is contested. The rules can be tested on their own merits.
As a trend-following breakout method it behaves as it always has: many small losses from failed breakouts and a few large gains from stocks that keep making new boxes. It works best in strong markets and on leading stocks with rising earnings.
Darvas used daily prices. The rules can be applied to weekly charts for longer trends or to intraday charts, but the three-day confirmation was designed for daily bars.
The mechanics work on any trending market, and crypto trends suit them. The volume and earnings filters do not carry over, so stricter structure confirmation is needed.
Yes, several community scripts draw boxes with the three-day rule. Check whether a script confirms the box only after the three days, or it will redraw boxes in hindsight.
Both are horizontal ranges traded on a breakout. A Darvas box is drawn only in stocks making new highs and is defined by the three-day confirmation; a rectangle can form anywhere and is drawn from touches.
A box breakout is a break of structure, which the free Smart Money Concepts Engine prints on TradingView. Zeno prints buy and sell signals with a stop and targets; a Zeno buy on a box breakout with volume is the kind of agreement Darvas looked for.
References & Related Guides
Read next
- Rectangle Pattern
- Breakout Trading Strategy
- Cup and Handle Pattern
- Donchian Channels
- Trailing Stop Loss
- Position Sizing
- Best Indicator for Stocks
- How to Find Stocks for Day Trading
- Trend Trading Strategy
- Swing Points
- Smart Money Concepts Engine (free indicator)
- Zeno — the premium engine