What Is the Best Indicator for DAX (GER40)?
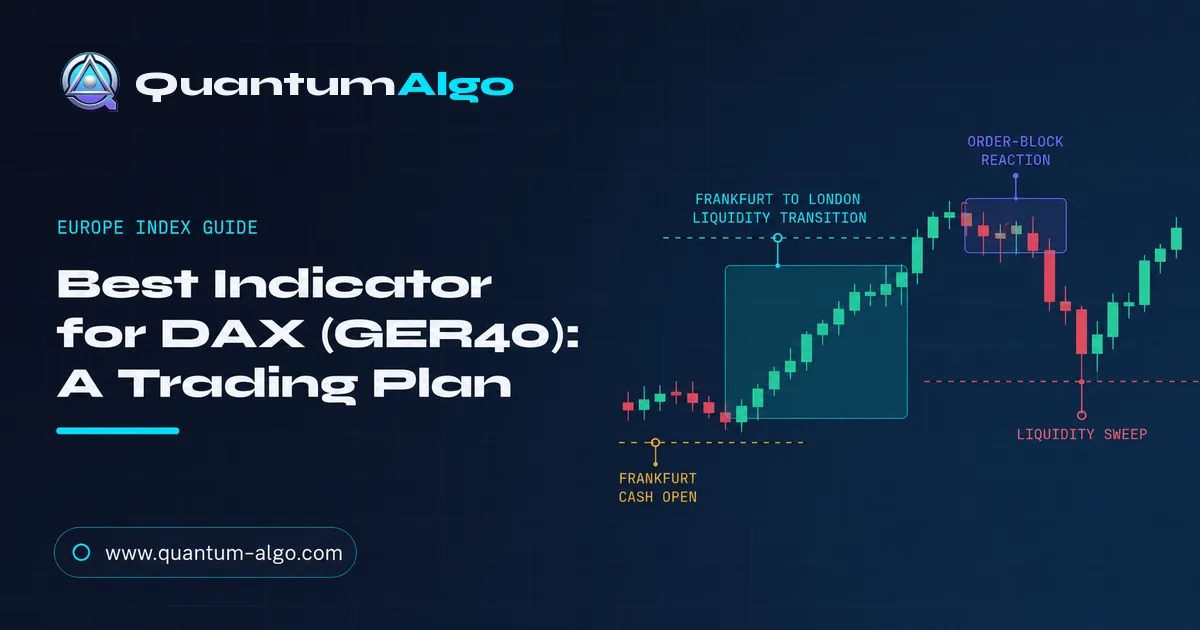
On a 15-minute DAX chart, the best indicator is rarely the one with the most arrows. GER40, DAX40, DE40 and the exchange-traded DAX futures all respond to the same practical problem: liquidity changes sharply as Frankfurt, London and New York participants arrive. Quantum Algo’s TradingView tools are useful here because they put Smart Money Concepts structure and risk in the same workflow. The edge is not a promise that an indicator can predict every index candle. It is a way to make the session, the invalidation and the trade size agree before you click.
The best indicator for DAX (GER40) is a session-aware structure tool with a volatility check, not a standalone RSI or MACD signal. Start with higher-timeframe bias, wait for the Frankfurt-to-London liquidity test, confirm displacement or reclaim, then size from the stop distance. Quantum Algo's free indicators mark order blocks and fair value gaps; Zeno adds confirmed Buy/Sell signals with SL/TP.
My working thesis for DAX is simple: treat the indicator as a filter for a session transition, not as a green-light machine. That changes the question from “Which line predicts the next candle?” to “Which conditions make this particular DAX move tradable?” The distinction matters most when the index looks clean on a chart and then runs both sides of a 40-point range before choosing direction.
Indicators that prove themselves in public.
One engine, four precision tools — the Gold (XAU) Scalper, the institutional Gravity Zone, the Zeno momentum Oscillator, and Zeno Stocks for equities.
Use this guide for GER40 CFDs, DAX futures and the TradingView symbols your broker supplies. The labels differ, the point values differ and the cash session may be represented differently, but the workflow is portable: mark the reference range, wait for the active handoff, define the invalidation, and only then compare a signal with your risk budget. For the market facts behind that map, Deutsche Börse’s Xetra schedule lists regular trading from 09:00 to 17:30 CET, while Eurex’s FDAX specification states €25 per index point and a one-point minimum change.
| Question | Useful answer |
|---|---|
| What drives the move? | Session participation, overnight liquidity and the response to the Frankfurt/London handoff. |
| What should the tool show? | Bias, displacement, swept highs/lows, location, invalidation and a repeatable signal rule. |
| Best working chart | 1H/4H context, 15m session structure, 5m refinement when spreads and volatility permit. |
| Risk anchor | Stop beyond the failed idea, with position size reduced when the DAX range expands. |
| Proof standard | Timestamped signals and a public ledger, not a handful of cherry-picked screenshots. |
What is the best indicator for DAX (GER40)?
For DAX, I would choose a Smart Money Concepts structure indicator with a separate volatility and risk layer. The structure component answers where price is interacting with liquidity: an overnight high, an equal low, an order block, or a fair value gap. The session component answers when that interaction matters. A volatility measure answers how far the stop needs to sit. A signal without those three questions is incomplete.
That is why “best” is a workflow decision rather than a product label. If an oscillator says DAX is overbought while London is driving a clean expansion, the oscillator is describing momentum after the fact. If a structure tool shows a sweep, a reclaim and a defined invalidation during an active window, it gives you a decision you can test. The second output is more useful even when it produces fewer trades.
Quantum Algo fits this workflow in two layers. The free public indicators mark SMC structures such as order blocks and FVGs. Zeno is the paid signal layer: confirmed Buy/Sell signals with stop-loss, take-profit and built-in risk management. Zeno does not draw the order blocks or FVGs, so keep the roles clear when you build a chart. If you want the underlying vocabulary first, the free liquidity concepts lesson is the right companion.
Why does DAX need a session-first indicator?
DAX is not just a number moving across a static chart. At the Frankfurt open, the market is repricing the overnight inventory. London brings deeper participation and often tests the levels built during that earlier range. The New York overlap can extend the move, take the opposite side of the range, or turn a European trend into a late-session reversal. The same 15-minute candle pattern means something different in each handoff.
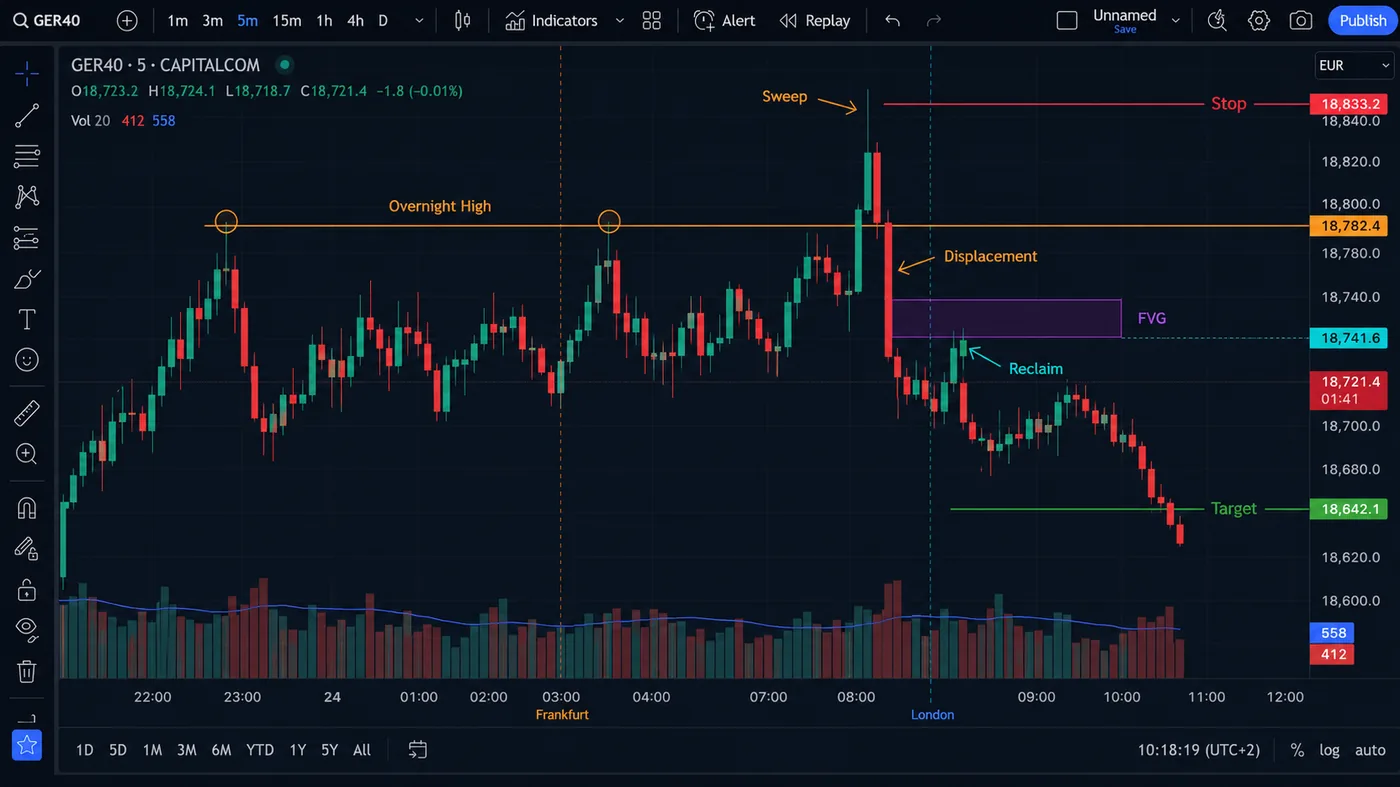
Draw the overnight high and low before searching for an entry. Then watch the first active expansion. A one-sided break that immediately closes back inside the range is information: the break may have collected stops rather than established direction. A break that displaces, holds above the level and leaves a clean imbalance deserves a different response. You do not need to predict which one happens. You need a rule for what you will do after the market shows you.
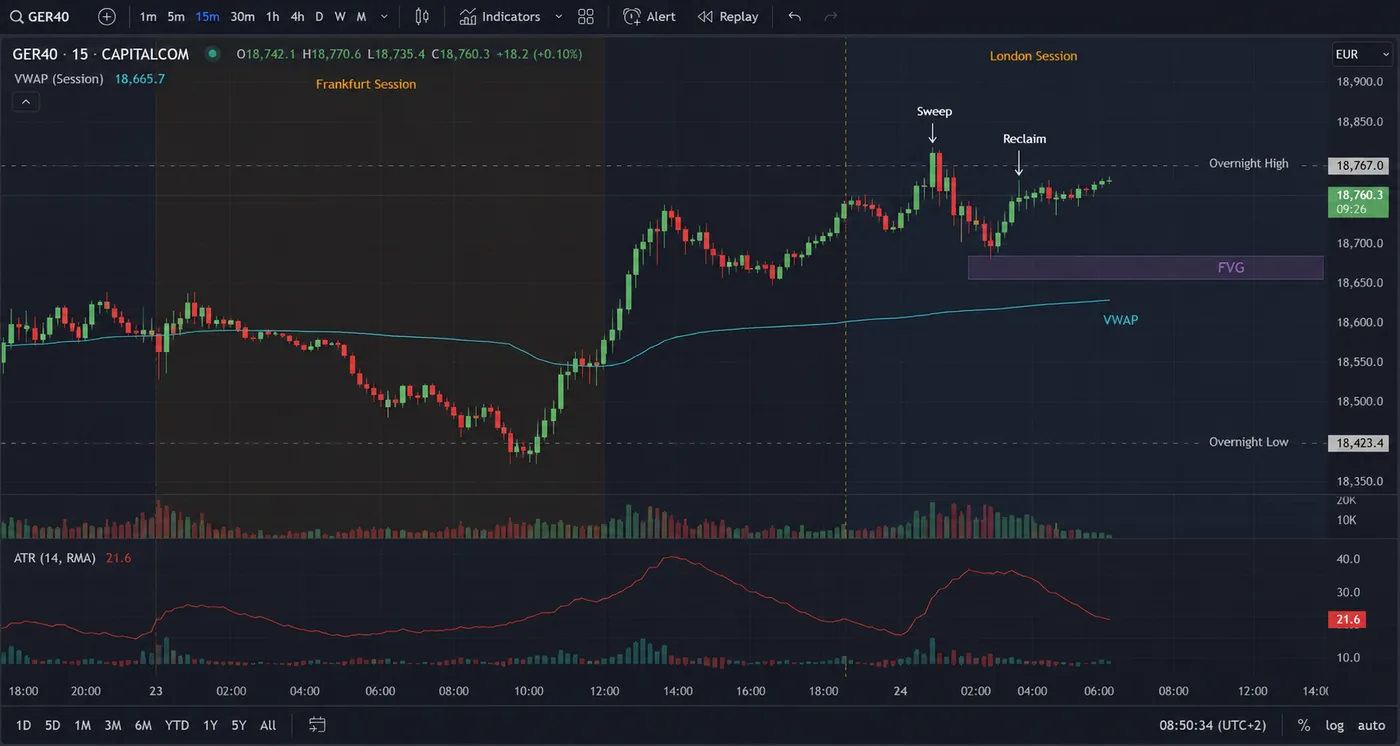
On a typical GER40 CFD chart, the most useful visual is not a stack of colored oscillators. It is a small map: prior-day high and low, overnight high and low, the current session window, and the first meaningful displacement. That map turns a noisy chart into a sequence. It also makes your review honest, because you can label the trade by the event that created it rather than by the indicator that happened to flash.
The map is deliberately small: if the range is still forming and no handoff has occurred, a perfect-looking RSI divergence is still a low-information observation.
Which indicators help on GER40?
Classic tools can help when each has one job. VWAP can show whether price is accepting above or below an intraday average. ATR can prevent a 20-point stop from being placed inside a 60-point normal swing. A volume or order-flow view can show participation if your data feed supports it. Structure tools can mark the levels where the auction previously displaced. Problems begin when every tool is treated as a separate vote.
| Tool | Good question | Common misuse |
|---|---|---|
| VWAP | Where is price trading relative to the session’s average? | Shorting every touch while the index is trending away from value. |
| ATR | Is the stop and target realistic for current movement? | Using ATR as a direction signal. |
| RSI / MACD | Is momentum stretched or changing? | Calling “overbought” a reversal without a liquidity event. |
| Free SMC indicators | Where are order blocks, FVGs and structure events? | Taking every marked zone without session or risk context. |
| Zeno signals | Is there a confirmed Buy/Sell plan with SL/TP and risk rules? | Assuming a signal removes the need to verify the symbol and size. |
The combination is asymmetric: let structure and time decide whether a trade exists, volatility set the stop context, and a signal layer make execution repeatable. If five indicators disagree, your process has no hierarchy.
For the reference tools themselves, compare the VWAP guide with the ATR guide; they answer different questions. TradingView defines VWAP as a volume-weighted average price used for intraday direction, not a standalone DAX entry trigger.
How do you combine structure, time and risk?
Start on the 4-hour or 1-hour chart. Is DAX making higher highs and higher lows, or are rallies returning into a lower-timeframe supply area? Mark the prior-day extremes and the overnight range. On 15 minutes, wait for price to interact with one of those references during an active session. Then look for the smallest piece of evidence that invalidates the first move: a close back through the level, a displacement candle, or a break-and-retest that holds.
Only after that sequence do I care about entry price. A long belongs near the reclaim or retracement into the displacement leg; a short belongs near the failed high or bearish retracement. The setup is the relationship between location and invalidation. For the broader pattern vocabulary, use the liquidity sweep guide and order blocks guide.
Keep risk fixed in account terms. If you normally risk 0.5% or 1% per trade, the DAX does not get a larger allocation because the candle looks exciting. A wider stop means a smaller position. The market decides the stop distance; your risk rule decides the size. This is where an indicator becomes useful in practice: its output should make it easier to take the same decision when the chart is moving fast.
The sequence shown above is a reclaim setup, not an instruction to trade every sweep. If the sweep closes outside the range and keeps accepting there, the failed-break thesis is wrong. A no-trade outcome is a valid result. Your journal should record it as such; otherwise you only learn from the trades that survived your hindsight filter.
What does a DAX trade setup look like?
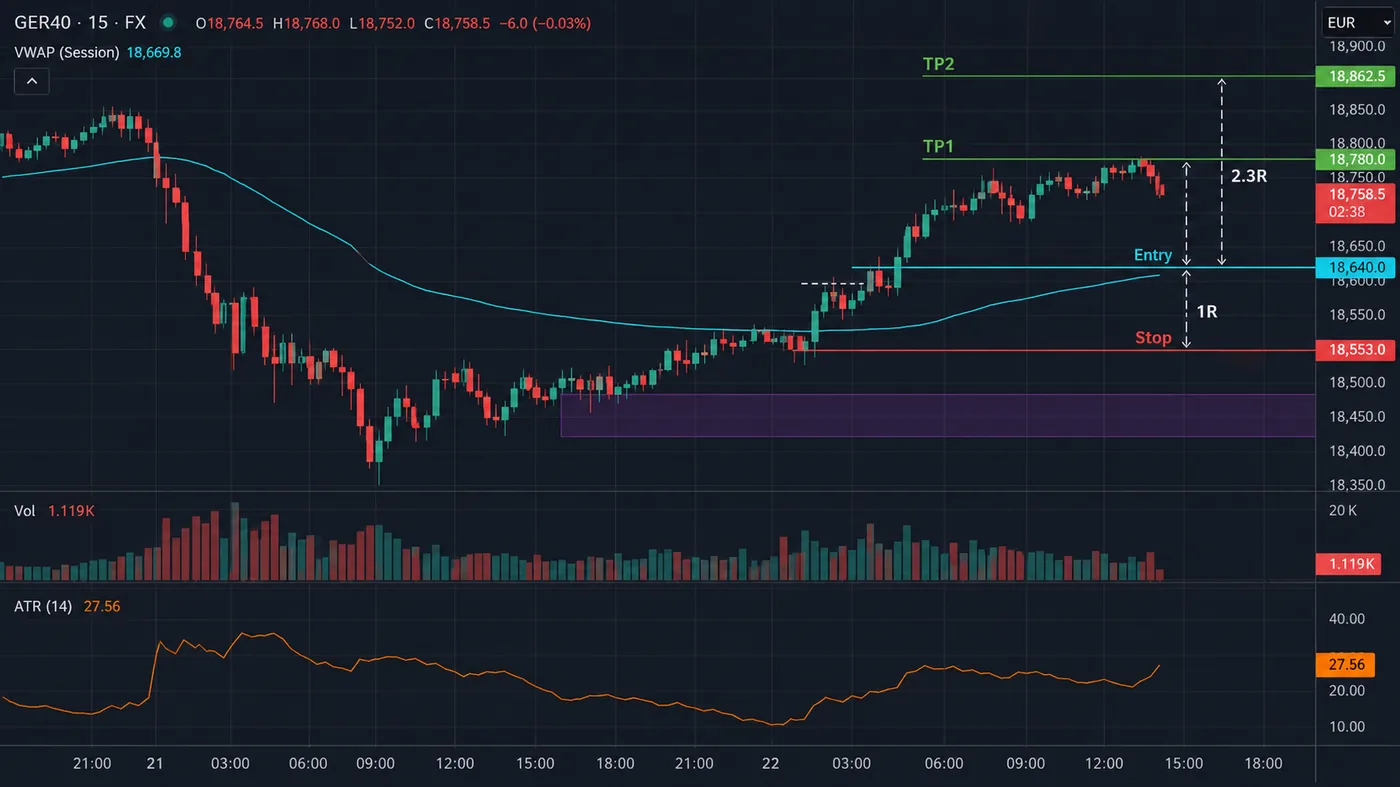
Here is an illustrative 15-minute GER40 example. It is a worked model, not a live call. Suppose the higher-timeframe bias is bullish. During the Frankfurt-to-London transition, price pushes below the overnight low, then closes back above it with a wide bullish candle. The reclaim leaves a small fair value gap below the close. A trader waits for a retracement instead of buying the spike.
The entry is conditional: if price returns to the reclaim zone and holds, the order is valid. The stop is below the swept low and the structure that made the long idea logical. The target is at a prior liquidity reference rather than an arbitrary number. If the index trades 40 points against the entry and closes back below the reclaimed level, the thesis is invalidated. The loss is planned before the order exists.
Suppose the account is $10,000 and the risk budget is 1%, or $100. If one GER40 contract is worth $1 per point on your feed, the 40-point stop allows 2.5 units: $100 ÷ (40 × $1). If your broker only permits whole contracts, round down and accept less than the maximum risk. If the point value is $10, the same setup is 0.25 contracts. The number on the chart is not enough; the contract specification is part of the trade.
This example also shows why “best indicator” lists can mislead. An entry arrow at 18,470 after the impulse looks accurate on a screenshot, but the trader who entered there has a different stop, a different R multiple and a different emotional experience. A good page or platform should expose the plan, not only the winning mark.
Which timeframe is best for DAX?
Use the timeframe that matches the decision you are making. The 4-hour and 1-hour charts are for bias and major reference points. The 15-minute chart is the practical workhorse for the session transition: it shows enough detail to see the range and the displacement without turning every wick into a story. The 5-minute chart can refine the entry after the 15-minute condition is already present.
I would not start on 1-minute GER40. The chart will give you more candles, but not more information. Spread, execution delay and the index’s fast bursts can make a small fluctuation look like a new structure shift. If you later use a 1-minute entry, compare it against the 15-minute plan and keep the stop anchored to the real invalidation rather than to the latest tiny swing.
Timeframes should agree on the question, not on the color. A 1-hour bullish bias can coexist with a 5-minute selloff into a demand area. That selloff is either the entry path for the higher-timeframe idea or a warning that the bias is wrong; the session event and the level decide. The indicator is there to make that relationship visible, not to produce three independent signals.
How can you size a DAX position?
Use the calculator below as a quick check. It estimates position size from account equity, risk percentage, stop distance and the cash value of one point on your contract. It is intentionally simple: fees, slippage, currency conversion and broker minimums still need to be checked.
Before using any calculator, open your broker’s contract details. “GER40” is a label shared by many CFD feeds, while FDAX and FDXM futures have their own multipliers and tick rules. The Academy position-sizing lesson shows the same risk-first logic. The right process is simple: calculate, round down to what the broker allows, then record the planned dollar risk.
The expectancy chart is a useful antidote to win-rate obsession. At a 2.3:1 planned reward-to-risk, even a lower win rate can be positive before costs; at a lower payoff, a high win rate can still be fragile. Quantum Algo’s public ledger reports 75% across 160 closed signals, with 120 wins and 40 losses. Verify the record and understand the sample; do not convert it into an expected DAX result. For EU retail CFD context, ESMA’s published CFD framework lists 20:1 for major indices, but current broker and regulator terms still need checking.
Can a trading bot execute DAX signals?
Automation solves an execution problem, not a market-understanding problem. If your rule is “take every signal on every GER40 feed,” a bot can make that mistake faster. If your rule includes the correct symbol, session, maximum risk and connection status, automation can remove hesitation and manual copy errors.
QuantumBot is Quantum Algo’s automated execution service. It trades the signals for the user where a supported connection is available, while the signal plan supplies the entry, stop-loss and take-profit logic. Keep the responsibilities separate: the platform generates the signal, QuantumBot executes it, and you verify the broker, contract and risk settings. The service is $199/mo; cancel anytime. If you prefer signal-assisted execution, compare Zeno AI Agent with the current plan options.
The best indicator for DAX is a session-first decision system. Mark the overnight range, wait for the Frankfurt-to-London test, require structure confirmation, place the stop beyond invalidation and size from the cash risk. Use classic indicators as context, not as competing vote counters. If you automate, automate a verified plan rather than a naked arrow.
◆ Interactive check
Can you build the DAX plan?
Questions traders ask about DAX indicators
There is no single magic oscillator for the DAX. The most useful approach is a session-aware structure tool that shows directional bias, displacement, liquidity sweeps and a defined stop-and-target plan; a volatility measure such as ATR can then keep the stop realistic.
VWAP is useful as an intraday location reference, especially during the Frankfurt-to-London transition and the New York overlap. It is not a complete entry system because it does not tell you which liquidity was taken or where invalidation belongs.
The key windows are the Xetra/Frankfurt open at 09:00 CET, the London arrival from 09:00–11:00 CET, and the US overlap from 15:30–17:30 CET. These are CET reference times; daylight-saving changes can shift the displayed hour on your broker feed, so check the chart timezone before planning a session.
Use a 1-hour or 4-hour chart for directional context, a 15-minute chart for the session structure, and a 5-minute chart only to refine an already qualified setup. Dropping straight to a 1-minute chart usually magnifies spread, noise and emotional decisions.
RSI can describe momentum, but “overbought” does not mean “ready to short” during a strong index trend. Use it as secondary context if it helps you, never as the reason to fade a clean displacement move.
The right stop is beyond the price level that invalidates the idea, not a fixed number of points. On a 15-minute setup that may be 30–80 points depending on volatility; calculate the position size from that distance and your fixed account risk.
The free public Quantum Algo indicators mark Smart Money Concepts structures such as order blocks and fair value gaps. Zeno is the paid signal layer: it provides confirmed Buy/Sell signals with stop-loss, take-profit and built-in risk management; it does not draw those structures.
Quantum Algo is built for TradingView markets including indices, and GER40/DAX is a natural fit for a session-and-structure workflow. Test the symbol, exchange feed and contract specification used by your broker before committing capital.
QuantumBot is the automated execution service that trades the signals for you where your supported broker connection is available. It executes the signal plan; it does not replace position sizing, symbol selection or your responsibility to verify the connection.
Quantum Algo publishes a public ledger showing a 75% win rate across 160 closed signals, with 120 wins and 40 losses. That is a record to verify, not a promise for your DAX account; your results depend on execution, risk, market conditions and whether you follow the plan.
The logic transfers, but the contract does not. FDAX, FDXM, GER40 CFDs and broker-specific indices can have different point values, sessions, spreads and rollover behavior, so translate the stop distance into the exact money value on your instrument before trading.
References & Related Guides
Read next
- Best CFD Trading Platforms With Charting: Ranked for Chart-Driven Traders
- Best Indicator for Nasdaq: Complete Guide
- Best Indicators for Futures Trading
- Best TradingView Indicators Complete Guide
- VWAP Indicator: Complete Trading Guide
- ATR (Average True Range): Complete Guide
- Liquidity Sweep Trading Guide
- Order Blocks Trading Guide
- Smart Money Concepts Guide
Authoritative sources
- Deutsche Börse: Xetra trading hours
- Eurex: FDAX contract specifications
- ESMA: permanent CFD product-intervention page
- TradingView: VWAP definition