The Best Indicator for Options Trading: Volatility, IV Rank & Institutional Order Flow
What is the best indicator for options trading?
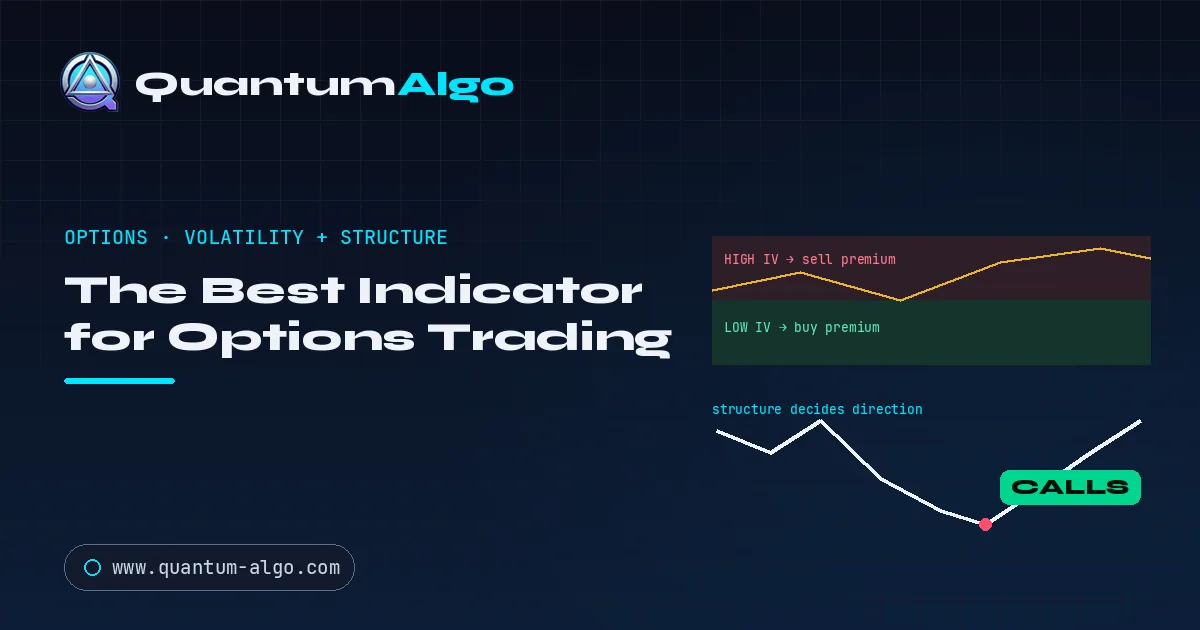
The best indicator for options trading reads two things at once: implied volatility (IV Rank or IV Percentile) to decide how to trade, and order-flow structure on the underlying to decide direction. High IV Rank favors selling premium; low IV Rank favors buying it. RSI and MACD only guess direction and ignore volatility, which is why they fail on options.
The best indicator for options trading is one that reads two things at once: implied volatility to decide how to trade, and order-flow structure to decide direction. Momentum tools like RSI and MACD only guess direction and ignore volatility entirely, which is why they fail on options. The volatility read (IV Rank, IV Percentile) tells you whether to buy premium or sell it; a Smart Money Concepts engine like Quantum Algo reads the institutional order flow on the underlying so your calls and puts point the right way — with non-repainting entries and a 75% directional win rate.
Indicators that prove themselves in public.
One engine, four precision tools — the Gold (XAU) Scalper, the institutional Gravity Zone, the Zeno momentum Oscillator, and Zeno Stocks for equities.
Options are the market where the "best stock indicator" advice quietly breaks. A call can lose money while the stock goes up, because an option's price is driven by three forces at once — direction, implied volatility, and time decay — and a single-line momentum indicator only ever addresses the first, and badly. This guide explains what actually makes an indicator work for options, why the classic tools mislead you, and how to combine a volatility read with order-flow structure into a repeatable call/put decision.
| The core problem | Option price depends on direction, implied volatility and time decay — not price alone |
| Volatility read | IV Rank / IV Percentile decides whether to buy or sell premium |
| Direction read | Smart Money Concepts order flow on the underlying — order blocks, FVGs, liquidity |
| Best for | Options on liquid stocks, ETFs and indices via TradingView analysis of the underlying |
| Signals | Non-repainting Buy / Sell on the underlying with exact entry, stop and two targets |
| Proof | Public, timestamped directional record — 75% win rate over 160 closed signals |
Why do options need two indicators instead of one?
Every option trade is really two decisions stacked on top of each other. How to trade it is a volatility question: when implied volatility is high, options are expensive and you lean toward selling premium (credit spreads, iron condors); when it's low, options are cheap and buying premium (long calls or puts) has better odds. Which way to trade it is a direction question about the underlying. A stock indicator that only answers direction leaves you buying overpriced calls into an IV crush after earnings, or selling premium right before a volatility expansion. The two readings are independent, and you need both.
How do IV Rank and IV Percentile guide an options trade?
The single most important number in options that stock traders never look at is implied volatility rank — where current IV sits relative to its own past year. High IV Rank means the options market is pricing in big moves and premium is rich; that favors defined-risk premium-selling strategies. Low IV Rank means options are cheap relative to their history, which favors buying premium for a directional move. Around scheduled events — earnings, product launches, Fed decisions — IV inflates and then collapses the moment the news is out (the "IV crush"), which is why a directionally correct long call can still lose. No price-based oscillator sees any of this; it's a separate data layer you read first, before you ever pick a direction.
Why does structure beat RSI and MACD for options direction?
Once volatility tells you how to trade, you still need direction — and this is where the standard options indicators fall apart. RSI and MACD are lagging momentum reads of past price; they flip late, whipsaw in chop, and have no idea where institutional orders sit. On an option, "late" is fatal because time decay is bleeding your premium every day you wait for confirmation. What actually moves the underlying is order flow — the order blocks and Fair Value Gaps institutions leave, and the liquidity sweeps that precede real reversals. Reading that structure gets you positioned before the move, which is exactly what an option needs to beat theta.
| RSI / MACD | Quantum Algo (SMC) | |
|---|---|---|
| Reads | Past-price momentum | Live order flow & liquidity |
| Implied volatility | Ignored entirely | Read separately as IV Rank |
| Timing vs. theta | Late — decay eats you | Positions before the move |
| Behaviour in chop | Whipsaws | Filtered by structure |
| Output | A line to interpret | Entry, stop, two targets |
| Direction confidence | Guess | Confirmed on the underlying |
How do you combine IV and structure into a call/put decision?
The workflow is simple once you separate the two layers. Step one, read volatility: check IV Rank on the underlying — high means favour premium-selling structures, low means favour buying premium. Step two, read direction: pull up the underlying on TradingView and let Quantum Algo mark the graded premium/discount zones, order blocks and the change of character that confirms a shift. When a non-repainting Buy prints in a discount zone, that's your bias for calls or bullish spreads; a Sell in premium is your bias for puts or bearish spreads. Step three, pick the structure that fits the volatility regime and defines your risk. The indicator's job is to make the direction call reliable; strategy selection and expiry are yours.
Do options on stocks, indices and ETFs trade differently?
The method scales across the options universe with small nuances. Index options (SPX, NDX) have the cleanest order flow and the deepest liquidity, so structure reads are the most reliable and IV behaves predictably around macro events. Liquid single-stock options work well but carry idiosyncratic earnings risk — IV Rank matters even more, and disciplined traders avoid holding long premium through the print. ETF options (SPY, QQQ, GLD) sit in between and are ideal for learning, with tight spreads and clean structure. Across all three, the discipline is identical: volatility read first, structure-confirmed direction second, defined risk always.
The public record
An options edge starts with being right on direction more often than not — and that's the part you can verify. Quantum Algo posts its public Zeno calls on the underlying on TradingView with a timestamp before the outcome, kept permanently — wins, losses and breakevens, never edited. Across the full record: a 75% directional win rate over 160 closed signals, 2.3:1 planned risk-to-reward. On options you layer IV and expiry selection on top, but the directional foundation is documented, not claimed.
Treat the curve as the directional engine, not an options-returns promise — options add leverage in both directions, so position sizing and defined-risk structures are what keep a normal losing streak from becoming an account-ender. The edge is being on the right side of the underlying, consistently, with volatility working for you instead of against you.
Your options workflow
Read IV Rank on the underlying and decide buy-premium vs. sell-premium. Set direction from Quantum Algo's structure on the underlying, trading only with the higher-timeframe bias. Enter on the close-confirmed signal in a graded zone. Choose the structure (long option vs. spread) that matches the volatility regime and defines your max loss. Avoid holding long premium through earnings unless you're deliberately trading the event. Size for survival — a small, constant percent of the account per trade. Journal IV Rank, direction and outcome; over a few dozen trades you'll see which conditions are your edge.

Automate your trades. Let Quantum Algo trade for you.
Every signal executed on your own account — 24/7, hands-off.
Frequently Asked Questions
There isn't a single line that works — options need two reads. Implied volatility (IV Rank) decides whether to buy or sell premium, and an order-flow structure engine like Quantum Algo decides direction on the underlying. Momentum tools like RSI and MACD only guess direction and ignore volatility, which is why they fail on options.
Because they're lagging momentum reads of past price and address only direction, badly. Options also depend on implied volatility and time decay, which those tools ignore entirely, and their late signals let theta bleed your premium while you wait for confirmation.
IV Rank shows where implied volatility sits relative to its own past year. High IV Rank means options are expensive and premium-selling is favoured; low IV Rank means options are cheap and buying premium is favoured. It decides how you trade before you pick a direction — a directionally correct call can still lose to an IV crush.
A sharp drop in implied volatility right after a scheduled event like earnings. IV inflates before the event and collapses once the news is known, so a long option can lose value even if the stock moves your way. It's the main reason traders avoid holding long premium through earnings.
Yes — you apply it to the underlying stock, ETF or index to get a non-repainting directional signal with exact entry, stop and two targets. You then read IV Rank separately and choose an options structure (long option or spread) that fits the volatility regime and defines your risk.
It depends on implied volatility. When IV Rank is high, options are expensive and defined-risk premium-selling (credit spreads, iron condors) has better odds; when IV Rank is low, buying premium (long calls or puts) for a directional move is favoured. Direction comes from structure; the buy-vs-sell decision comes from IV.
No. Every signal on the underlying is confirmed on candle close and never changes retroactively, so you can backtest directional entries honestly and trust a live signal — which matters on options, where a late or repainted read costs you to time decay.
Index options (SPX, NDX) have the cleanest structure and deepest liquidity; liquid ETF options (SPY, QQQ, GLD) are ideal for learning with tight spreads; liquid single-stock options work but carry earnings/IV risk. The structure-plus-volatility discipline is the same across all three.
No indicator predicts an earnings gap, and IV crush punishes long premium held through the print. Most disciplined traders avoid holding long options through earnings and instead trade the structure that forms afterward, once IV normalises and a new range establishes.
The public record shows a 75% directional win rate over 160 closed signals on the underlying at a 2.3:1 planned risk-to-reward. On options you add IV and expiry selection on top, so your options P&L depends on those choices — but the directional foundation is verifiable, not claimed.
Matrix is $19/month for core signals, Atlas $39/month for the full SMC toolkit with filtering and backtesting, and Zeno $79/month for professionals with exact trade plans and the premium suite. Annual billing saves 25%, and every plan includes the public track record.
References & Related Guides
More in this topic
- Day Trading Options: Can You, Should You, and How the Ones Who Survive Do It
- Options Trading for Beginners: How Options Work, Calls vs Puts, and How to Start Without Getting Hurt
- Unusual Whales Review: Options Flow, Dark Pools and Congress Trades — What the Data Can and Can't Tell You
- ADX Indicator: Complete Trading Guide
- AlphaTrend Indicator: Complete Trading Guide
- ATR (Average True Range): Complete Trading Guide
- Awesome Oscillator: Complete Indicator Guide
- What Are the Best Volume Indicators?
- Bollinger Bands — Complete Trading Indicator Guide
- CCI Indicator: Complete Guide
- Chandelier Exit: Complete Trading Guide
- Donchian Channels: Complete Indicator Guide
- Fibonacci Bollinger Bands: Complete Trading Guide
- Fibonacci Retracement — Complete Trading Guide
- Hull Moving Average (HMA): Complete Trading Guide
- Gaussian Channel Indicator Guide
- Best Buy/Sell Indicator Guide
Core reading
- BOS & CHoCH: Complete Market Structure Guide
- Order Blocks Trading: Complete Guide
- Best TradingView Indicators — Complete Guide
- Risk Management in Trading — Complete Guide
- Candlestick Patterns Guide — Engulfing, Pinbar & More
- All Premium Guides
- Quantum Algo on TradingView
- Public Track Record