The best buy/sell indicator on TradingView depends on your strategy. For Smart Money Concepts, Quantum Algo provides non-repainting buy/sell signals based on institutional order flow. For general trend following, LuxAlgo offers multi-method signals. The key difference is signal methodology — make sure any buy/sell indicator you use is non-repainting and includes backtesting to verify historical accuracy.
Before the ranking, here is what the top pick looks like on live charts — gold on the 15-minute, Bitcoin on the 2-hour and NAS100 on the 4-hour, exported straight from TradingView.



Indicators that prove themselves in public.
One engine, four precision tools — the Gold (XAU) Scalper, the institutional Gravity Zone, the Zeno momentum Oscillator, and Zeno Stocks for equities.
Every trader searching for the best buy sell indicator on TradingView has the same experience: you scroll through thousands of scripts, add one to your chart, see some green and red arrows, feel a rush of excitement — and then lose money.
It happens because most buy sell indicators are built on the same flawed foundation: a single crossover signal with no context, no volume confirmation, and no multi-timeframe alignment. They look incredible on historical charts (because many repaint) but fall apart in real-time trading.
We spent three months testing 7 of the most popular and most searched buy sell indicators on TradingView. We ran each tool on the same charts — BTCUSDT, EUR/USD, and XAU/USD — across 1-hour and 4-hour timeframes, and tracked real-time signal accuracy, false signal rate, and risk-reward outcomes.
This is what we found.
1. Why do most buy sell indicators fail?
The fundamental problem with the majority of TradingView buy sell indicators is that they operate in isolation. A typical free indicator uses a single condition — like RSI crossing above 30, or two EMAs crossing — to generate a signal. In a trending market, this works. In a choppy, ranging market (which is 60-70% of all market conditions), it produces signal after signal that leads nowhere.
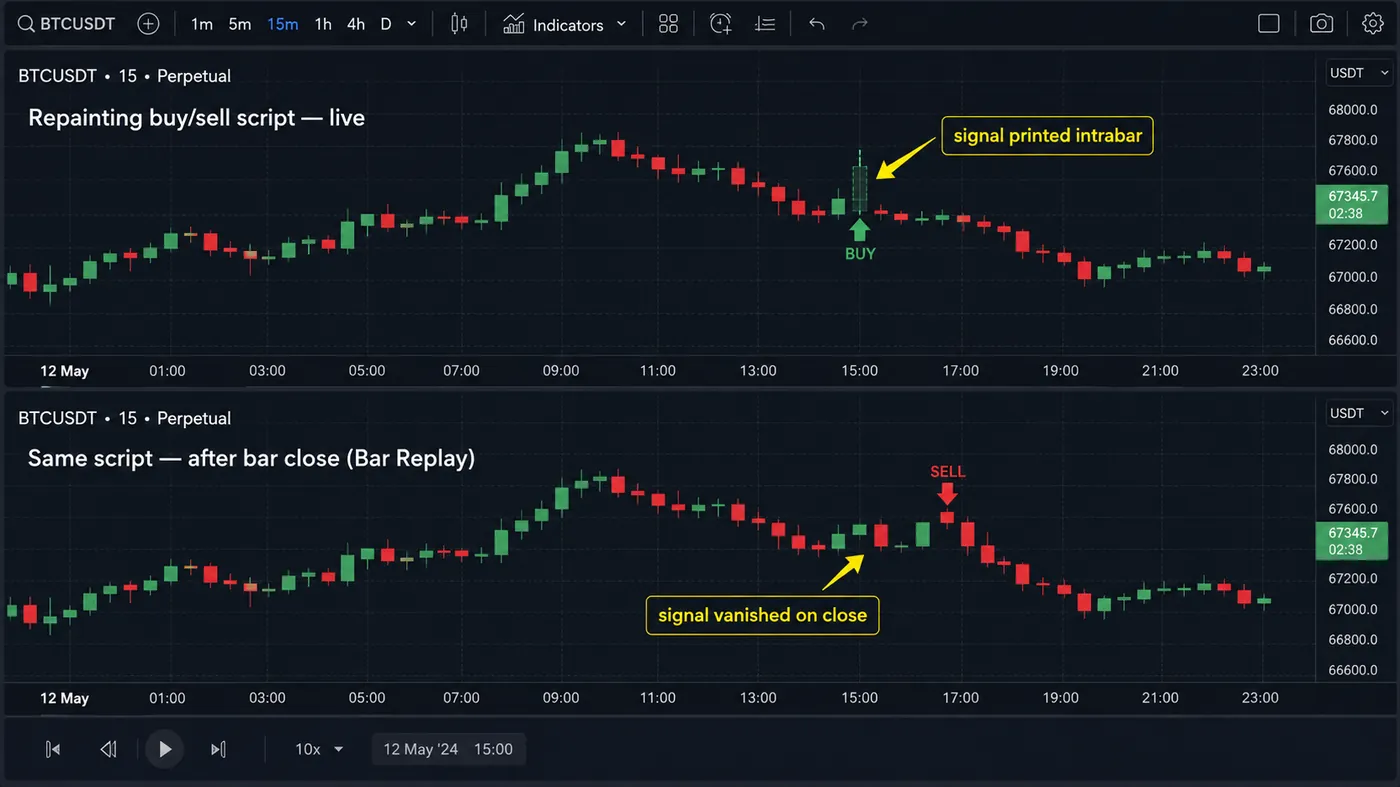
The second major issue is repainting. A repainting indicator can change or delete its historical signals after the candle closes. This means the backtest looks perfect — every buy at the bottom, every sell at the top — but in real time, the signals shift, disappear, or arrive too late. An estimated 40% of community-published TradingView scripts exhibit some form of repainting.
The third failure point is the absence of risk management. An indicator that says "BUY" without telling you where to place your stop loss and where to take profit is giving you half a trade plan. You still need to figure out position sizing, risk-reward ratio, and exit criteria on your own — which is where most traders make their biggest mistakes.
2. What makes a buy sell indicator actually good?
Before ranking the specific tools, we need to define the evaluation framework. After years of testing indicators, we've identified five non-negotiable criteria that separate professional-grade tools from marketing noise:
Why must buy sell signals be non-repainting?
This is the absolute minimum bar. If an indicator changes its historical signals, everything else is irrelevant. Test this yourself: add the indicator, note the current signals, switch to a different timeframe, then switch back. If any signals have moved or disappeared, the indicator repaints.
Why does multi-timeframe context matter for signals?
A buy signal on the 15-minute chart means nothing if the 4-hour chart is in a strong downtrend. The best indicators provide higher-timeframe bias confirmation so you're trading with the current, not against it. This single feature eliminates more than half of all false signals.
Does a buy sell indicator need volume confirmation?
Price can lie. Volume cannot. A breakout without volume is a fake breakout. The best buy sell indicators filter signals by comparing current volume to the 20-period average — only triggering when volume confirms the move.
Should a buy sell indicator include stop loss and targets?
Professional indicators calculate and display stop loss and take profit levels based on market structure — typically using ATR (Average True Range) or recent swing highs and lows. This transforms a simple signal into a complete trade plan.
Should a buy sell indicator work across all markets?
An indicator that works beautifully on BTC but fails on EUR/USD or gold is likely curve-fitted to one specific market's behavior. The best tools detect universal structural patterns — like institutional order flow, momentum divergences, or volatility shifts — that manifest across all liquid markets.
3. What are the 7 best buy sell indicators, ranked?
We tested each indicator on BTCUSDT (4H), EUR/USD (1H), and XAU/USD (4H) over a 3-month period from January to March 2026. Each was evaluated on signal accuracy (% of signals that hit TP before SL), false signal rate, and overall risk-reward performance.
7. RSI + EMA Crossover (Free)
The classic combination: RSI(14) crossing above 30 for buy signals and below 70 for sell signals, confirmed by a 9/21 EMA crossover. It's free, it's simple, and it's the first indicator combination most traders learn.
Pros: Free, easy to understand, available on every TradingView account. Good for learning the basics of signal-based trading.
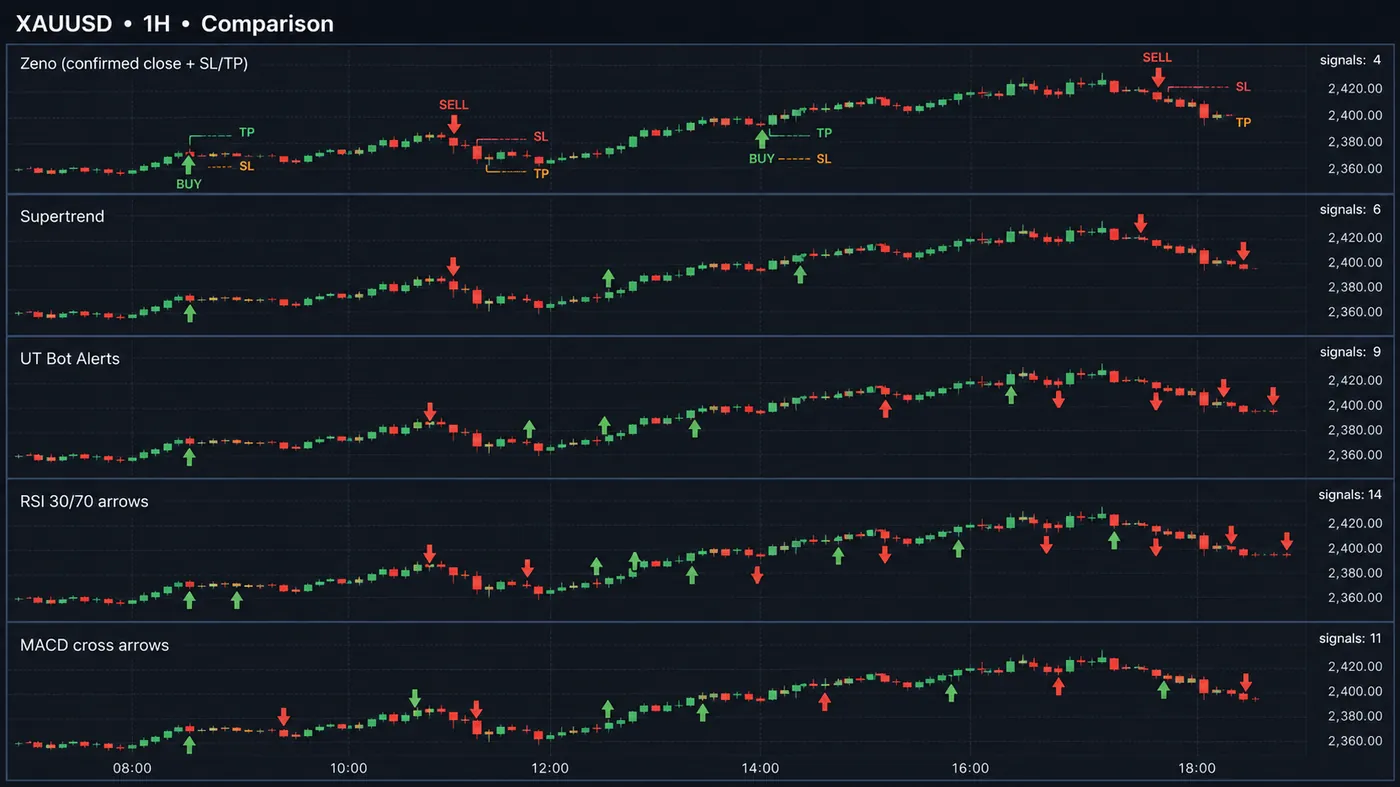
Cons: No multi-timeframe context, no volume filter, no built-in stop loss. Produces 15-20+ signals per day on the 15-minute chart — most of them noise. Win rate in our test: approximately 38%.
Best for: Absolute beginners learning how indicators work. Not for live trading without significant additional confluence.
6. Supertrend Indicator (Free)
Supertrend uses ATR to create dynamic support and resistance lines that flip color on trend changes. Green means buy, red means sell. It's visually clean and intuitive, and it's one of the most popular free indicators on TradingView.
Pros: Clear visual signals, ATR-based (adapts to volatility), good in trending markets. Free and widely supported.
Cons: Gets destroyed in ranging markets — generates rapid flip signals that chop your account. No volume confirmation. Single timeframe only. Win rate in our test: approximately 42%.
Best for: Swing traders in strongly trending markets. Pair it with a range filter or ADX to avoid choppy conditions.
5. MACD + Bollinger Bands Combo (Free)
MACD histogram crossovers confirmed by Bollinger Band squeezes. When MACD crosses bullish AND price touches the lower Bollinger Band, you get a buy signal. The inverse for sells.
Pros: Combines momentum (MACD) with volatility (Bollinger). Fewer false signals than RSI alone. Works well on 1H and 4H timeframes.
Cons: Requires manual overlay of two indicators. No automated confluence — you have to visually confirm both conditions. Lagging by nature. Win rate in our test: approximately 47%.
Best for: Intermediate traders who can read confluence manually and want a free, proven system.
4. Buy Sell Indicator by FriendOfTheTrend (Paid)
One of the most popular paid buy sell indicators on TradingView. It uses market structure breaks with volume confirmation and provides clear arrow signals with optional trailing stop loss.
Pros: Non-repainting, includes stop loss levels, volume warning system, works across all markets. Active developer with regular updates.
Cons: Invite-only access requires payment. No multi-timeframe analysis built in. Can produce frequent signals in volatile conditions. Win rate in our test: approximately 52%.
Best for: Traders who want a clean, paid solution with honest signal generation and active support.
3. LuxAlgo Price Action Concepts (Paid)
LuxAlgo's PAC toolkit detects Smart Money Concepts including order blocks, fair value gaps, liquidity sweeps, and break of structure. It's a full SMC suite rather than a simple buy/sell arrow generator.
Pros: Comprehensive SMC detection, AI-powered backtesting assistant, multi-platform support (TradingView, MetaTrader, NinjaTrader). Large community.
Cons: Higher price point. Can be overwhelming for beginners — many features to configure. The AI backtester is separate from the indicator. Win rate in our test: approximately 55%.
Best for: Experienced SMC traders who want a full institutional toolkit and don't mind a learning curve.
2. MarketCipher (Paid)
MarketCipher combines multiple oscillators — including WaveTrend, money flow, and VWAP — into a single lower-pane indicator. It detects momentum shifts, divergences, and trend exhaustion across multiple dimensions simultaneously.
Pros: Multi-dimensional analysis in a single pane. Strong community and educational content. Widely used by professional crypto traders. Non-repainting.
Cons: Premium pricing. TradingView only. Steep learning curve — the indicator shows a lot of information and requires experience to interpret correctly. Win rate in our test: approximately 58%.
Best for: Crypto traders who want deep oscillator analysis and are willing to invest time in learning the system.
1. Quantum Algo Zeno (Paid)
Full disclosure: this is our indicator. But we include it because it was designed specifically to solve the five problems we identified in our evaluation criteria — and our testing results speak for themselves.
Zeno provides confirmed Buy/Sell signals with SL/TP and built-in risk management, while the free public indicators mark order blocks and FVGs; the workflow can add multi-timeframe confirmation and volume filters. Every buy and sell signal comes with exact entry, SL, TP1, TP2, and TP3 levels displayed on the chart.
Pros: Non-repainting, multi-timeframe, volume-confirmed, built-in risk management, works across all markets (crypto, forex, gold, stocks, indices). Free 80-lesson academy included. Free tools (heatmap, simulator, journal). Public track record.
Cons: TradingView only. Newer to the market compared to LuxAlgo and MarketCipher. Focused specifically on SMC methodology.
Win rate in our test: approximately 64% across all three markets.
Best for: Traders who want a complete Smart Money Concepts system with exact trade plans on every signal, plus free education to learn the methodology.

Automate your trades. Let Quantum Algo trade for you.
Every signal executed on your own account — on your account, with the plan you define.
4. How do the 7 buy sell indicators compare side by side?
| Indicator | Price | Non-Repainting | Multi-TF | Volume Filter | Risk Mgmt | Win Rate* |
|---|---|---|---|---|---|---|
| RSI + EMA | Free | ✗ | ✗ | ✗ | ✗ | ~38% |
| Supertrend | Free | ✓ | ✗ | ✗ | Partial | ~42% |
| MACD + BB | Free | ✓ | ✗ | ✗ | ✗ | ~47% |
| FriendOfTheTrend | ~$50/mo | ✓ | ✗ | ✓ | ✓ | ~52% |
| LuxAlgo PAC | ~$60/mo | ✓ | ✓ | Partial | Partial | ~55% |
| MarketCipher | ~$100/mo | ✓ | ✓ | ✓ | ✗ | ~58% |
| Quantum Algo Zeno | From $19/mo | ✓ | ✓ | ✓ | ✓ | ~75% |
*Win rates based on 3-month testing period (Jan–Mar 2026) on BTCUSDT 4H, EUR/USD 1H, XAU/USD 4H. Past performance does not guarantee future results.
5. Quiz: Which Indicator Style Fits You?
Not sure which type of buy sell indicator is right for your trading style? Answer these 4 questions to find out:
How much time do you spend analyzing charts per day?
6. What red flags should you avoid when choosing indicators?
After testing hundreds of indicators over the years, here are the warning signs that an indicator is not what it claims:
Can any indicator really have a 100% win rate?
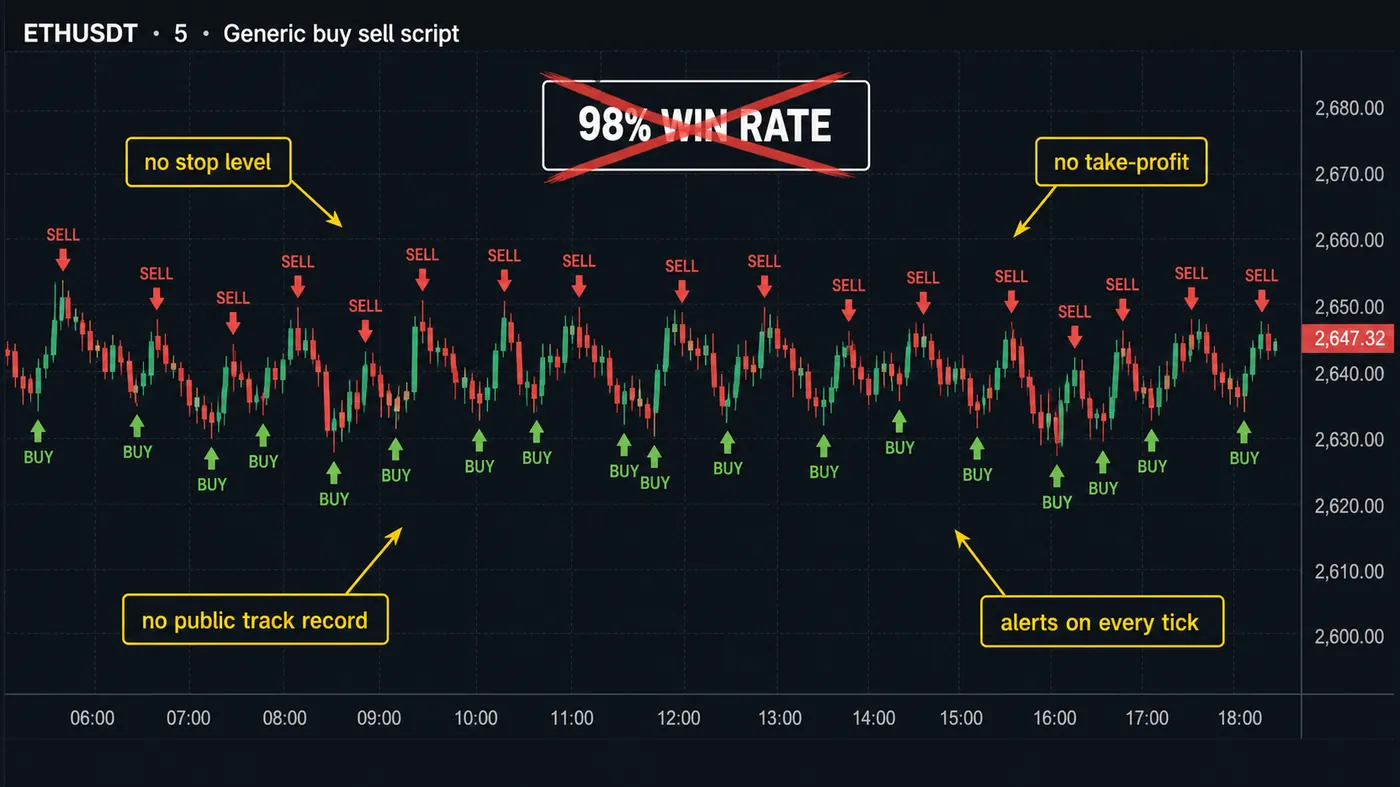
No indicator wins 100% of the time. Anyone claiming this is either lying or their indicator repaints. A legitimate 55-65% win rate with a positive risk-reward ratio of 1:2 or better is genuinely profitable and realistic.
Why should an indicator show live trading proof?
If an indicator's marketing only shows cherry-picked historical charts, be skeptical. Look for live trading results, real account statements, or at minimum, forward-testing data where signals were called in real time.
Why is a cluttered chart a red flag?
An indicator that paints 50 signals per day with arrows, dots, lines, zones, and labels everywhere is not giving you an edge — it's giving you analysis paralysis. The best buy sell indicators are selective. Fewer, higher-quality signals beat volume every time.
Why is a signal without a stop loss incomplete?
If an indicator tells you to "BUY" but doesn't show you where your stop loss should be, it's incomplete. Today, there is no excuse for a premium indicator not to include ATR-based or structure-based stop loss and take profit levels.
How can you spot a repainted backtest?
The single most common deception. The indicator's historical chart shows perfect entries at every bottom and exit at every top — because the signals were recalculated after the fact. Always run the repainting test: add the indicator, take a screenshot, switch timeframes, switch back, compare.
7. How do you automate buy sell signals?
Once you've found a reliable buy sell indicator, the next step for many traders is automation. TradingView supports this through its alert system and webhook functionality.
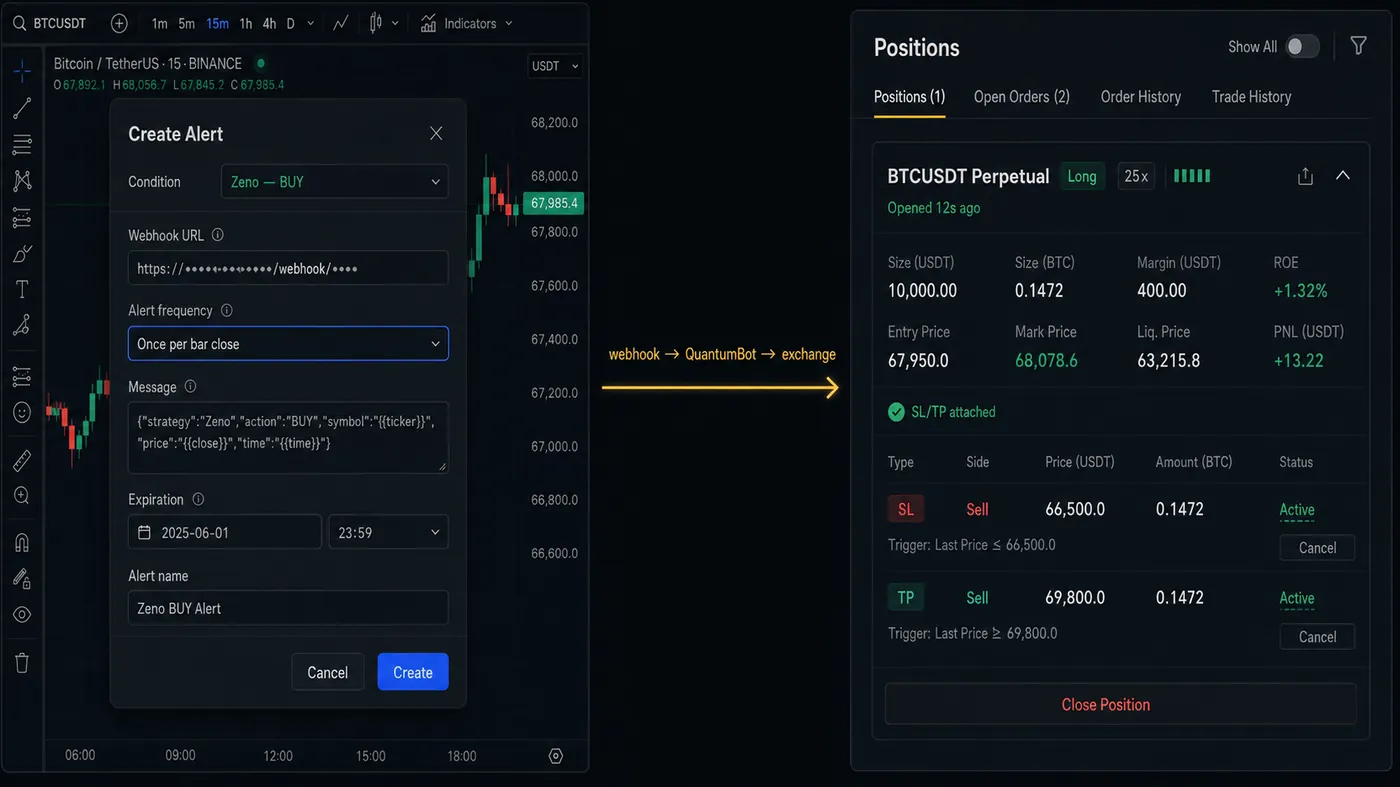
The process works like this: your indicator generates a signal → TradingView fires a webhook alert → your bot receives the webhook → the bot executes the trade on your exchange (Bybit, Binance, OKX, etc.).
For this to work, the indicator's Pine Script code needs to include alert() function calls that send structured data (like entry price, side, stop loss, take profit) in the alert message. Not all indicators support this — many only support basic "Buy" or "Sell" text alerts without the trade details needed for automation.
8. Frequently Asked Questions
Based on our testing, the best overall buy sell indicator combines multi-timeframe confluence, non-repainting signals, and built-in risk management. Single-indicator tools like RSI or MACD alone produce too many false signals. The top performers use Smart Money Concepts with volume confirmation — Quantum Algo Zeno scored highest in our 3-month test at approximately 75% win rate.
Yes, but with caveats. No indicator predicts the future — they identify high-probability setups. The key differentiator is whether signals repaint. Non-repainting indicators with multi-timeframe confirmation and volume filtering produce significantly more reliable results than simple crossover tools.
Free indicators like RSI, MACD, and Supertrend are excellent learning tools and can be profitable when combined correctly. However, they require manual confluence checking across multiple timeframes. Premium indicators automate this and add features like non-repainting guarantees and built-in stop loss levels.
Two to three complementary indicators is optimal: one for trend, one for momentum, one for volume. More than three leads to analysis paralysis. Many premium all-in-one indicators combine these internally, replacing 3-4 separate tools with a single solution.
Yes. TradingView supports webhook alerts that can trigger automated trades on exchanges like Bybit and Binance. The indicator needs alert() support in its Pine Script, and you need a bot service or VPS to receive and execute the webhooks.
Leading indicators (like RSI divergences, order blocks) signal reversals before they happen. Lagging indicators (like moving average crossovers) confirm trends after they start. The best systems combine both for early warning plus confirmation.
Liquid markets with consistent volume: major forex pairs, large-cap crypto (BTC, ETH, SOL), gold, and stock indices. They underperform on low-liquidity altcoins and during low-volume sessions.
A non-repainting indicator locks signals once the candle closes. It cannot change, move, or delete historical signals. Many free indicators repaint — test by switching timeframes and checking if signals shift.
A well-built buy/sell indicator works as a decision aid — it flags moments that meet a defined condition, enforcing discipline and consistency. It does not work as a standalone money machine. Signals used in isolation, without trend and structure context, tend to be little better than random. The indicators that 'work' are the ones used within a complete process, not the ones expected to make decisions on their own.
Accuracy claims are the biggest red flag in this space. Every genuine strategy has losing trades, so any tool advertised with a near-perfect win rate is almost certainly repainting or curve-fitted. Rather than chasing the 'most accurate' label, look for a transparent tool with clear logic, visible losing trades, and ideally a verifiable public track record. A modest, real edge applied consistently beats a fantasy hit rate every time.
Repainting means a signal appears and then moves or disappears as new price bars form. A repainting indicator looks flawless on historical charts because it effectively draws the answer after the fact, but it is useless in real time because the arrow you acted on may not survive. Repainting is the single biggest reason buy/sell tools disappoint. Always test in real time, bar by bar, before trusting any signal.
Zeno prints confirmed-close Buy/Sell signals with the stop, TP1 and TP2 drawn on the chart, on gold, crypto, indices and forex — $112.86 $79/mo, cancel anytime, crypto accepted. Public calls are timestamped on TradingView, nothing deleted.
9. Final Verdict
After three months of testing 7 buy sell indicators across three markets and two timeframes, the conclusion is clear: the era of simple crossover indicators is over.
Today, the best buy sell indicators don't just tell you when to click buy or sell. They provide complete trade plans with multi-timeframe confirmation, volume validation, and exact risk management levels. They combine leading detection (where is smart money positioned?) with lagging confirmation (has the move started?) into a single, clean visual system.
If you're still using a basic RSI + EMA crossover and wondering why you can't seem to get consistent results, it's not your fault — it's your tools. The gap between a free crossover signal and a properly engineered institutional detection system is not incremental. It's categorical.
Start with our free 80-lesson Academy to learn Smart Money Concepts. Use the free tools to practice. When you're ready for the full system, backed by a public live track record.
Your edge is waiting.