VCP Pattern: Minervini's Volatility Contraction Pattern, the Trend Template and the Pivot Breakout
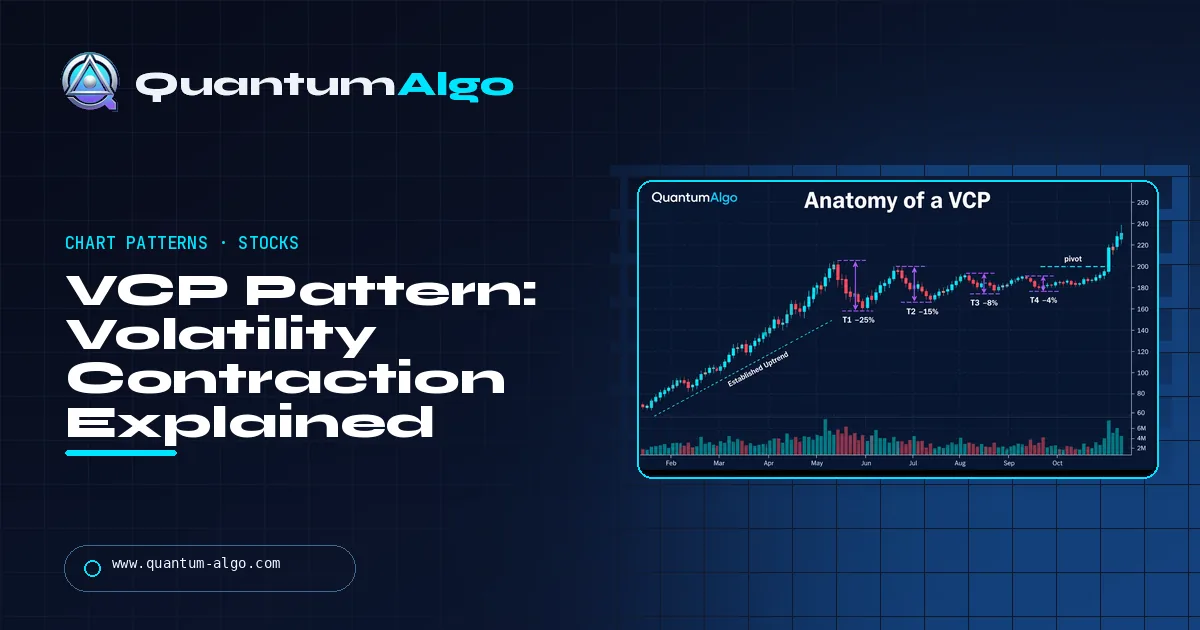
The VCP (volatility contraction pattern) is Mark Minervini's base pattern: a stock in a Stage 2 uptrend pulls back several times, each pullback shallower than the last — for example 25%, 15%, 8% — while volume dries up. The buy point is the pivot, the high of the final contraction, on a breakout with rising volume.
Most chart patterns are defined by a shape. The volatility contraction pattern is defined by a sequence: a stock that is already trending pulls back, then pulls back less, then less again, until the swings are tight and the volume has gone quiet — and then it breaks out. Mark Minervini built a championship-winning method around that sequence and a strict trend filter. This guide covers what the VCP is and where it comes from, how to read and measure the contractions, why they shrink, the eight-point Trend Template, where the pattern sits in Stage analysis, a step-by-step breakout plan with Minervini's stop and sizing rules, how it compares with the cup and handle, flat base, Darvas box and Bollinger squeeze, a worked four-contraction example, what the evidence does and does not support, the common mistakes, and a checker that tells you whether a base qualifies.
Indicators that prove themselves in public.
One engine, four precision tools — the Gold (XAU) Scalper, the institutional Gravity Zone, the Zeno momentum Oscillator, and Zeno Stocks for equities.



What is the VCP pattern?
The VCP — volatility contraction pattern — is a base that forms when a stock in a strong uptrend pauses and pulls back several times, with each pullback smaller than the one before. The swings tighten from left to right, volume dries up as they do, and the pattern resolves when price breaks above the high of the last, tightest contraction. That high is called the pivot, and the breakout through it is the buy point.
The pattern was named and popularised by Mark Minervini, a US stock trader and author of Trade Like a Stock Market Wizard (2013), Think & Trade Like a Champion (2017) and Mindset Secrets for Winning (2019). Minervini won the US Investing Championship in 1997 with a 155% return and won its $1 million-plus stock division again in 2021 with a record 334.8%; that contest verifies results from real-money brokerage statements. His explanation of the VCP is about supply: each pullback shakes out weaker holders, each one finds fewer sellers, and when the volatility has been squeezed out of the stock, little stands between price and a new advance.
What does a VCP look like?
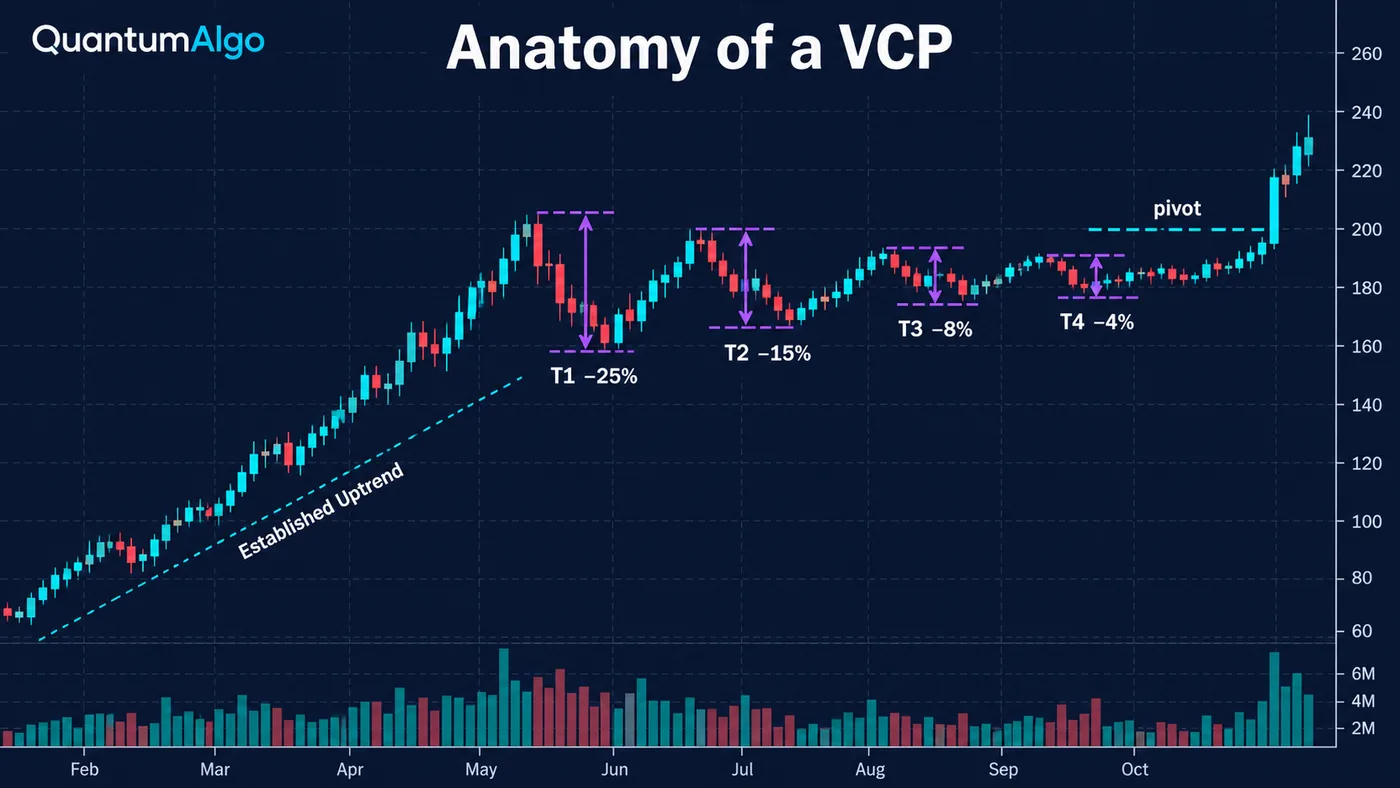
| Part | What to look for |
|---|---|
| Prior uptrend | A clear Stage 2 advance before the base — often 30% or more |
| Contractions (T) | Usually two to four pullbacks, sometimes up to six, each roughly half the depth of the one before — for example 25%, 15%, 8%, 4% |
| How depth is measured | From each swing high to the following low: (high − low) ÷ high × 100 |
| Base length | Anything from a few weeks to more than a year; many constructive bases run 6 to 20 weeks |
| Volume | Declining through the base and very quiet in the final contraction |
| Pivot | The high of the last, tightest contraction — the buy point |
| Breakout | A move through the pivot on clearly expanding volume |
Minervini describes a base with a shorthand "footprint": the number of weeks, the deepest and shallowest pullbacks, and the count of contractions. A base written as 40W 31/3 4T lasted 40 weeks, corrected 31% at its deepest and 3% at its tightest, and had four contractions. The point of the notation is the ratio between the first and last numbers — a VCP is defined by how much tighter the right side is than the left.
Why do the contractions get smaller?
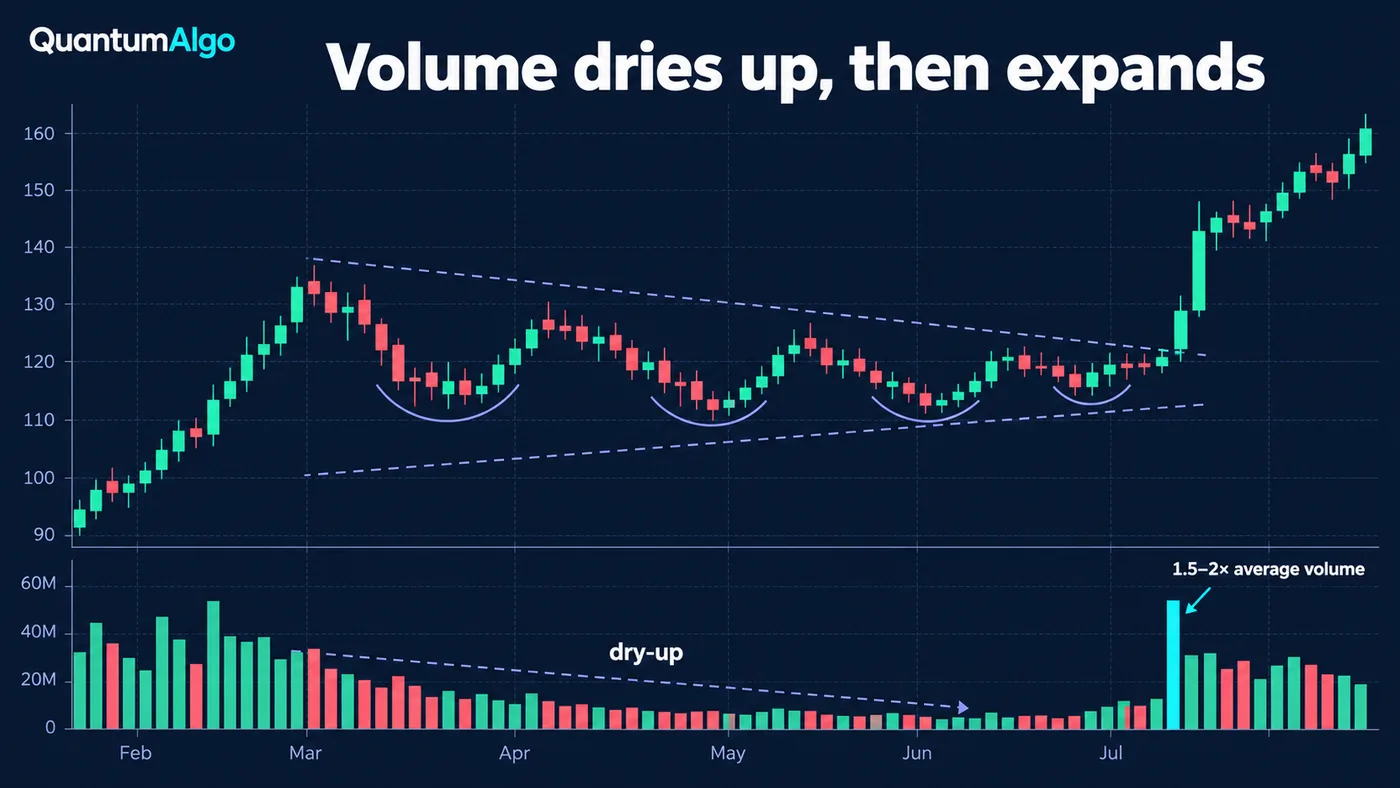
Think of each pullback as a test of supply. The first decline in a base is usually the deepest: holders who bought near the top sell, and the stock has to fall far enough to find buyers. On the next rally, those same sellers are fewer, so the following pullback is shallower. Each cycle removes more of the stock's available supply, until the swings are small and the volume on down days is light. That is what the tightening represents — not a magic sequence of percentages, but a market where sellers are running out.
Volume is the confirmation. Shrinking volume through the contractions says the sellers are drying up; a tall volume bar on the breakout says demand has arrived at the pivot. A breakout on ordinary volume is suspect, and a base whose right side is quiet in price but heavy in volume is still being distributed. Minervini's books stress the dry-up rather than a fixed breakout figure; trader conventions range from about 40–50% above average volume to around twice the 50-day average.
What is Minervini's Trend Template?
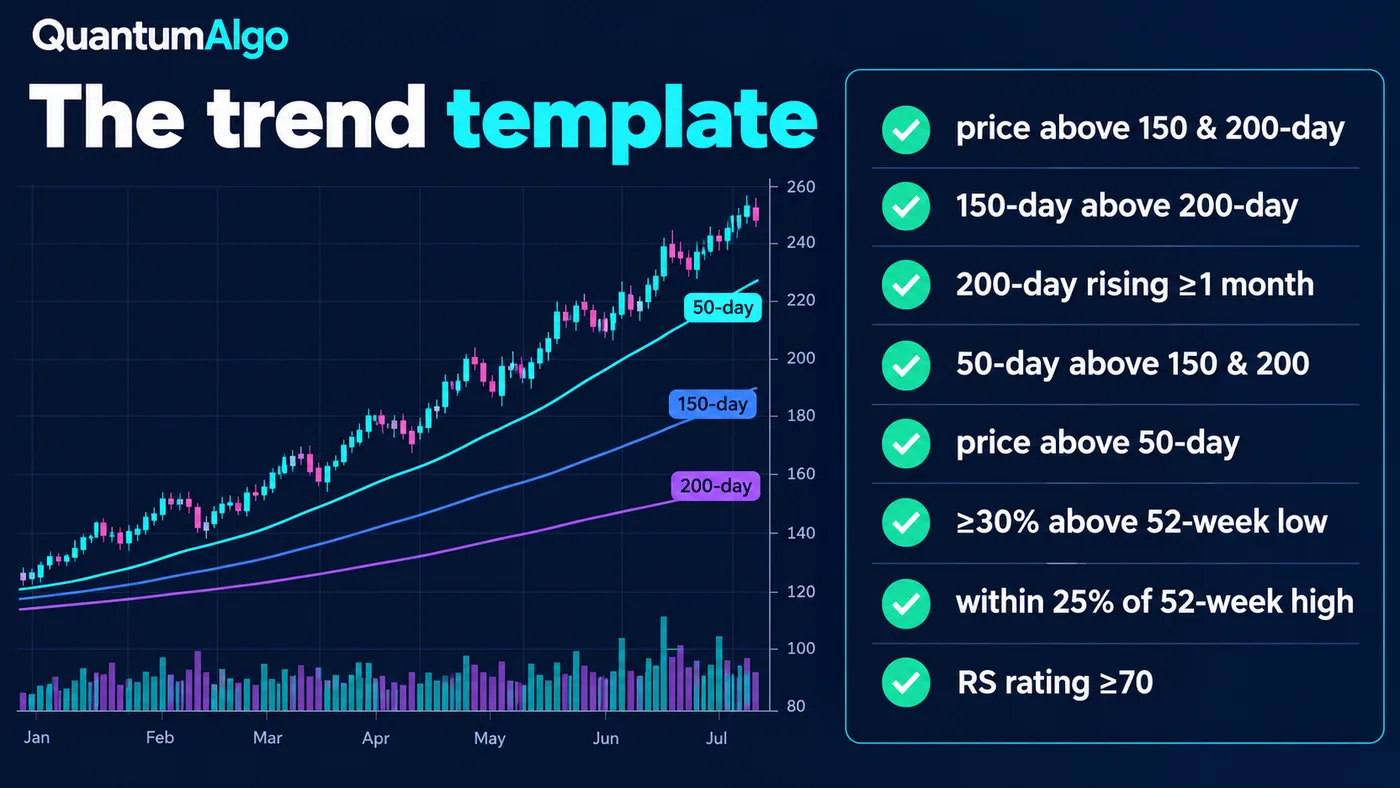
| # | Criterion |
|---|---|
| 1 | Price above both the 150-day and 200-day moving averages |
| 2 | The 150-day moving average above the 200-day |
| 3 | The 200-day moving average trending up for at least one month (preferably four to five months) |
| 4 | The 50-day moving average above both the 150-day and 200-day |
| 5 | Price above the 50-day moving average |
| 6 | Price at least 30% above its 52-week low |
| 7 | Price within 25% of its 52-week high |
| 8 | Relative strength ranking of at least 70, preferably in the 80s or 90s |
Minervini applies the template before looking at any base: a VCP is only worth trading in a stock that already meets all eight criteria. The template is what puts the pattern in a Stage 2 uptrend, and it is the part of the method with the most outside support — buying stocks near their 52-week highs and with strong relative strength lines up with decades of momentum research. The relative strength ranking in criterion 8 is Investor's Business Daily's RS rating; on other platforms, a percentile rank of the stock's 12-month return against the market is a close substitute.

Automate your trades. Let Quantum Algo trade for you.
Every signal executed on your own account — on your account, with the plan you define.
Where does the VCP fit in Stage analysis?
| Stage | Name | What it looks like | VCP relevance |
|---|---|---|---|
| 1 | Basing / neglect | Sideways after a decline; moving averages flat | Too early — no uptrend to continue |
| 2 | Advancing | Higher highs and lows; price above a rising 30-week (≈150-day) average | Where VCPs are traded |
| 3 | Topping | Wide, volatile swings near the highs | Loose bases that fail |
| 4 | Declining | Lower highs and lows below a falling average | Avoid |
Stage analysis comes from Stan Weinstein's Secrets for Profiting in Bull and Bear Markets (1988), which used a 30-week moving average to define the stages; Minervini adopted the same four-stage framework. The practical lesson is that a tightening base means opposite things in different stages: in Stage 2 it is supply drying up before the next leg, in Stage 3 it can be the last pause before a breakdown. The trend trading guide covers how to tell an uptrend from a topping range.
How do you trade a VCP breakout?
- Screen with the Trend Template. Start only with stocks that meet all eight criteria.
- Find the base and count the contractions. Measure each pullback high to low and check that each is smaller than the last.
- Mark the pivot. The high of the final, tightest contraction. Set an alert just above it.
- Wait for volume to dry up on the right side. Light volume in the last contraction is the sign supply is exhausted.
- Buy the breakout through the pivot on expanding volume. Avoid buying more than a few percent above the pivot; a chased entry widens the risk.
- Place the stop below the last contraction. Minervini caps losses at 10% and aims for an average loss of 5–6%; a tight base makes a tight stop possible.
- Size from the stop. He describes risking around 1.25% of equity per trade, 2.5% at most.
- Protect the gain. Once the trade is up about three times the initial risk, move the stop to breakeven.
Minervini also buys earlier in the base in some cases — the "cheat" entries. A 3-C (cup completion cheat) is a pause inside the right side of the base, below the eventual pivot, that offers a tighter stop; the low cheat is the same idea taken lower in the base. They trade a smaller stop for less confirmation, and they belong to traders who already handle the basic pivot entry well. The position sizing guide covers the arithmetic of sizing from a stop.
How does the VCP compare with similar patterns?
| Pattern | Defining feature | Typical depth / length | Trend filter |
|---|---|---|---|
| VCP | Successive pullbacks, each smaller; volume dries up | Varies; right side usually under about 10% | Trend Template / Stage 2 required |
| Cup and handle | A rounded cup then a small handle in its upper half | Cup about 12–33% deep, at least ~7 weeks (IBD) | Prior uptrend |
| Flat base | A tight sideways range after an advance | No more than about 15%, at least ~5 weeks (IBD) | Prior uptrend |
| Darvas box | A box from a new high and a confirmed low | Any; stacked boxes in a trend | New highs |
| Bollinger squeeze | BandWidth at a multi-month low | Measures volatility only | None — the break can go either way |
Many cup-and-handle and flat bases contain a VCP — the handle is often the final contraction — so the patterns overlap more than they compete. What makes the VCP distinct is that it is defined by the sequence of shrinking pullbacks rather than by a shape, and that it comes bundled with a trend filter. A squeeze alone says volatility is low; a VCP says volatility is low, sellers are exhausted and the trend is already up. The squeeze momentum indicator is a useful companion for timing the release.
VCP checker
Enter the depth of each contraction from left to right, the base length, what volume did in the last contraction, how many Trend Template criteria the stock meets and, optionally, the breakout volume. The checker writes the base footprint, tests whether the volatility is really contracting, and lists what is missing.
Reference data
| Item | Value |
|---|---|
| Full name | Volatility Contraction Pattern (VCP) |
| Popularised by | Mark Minervini, Trade Like a Stock Market Wizard (2013) |
| Contractions | Usually 2–4 (up to about 6), each roughly half the previous |
| Depth formula | (Swing high − following low) ÷ swing high × 100 |
| Buy point | Breakout above the pivot (high of the last contraction) on expanding volume |
| Stop | Below the last contraction; Minervini's maximum loss 10%, average target 5–6% |
| Risk per trade | About 1.25% of equity, 2.5% maximum (Minervini) |
| Trend filter | Trend Template — 8 criteria including ≥30% above the 52-week low and within 25% of the high |
| Stage | Stage 2 (Weinstein / Minervini) |
| On TradingView | No built-in VCP detector; community "VCP" scripts exist |
| Checked | October 2026 |
Worked example: a four-contraction VCP
An illustrative stock that has doubled from $40 to $80 over six months and meets all eight Trend Template criteria. It builds an 18-week base. The first pullback runs from $80 to $60 (25%). The next rally stalls at $78 and pulls back to $66.30 (15%). The third swing tops at $77 and dips to $70.84 (8%). The fourth tops at $76 and holds $72.96 (4%), with daily volume in that last contraction around half its 50-day average. The footprint is 18W 25/4 4T — every contraction about half the last, a tight right side, volume dried up.
The pivot is $76. The stock breaks through on 1.6× average volume and the trader buys at $76.20, with a stop at $72.90, just under the last contraction's low — 4.3% below the entry. On a $50,000 account risking 1% ($500), the position is $500 ÷ $3.30 ≈ 150 shares, about $11,400 or 23% of the account. If the stock reaches $86.10 — three times the $3.30 risk — the stop moves to breakeven. Had the breakout come on below-average volume, or had the fourth pullback been deeper than the third, the base would not have qualified and there would have been no trade.
What evidence supports the VCP?
There is no peer-reviewed study of the VCP itself, and the frequently quoted success rates for VCP breakouts do not trace back to published data. What does have strong support is the setting the method insists on. Jegadeesh and Titman (1993) showed that buying past winners and selling past losers earned significant returns over three- to twelve-month horizons; George and Hwang (2004) found that nearness to the 52-week high predicts future returns better than past returns do; Asness, Moskowitz and Pedersen (2013) found momentum premiums across eight different markets. Those results back the Trend Template's emphasis on strength and 52-week highs.
The same literature also carries the warning: Daniel and Moskowitz (2016) documented momentum "crashes" after market declines, which is why breakouts fail in clusters when the general market turns. On the pattern side, Lo, Mamaysky and Wang (2000) found that some chart patterns carry incremental information about future returns. The honest summary is that the VCP is a disciplined way of buying momentum at a low-risk point, not an independently proven edge.
What mistakes do traders make with the VCP?
- Trading a tightening base in a stock that fails the Trend Template — the pattern without the trend.
- Counting contractions that do not actually shrink. If the third pullback is as deep as the second, it is not a VCP.
- Chasing the breakout far above the pivot, which turns a 4% stop into a 10% one.
- Ignoring volume — buying a quiet breakout, or a right side that is tight in price but heavy in volume.
- Moving the stop lower when the breakout pulls back. The stop belongs below the last contraction.
- Buying in a falling market. Breakouts fail in groups when the indexes are in a correction.
- Expecting every base to look like 25-15-8-4. The ratios vary; the tightening is the point.
How does the VCP fit with structure and the free indicators?
The VCP is a stock-chart pattern, but its parts translate directly to tools on TradingView. The Volatility Storm Tracker shows volatility compressing and expanding, which is the contraction-and-release the pattern is built on; Institutional Key Levels marks the prior highs that become the pivot; and the Smart Money Concepts Engine prints the break of structure that confirms the breakout on lower timeframes. Zeno, the premium engine, prints buy and sell signals with a built-in stop and targets — on a VCP breakout, a buy signal at the pivot with a stop under the last contraction is the alignment to look for. For finding candidates, see the best indicators for stocks and the momentum trading strategy guide.
The VCP is a base in which each pullback is smaller than the last and volume dries up, in a stock that already passes Minervini's Trend Template. Measure the contractions high to low, insist that they shrink, mark the pivot at the last contraction's high, buy the breakout on expanding volume, keep the stop under the last contraction and size from it. The pattern has no independent proof of its own; its strength is that it buys momentum at a point of low risk.
◆ Interactive check
Can you read a VCP?
Questions traders ask about the VCP pattern
The volatility contraction pattern is a base in which a stock in an uptrend pulls back several times, each pullback smaller than the last, while volume dries up. It resolves with a breakout above the high of the final contraction, called the pivot.
The pattern was named and popularised by Mark Minervini in Trade Like a Stock Market Wizard (2013) and his later books. Minervini won the US Investing Championship in 1997 and its $1 million-plus stock division in 2021.
Usually two to four, sometimes up to six. The number matters less than the progression: each contraction should be roughly half the depth of the one before, with a tight final contraction.
From each swing high to the following low: (high − low) ÷ high × 100. A first pullback of 25% followed by 15%, 8% and 4% is a classic four-contraction VCP.
On a breakout above the pivot — the high of the last contraction — with volume clearly above average. Buying far above the pivot widens the stop and spoils the risk.
Below the low of the last contraction. Minervini caps losses at 10% and aims for an average loss of 5–6%, which a tight base makes possible.
Eight criteria a stock must meet before a base is considered: price above the 150- and 200-day averages, the 150-day above the 200-day, a rising 200-day, the 50-day above both, price above the 50-day, at least 30% above the 52-week low, within 25% of the 52-week high, and a relative strength ranking of at least 70.
They overlap — the handle of a cup is often the last contraction of a VCP — but the VCP is defined by the sequence of shrinking pullbacks and comes with the Trend Template, while the cup and handle is defined by its rounded shape.
There is no peer-reviewed study of the VCP itself. Its components — buying strong stocks near 52-week highs in uptrends — are supported by momentum research, and the tight stop limits losses when it fails.
TradingView has no built-in VCP detector, but community scripts screen for the pattern and the Trend Template. Volatility and key-level indicators help mark the contractions and the pivot.
References & Related Guides
Read next
- Cup and Handle Pattern
- Darvas Box
- Breakout Trading Strategy
- Squeeze Momentum Indicator
- Bollinger Band Squeeze Strategy
- Momentum Trading Strategy
- Best Indicator for Stocks
- Position Sizing
- Trailing Stop Loss
- Moving Averages
- Volatility Storm Tracker (free indicator)
- Zeno — the premium engine
Primary sources
- PR Newswire — Minervini wins US Investing Championship a second time (2022)
- Business Wire — 2021 US Investing Championship winners
- Jegadeesh & Titman — Returns to buying winners and selling losers (Journal of Finance, 1993)
- George & Hwang — The 52-week high and momentum investing (2004)
- Daniel & Moskowitz — Momentum crashes (JFE, 2016)
- StockCharts ChartSchool — Bollinger Band Squeeze