How to Find Stocks for Day Trading: The Screen That Finds Today's Stocks Every Day
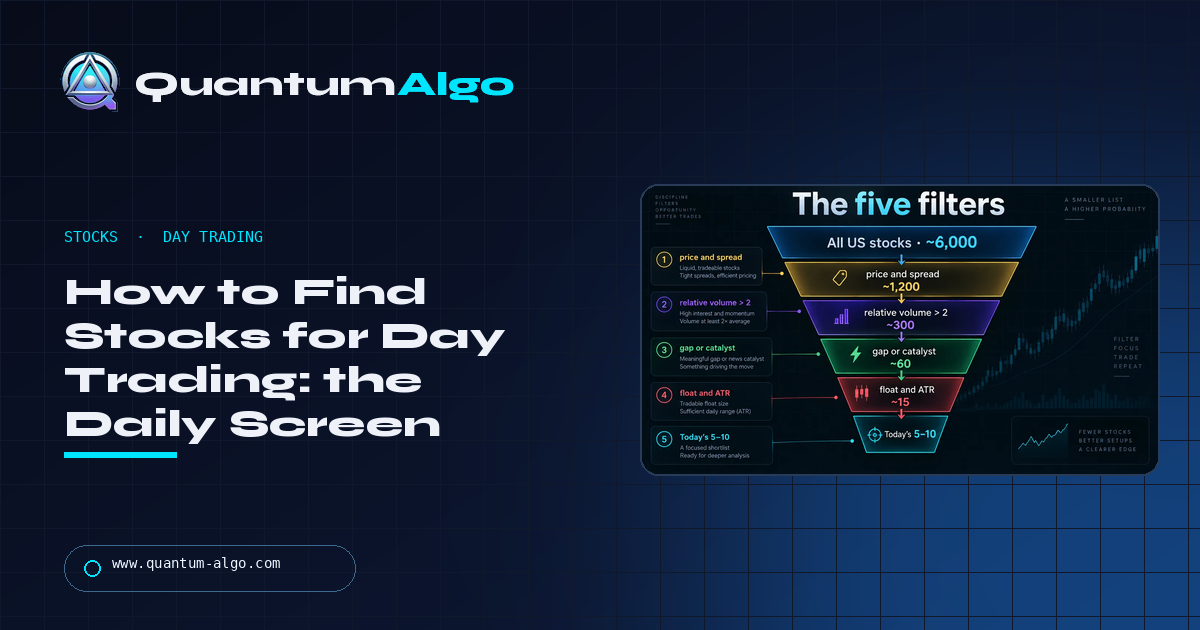
The best stocks for day trading are whichever ones today have unusually high relative volume, a real catalyst, a price and spread that let you size correctly, and enough float and range to move — and that list changes every morning. Any page naming "the best stocks for day trading" is stale by the time you read it. The screen is the answer: five filters, run at 9:00 and again at 9:35, that reduce six thousand US stocks to today's five to ten.
Good day trading stocks are found, not memorised. This page is the method: the funnel from six thousand names to today's handful, relative volume explained as the number that finds the stock the day it matters, the difference between an earnings gap and a social-media gap on the same morning, where to run the screen and when, and how the chart takes over once the screen has done its job. The builder below outputs the filters as text for TradingView's screener and Finviz.
Indicators that prove themselves in public.
One engine, four precision tools — the Gold (XAU) Scalper, the institutional Gravity Zone, the Zeno momentum Oscillator, and Zeno Stocks for equities.



What are the best stocks for day trading?
The best stocks for day trading are whichever ones today have unusually high relative volume, a real catalyst, a price and spread that let you size correctly, and enough float and range to move — and that list changes every morning, which is why any page that names "the best stocks for day trading" is out of date by the time you read it. This guide gives you the screen instead: five filters that reduce six thousand US stocks to today's five to ten in about ten minutes, the meaning of each filter, the difference between a catalyst gap and a social-media gap, and a screen builder that outputs the filters as text you can paste into TradingView or Finviz.
Good day trading stocks are found, not memorised. The method below is how we would find them if stocks were our main market; the structure read once you have found them is the same one we use on gold and indices.
The five filters
The funnel illustration in this guide is the screen in one picture: all US stocks (about 6,000) → price and spread (about 1,200) → relative volume above 2 (about 300) → gap or catalyst (about 60) → float and ATR (about 15) → today's 5–10.
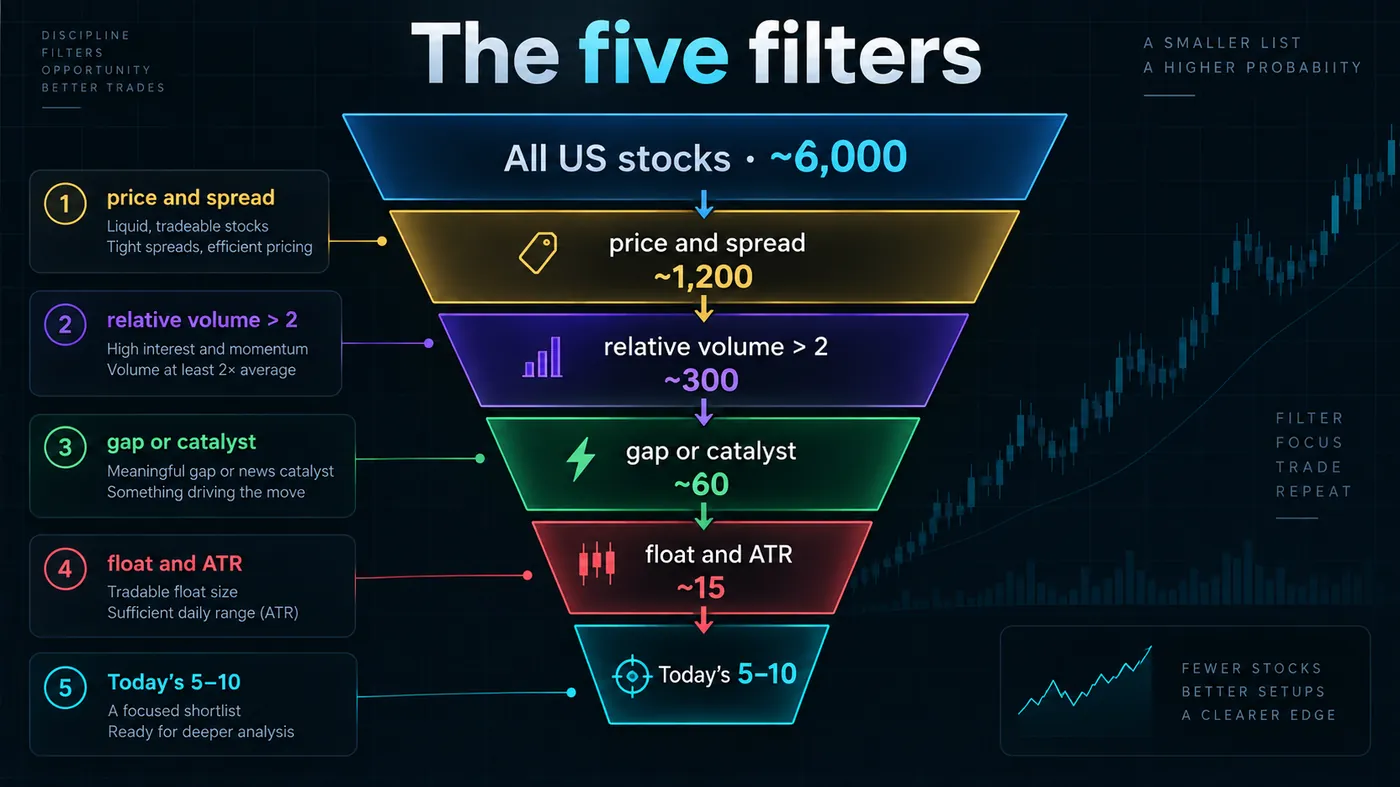
- Price and spread. Price between roughly $5 and $200 for most accounts — low enough to size in whole shares, high enough to avoid the sub-$5 names where spreads and halts live. Spread under 0.1% of price; anything wider eats a day trade's edge at the door.
- Relative volume above 2. The filter that matters most, explained below.
- Gap or catalyst. A gap of more than 3% from the prior close, or a named catalyst — earnings, guidance, FDA decision, contract, index inclusion, analyst action. Without a reason, the move has no owner.
- Float and ATR. Float between roughly 20 million and 500 million shares for a move that is neither a halt-prone micro-float nor an immovable mega-cap; ATR above 2% of price so a normal day gives the trade room.
- Structure. The last filter is the chart: a clean pre-market range, a level to trade against, no chaos. Five to ten names survive.
Relative volume: the number that finds the stock
The RVOL illustration in this guide puts a stock's 30-day average volume (1.2 million) next to today's first-hour volume (5.0 million): relative volume 4.2. That ratio is the single most useful number in day trading stocks, because it answers the only question that matters at 9:35 — is anyone here today? A stock trading at four times its normal pace has participants, liquidity, and a reason; a stock at 0.6 of normal has none of the three, whatever its chart looks like.
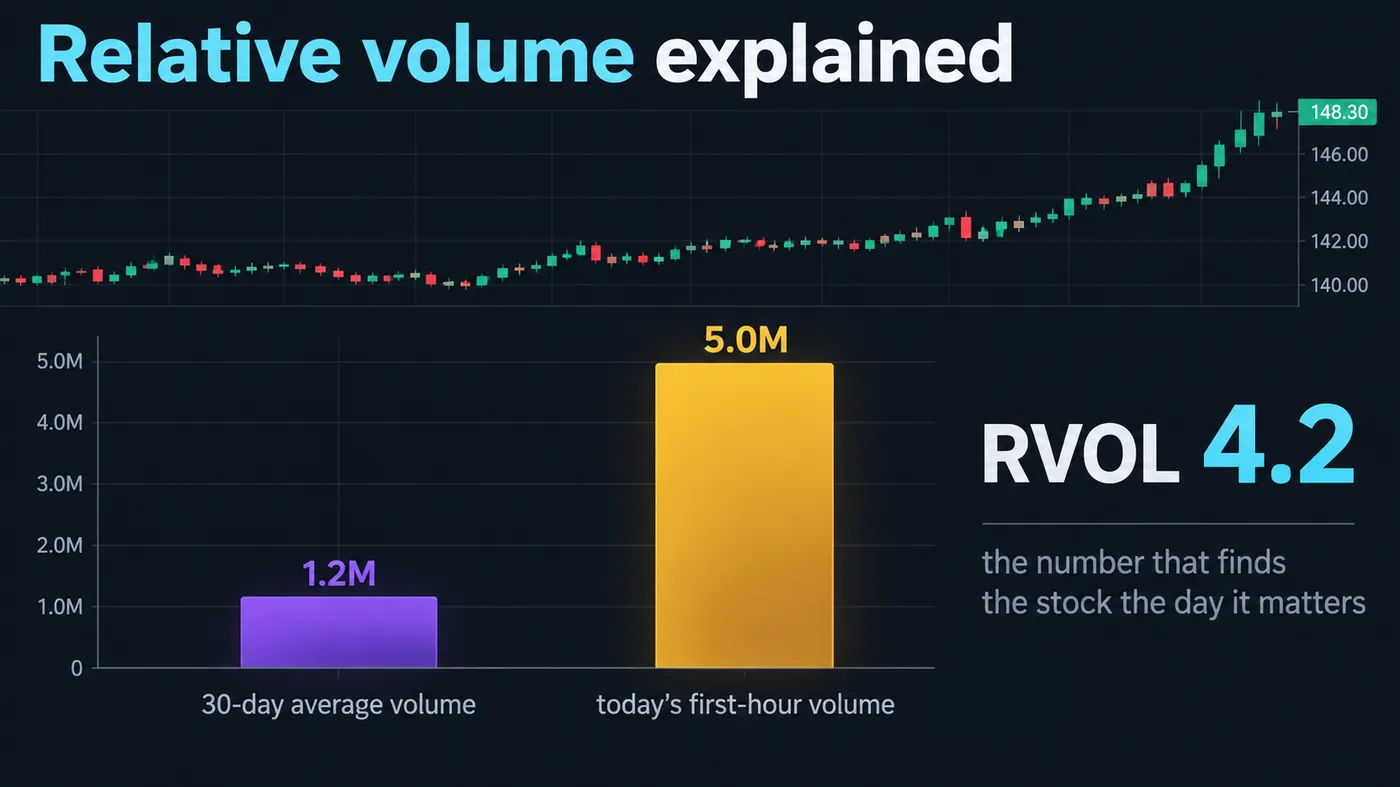
Read it at the open (first 15–30 minutes against the same window's average, if your screener supports it) rather than as a full-day number, and prefer RVOL above 2 for a trade and above 5 for a stock worth clearing the deck for. Most screeners — TradingView's stock screener, Finviz, the broker's own — expose it directly.
Catalyst versus no catalyst
The side-by-side illustration in this guide is two stocks on the same morning, both gapping 12%. The left one gapped on earnings: volume stays elevated all session, the structure is clean, pullbacks hold, and the move continues. The right one gapped on a social-media spike: volume is enormous for twenty minutes and gone by 10 am, and the stock has reversed the entire gap by then. The gap is the same; the reason is not.
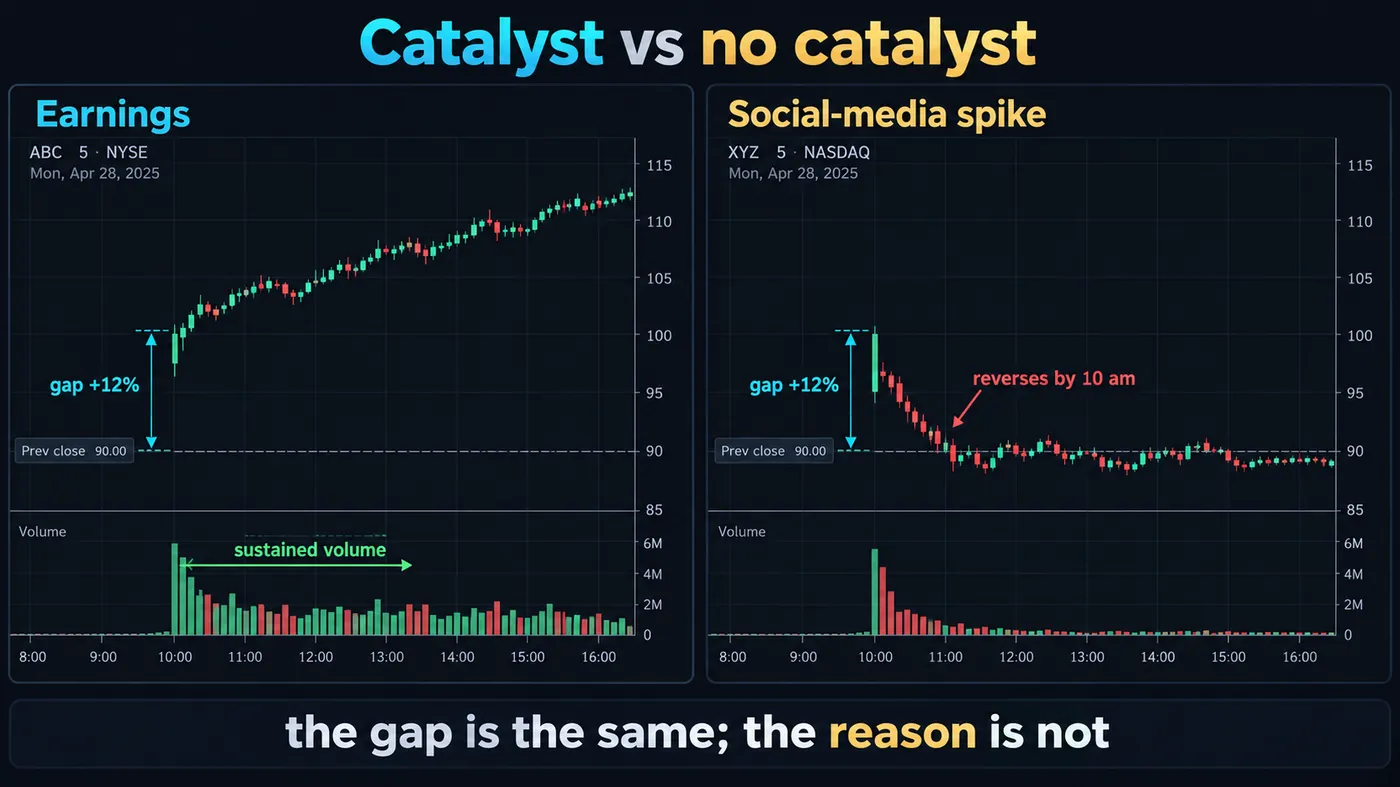
The catalyst filter is what separates them, and it has to be checked by hand: read the headline, not the ticker. Earnings, guidance, a regulatory decision, a signed contract, an index inclusion, a credible upgrade — these bring participants who stay. A forum post, a squeeze rumour, a promoted newsletter — these bring participants who leave. The screen builder on this page asks for the catalyst type and weights it.

Automate your trades. Let Quantum Algo trade for you.
Every signal executed on your own account — on your account, with the plan you define.
Where to run the screen
- TradingView's stock screener — filters for relative volume, gap %, price, float and ATR; results open on the chart you analyse on; saves as a template.
- Finviz — the fastest free screener, with float and gap filters built in; the Elite tier adds real-time. Our Koyfin review compares the research tools; Finviz is the screening one.
- The broker's platform — most direct-access brokers have a pre-market scanner with RVOL and gap; use it if it is on your trading screen already.
Run it at 9:00 ET for the pre-market list, again at 9:35 with the first-five-minute volume, and once more at 10:15 for the names that held. The list shrinks each time; the survivors are the trades.
From the list to the trade
Finding the stock is half the job. The other half is the same structure read we use everywhere: the pre-market high and low are the liquidity; the opening-range break with volume is the displacement; the pullback to the order block is the entry; the stop goes beyond the sweep; the target is the next level. Our opening-range-breakout guide covers the first hour, and Zeno Stocks marks the structure on the names the screen produces.
Two stock-specific rules: know the pattern day trader status of your account before the fourth round trip, and know the halt rules for the stock — volatility halts on small caps freeze you in the position, which is one more reason the float filter exists.
The screen, filter by filter, with the numbers
| Filter | Beginner setting | Active day trader setting | Why the range |
|---|---|---|---|
| Price | $10–$200 | $5–$500 | Under $5: halts, spreads, promoted names. Over $200: sizing in whole shares gets coarse (fractional shares fix this for entries but not for exits on some brokers) |
| Spread | < 0.05% of price | < 0.1% | A $0.10 spread on a $50 stock is 0.2% — a fifth of a 1% target gone at the door |
| Relative volume | > 3 (first 30 min) | > 2 | Participants today, not on average |
| Gap | > 3% either direction | > 2% or any catalyst | A reason to be there |
| Float | 50M–500M | 20M–2B | Small floats halt and squeeze; mega-floats need billions to move |
| ATR (14, daily) | > 2.5% of price | > 1.5% | Room for a target inside a normal day |
| Average volume (30d) | > 1M shares | > 500k | Baseline liquidity so RVOL means something |
| Short interest | note it | note it | High short interest changes the character of a squeeze; not a filter, a label |
The screen builder outputs these as filter strings for TradingView's screener and Finviz; adjust the beginner column tighter, never looser, for the first fifty trades.
A morning with the screen, minute by minute
- 8:30 ET — read the pre-market movers with a catalyst check by headline; discard anything whose reason is a forum, a newsletter or "no news". Note earnings reactions, guidance, FDA, contracts, upgrades.
- 9:00 — run the full five filters on pre-market data; mark the pre-market high and low on each survivor. Eight to twelve names.
- 9:30–9:35 — watch, do not trade. Note which names hold their pre-market range and which collapse.
- 9:35 — re-run with first-five-minute volume against the same window's average. Names with RVOL above 3 and a held range survive; five to seven.
- 9:45–11:00 — the trading window: opening-range break with volume, pullback to the order block, entry, stop beyond the sweep, target at the next level. Two or three trades, not seven.
- 10:15 — final re-run; the names still elevated are the afternoon candidates.
- 3:00–3:50 — the afternoon push on whichever morning name held its structure; nothing new.
- After the close — log every trade with the catalyst, the RVOL at entry and the outcome in R; after fifty, the log tells you which catalyst types pay.
Reading the chart once you have the stock
The screen finds participants; the chart finds the trade. The pre-market high and low are the first liquidity of the day — the levels that get swept at 9:30 and then, often, reclaimed. The opening-range break (first five- or fifteen-minute high or low) with volume is the displacement; the pullback into the last consolidation before it is the order block; the stop sits beyond the sweep, the target at the next visible level (the pre-market high, the prior day's high, a round number). That is the same sequence Zeno marks on gold and indices, and Zeno Stocks marks it on the names the screen produces. Our opening-range-breakout guide is the full treatment of the first hour.
Mistakes the list-chasers make
- Trading last week's list. RVOL resets every morning.
- Ignoring the spread because the gap is exciting.
- Confusing a promoted spike with a catalyst.
- Trading sub-$5 names for the percentage moves and meeting the halts.
- Ten names on the watchlist and no plan for any of them.
- Forgetting the PDT count on the third trade.
The best stocks for day trading are found every morning by a screen, not remembered from a list: price and spread, relative volume, a catalyst checked by headline, float and ATR, and finally a clean chart. Run it at 9:00, 9:35 and 10:15, trade two or three of the survivors on structure, and log the catalyst type with every trade so the screen gets sharper.
◆ Interactive check
Do you know how to find them?
Questions people ask about finding day-trading stocks
Large, liquid names with a catalyst and RVOL above 2 — the ones the screen produces on any given day — rather than any fixed list. Beginners should add a minimum price of $10 and a maximum float to avoid halts.
Run the five filters at 9:00 ET on pre-market data: gap %, pre-market volume against the average, price, spread, float, and a catalyst check by headline. The pre-market list is the watchlist; the first five minutes decide which of it is real.
Above 2 for a tradeable name, above 5 for the day's main event. Below 1 the stock has no participants and no reason to move.
TradingView's screener and Finviz's free tier both cover the five filters; real-time data may need a paid tier. The screen builder on this page outputs the filter text for both.
Zeno Stocks marks structure on any US stock TradingView charts; the screen on this page finds the ones with participants today, and the indicator reads the structure once you are on the chart.
Five to ten from the morning screen, narrowing to two or three by 10 am. More than that and the plan for each one is missing.
Participants today (relative volume above 2), a reason for them to be there (a catalyst), a spread small enough to size against, and a float and ATR that let it move without halting. The chart decides the rest.
No for beginners: sub-$5 names carry wide spreads, volatility halts, promotions and manipulation. The price filter exists to keep them out until you have a record on liquid names.
9:00 ET on pre-market data, 9:35 with the first-five-minute volume, 10:15 for the afternoon candidates. The list shrinks each time; the survivors are the trades.
It marks the day a stock becomes interesting, which is a good swing entry signal; the swing trader then reads the daily structure rather than the first hour.
References & Related Guides
Read next
- Opening Range Breakout (ORB)
- How to Start Trading Stocks
- Best Indicator for Stocks
- Pattern Day Trader Rule
- What Is After-Hours Trading?
- Koyfin Review (research vs screening)
- Best Trading Platforms
- Order Types Explained
Authoritative sources
- TradingView: stock screener
- Finviz: stock screener
- FINRA: day trading
- Nasdaq: trading hours (pre-market data)
- SEC: day trading — your dollars at risk