Gaussian Channel Indicator: The Complete Trading Guide
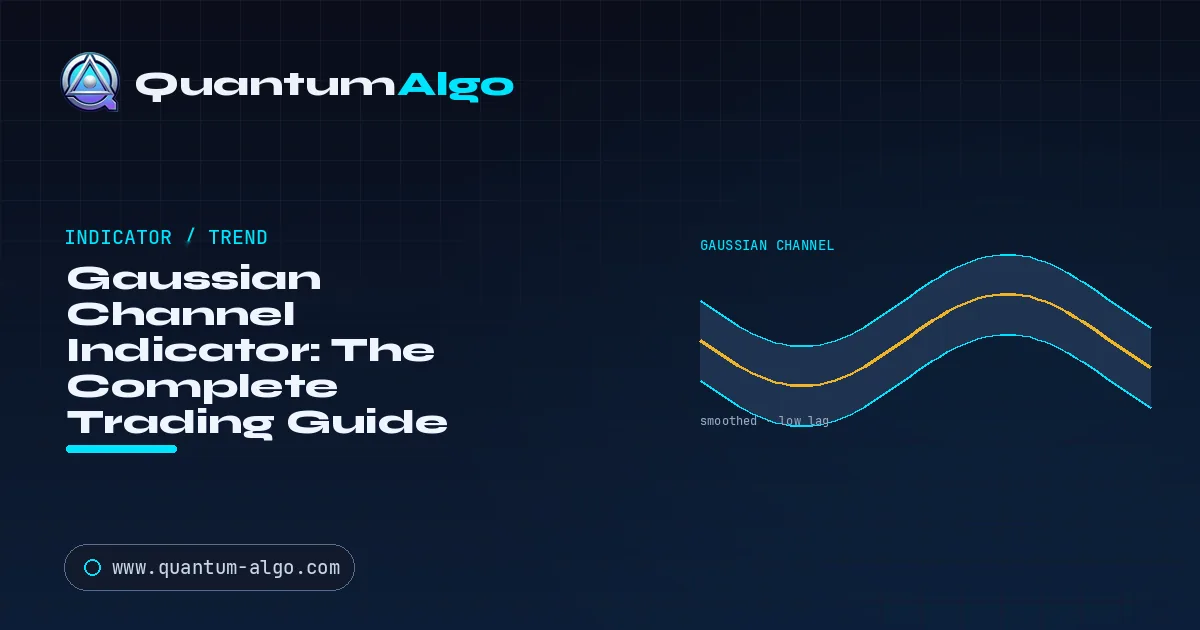
The Gaussian Channel is a trend-following indicator built on a bell-curve-weighted Gaussian filter: a smoothed midline plus upper and lower volatility bands. The midline shows trend direction and strength; the bands show extension against recent volatility. More poles make it smoother but slower; fewer react faster but wobble. Use it as a trend filter, entering only in the midline's direction.
The Gaussian Channel is a trend-following indicator that stands out for one reason: it aims to be smooth and responsive at the same time. Most moving-average tools force a trade-off — smooth out the noise and you add lag, or reduce lag and you get whipsawed by noise. The Gaussian Channel, built on a Gaussian (bell-curve weighted) filter, is designed to reduce that trade-off, giving traders a cleaner read on trend direction and volatility with less delay than a traditional moving average.
This guide explains how the Gaussian Channel works, what its bands and midline actually mean, how traders use it for trend, filtering, and mean-reversion, and the realistic limits of the tool. Whether you are evaluating it for your own charts or trying to understand why it behaves the way it does, this is the practical, no-hype breakdown.

Automate your trades. Let Quantum Algo trade for you.
Every signal executed on your own account — 24/7, hands-off.
What does the Gaussian Channel actually plot?
At its core, the Gaussian Channel is a smoothed price envelope. A central line applies a Gaussian filter to price — a weighting scheme shaped like the familiar bell curve, giving more weight to recent data in a mathematically smooth way — which suppresses noise while keeping lag lower than a comparable simple moving average. Around that midline, upper and lower bands are plotted based on volatility, forming a channel that expands and contracts as the market's range changes.
The practical effect is a tool that does two jobs at once. The midline tells you trend direction and, often by its colour or slope, trend strength. The bands tell you where price sits relative to its recent volatility — near the upper band in a strong uptrend, near the lower band in a downtrend, and oscillating within the channel when the market is ranging. Together they give a compact read on both direction and extension.
The three components of the channel
A smoothed midline for direction, and volatility bands above and below for extension.
How does the Gaussian filter reduce lag?
To understand why traders like the Gaussian Channel, it helps to understand the problem it solves. A simple moving average treats every bar in its window equally, which smooths well but lags badly — it is always looking backward at old data with the same weight as recent data. Faster averages reduce lag but reintroduce noise, the core trade-off behind every trend indicator. The Gaussian filter takes a middle path: it weights data using a bell-curve distribution and can be applied in multiple passes (poles), producing a curve that is both smooth and more responsive to recent price than an equivalent simple average.
Poles: smoothness versus lag
Fewer poles react faster but wobble; more poles are smoother but turn a little later.
The number of poles controls the trade-off. More poles mean a smoother line with slightly more lag; fewer poles mean a faster, slightly noisier line. This tunability is part of the appeal — you can shape the channel toward smoothness or responsiveness depending on your timeframe and style. It does not eliminate lag entirely — no causal indicator can, since it only uses past data — but it pushes the smoothness-versus-lag frontier outward compared with a basic moving average.
What are the main ways traders use the Gaussian Channel?
The channel supports several distinct uses depending on what you weight. Most traders combine two or more of these rather than relying on any single reading.
Using the channel as a trend filter
Take only the entries that agree with the midline's direction; skip the rest.
Trend direction
The slope and colour of the midline give a clean read on trend. Rising and one colour means uptrend; falling and another means downtrend. Because it is smoothed, it flips less often than a fast average.
Trend filter
Many traders use the channel purely as a filter — only taking long signals when the midline is rising, only shorts when it is falling — to keep other strategies aligned with the dominant trend.
Volatility & extension
Price riding the upper band signals a strong uptrend; price stretched far outside a band can signal overextension and a possible pullback toward the midline.
Mean reversion
In ranging conditions, the bands act as dynamic support and resistance, and price tends to revert from the outer bands back toward the smoothed midline.
How does the Gaussian Channel behave in trends and ranges?
Like every trend tool, the Gaussian Channel behaves differently across regimes, and knowing what to expect prevents misuse. In a strong trend it shines: the midline slopes cleanly, price hugs the band in the trend's direction, and the smoothness keeps you from getting shaken out by minor noise. This is where the tool adds the most value.
In a ranging market, the picture changes. The midline flattens and can give conflicting slope signals as price chops across it, and the bands become mean-reversion zones rather than trend guides. Used as a trend tool in a range, it will whipsaw — which is why the channel pairs so well with a regime awareness or a volatility filter that tells you whether to read it as a trend indicator or a mean-reversion one.
Trend regime versus ranging regime
The same channel is a clean trend guide in a trend and a mean-reversion zone in a range.
Which Gaussian Channel settings change its behaviour?
The Gaussian Channel exposes a few parameters that meaningfully change how it behaves. Understanding them lets you tune the tool to your timeframe rather than accepting defaults blindly.
| Setting | What it controls | Increase it → |
|---|---|---|
| Sampling period / length | How much data the filter smooths over | Smoother, slower, better for higher timeframes |
| Poles | Number of smoothing passes | Cleaner line, slightly more lag |
| Band multiplier | Width of the volatility bands | Wider channel, fewer band touches |
| Source | Which price the filter uses (close, hlc3, etc.) | Subtle shifts in smoothing character |
There is no universally correct setting — the right configuration depends on your timeframe and whether you want a fast, reactive channel or a slow, stable one. Higher timeframes and trend-following styles favour more smoothing; lower timeframes and reactive styles favour less. The disciplined approach is to pick sensible values, test them on your market, and adjust only with evidence.
How does the Gaussian Channel compare with other trend tools?
It helps to place the Gaussian Channel among the trend tools you may already know. Each makes a different trade-off between smoothness, lag, and information.
vs simple moving average
The Gaussian Channel is smoother for a given responsiveness, or more responsive for a given smoothness — it pushes the lag-versus-noise frontier that a simple average is stuck on.
vs Bollinger Bands
Both plot volatility bands around a centre, but Bollinger uses a simple average and standard deviation, while the Gaussian Channel uses a smoother, lower-lag filter for its midline.
vs Supertrend
Supertrend gives discrete flip signals; the Gaussian Channel gives a continuous, smooth read of direction and extension. Many traders use them together — one for bias, one for signal.
What can't the Gaussian Channel do?
The Gaussian Channel is a strong trend tool, but it is not a complete system and it does not predict the future. Like all trend-following indicators, it lags — less than a simple moving average, but it still turns after price does, so it will not call tops and bottoms. In choppy, sideways markets it produces mixed signals, and traders who treat every midline cross as a trade will get whipsawed. It is also, by itself, only a directional and volatility read — it does not define entries, stops, or targets.
The realistic way to use it is as one high-quality component: a smooth trend filter and volatility gauge that you combine with a separate entry method, structure, and risk management. Traders who expect it to be a standalone buy/sell machine are disappointed; traders who use it to keep their trades aligned with the dominant trend and to judge extension get real value. As always, test it on your own markets and timeframes — ideally with backtesting — before relying on it.
What pairs well with the Gaussian Channel?
Because its strength is a clean trend read and its weakness is ranging noise, the Gaussian Channel pairs naturally with tools that cover the gap. A momentum oscillator can time entries in the direction the channel identifies; a volatility or regime filter can tell you when to trust the trend read versus the mean-reversion read; and market-structure context can confirm whether a trend the channel shows is backed by real higher-highs and higher-lows.
The most robust setups use the Gaussian Channel to set the directional bias — only longs when the midline rises, only shorts when it falls — and then rely on a separate, more precise signal for the actual entry, with structure and liquidity confirming the trade. This keeps you trading with the dominant trend while getting cleaner timing than the smoothed channel alone can provide.
• Direction plus precision — Structure-backed entries on top of a clean trend read
• Regime-aware context — Liquidity and structure to know when to trust trend vs mean reversion
• Accountable performance — A verified public track record behind every signal
◆ Pair clean trend reads with real structure
Quantum Algo layers Smart Money Concepts — order blocks, fair value gaps, liquidity and market structure — on top of trend context, so a smooth directional read turns into precise, structure-backed entries, all with a verified public track record.
See the indicator → Verify the track recordFrequently Asked Questions
The Gaussian Channel is a trend-following indicator built on a Gaussian (bell-curve weighted) filter. It plots a smoothed midline that shows trend direction with less lag than a standard moving average, plus upper and lower volatility bands that form a channel around it. The design goal is to be smooth and responsive at the same time, reducing the usual trade-off where smoothing adds lag and speed adds noise.
It applies a Gaussian-weighted filter to price — a smoothing scheme shaped like a bell curve that can run in multiple passes (poles) — to produce a midline that suppresses noise while keeping lag lower than a comparable simple moving average. Volatility bands are plotted above and below that midline, expanding and contracting with the market's range. The midline gives direction; the bands show where price sits relative to recent volatility.
A simple moving average weights every bar in its window equally, which smooths well but lags badly. The Gaussian filter instead weights data using a bell-curve distribution and can apply multiple smoothing passes, producing a curve that is both smooth and more responsive to recent price. It does not eliminate lag — no causal indicator can, since it only uses past data — but it pushes the smoothness-versus-lag frontier outward compared with a basic moving average.
Poles control the number of smoothing passes the filter applies. More poles produce a smoother, cleaner midline at the cost of slightly more lag; fewer poles produce a faster, slightly noisier line. This tunability is part of the appeal — you can shape the channel toward smoothness or responsiveness depending on your timeframe and trading style.
It supports several uses: reading trend direction from the midline's slope and colour, acting as a trend filter (only longs when the midline rises, only shorts when it falls), gauging volatility and extension from where price sits relative to the bands, and mean reversion from the outer bands back toward the midline in ranging markets. Its single best use is as a trend filter paired with a separate, more precise entry signal.
Yes — trend trading is where it shines. In a strong trend the midline slopes cleanly, price hugs the band in the trend's direction, and the smoothing keeps you from being shaken out by minor noise. It is far less useful as a standalone tool in ranging markets, where the midline flattens and price chops across it, so it is best paired with a regime or volatility filter.
There is no universally correct setting. The sampling period controls how much data is smoothed, poles control the number of smoothing passes, and the band multiplier controls channel width. Higher timeframes and trend-following styles favour more smoothing; lower timeframes and reactive styles favour less. The disciplined approach is to pick sensible values, test them on your specific market and timeframe, and adjust only with evidence rather than chasing a magic configuration.
A properly built Gaussian Channel that calculates on closed bars does not repaint — its values, once a bar closes, are fixed. However, implementations vary, so if you are relying on signals you should verify the specific version you use by watching it form in real time and checking that historical values do not shift on reload. As with any indicator, trust only what holds up on closed-bar, real-time testing.
Both plot volatility bands around a central line, but they differ in the centre. Bollinger Bands use a simple moving average with standard-deviation bands, while the Gaussian Channel uses a smoother, lower-lag Gaussian filter for its midline. In practice the Gaussian Channel tends to give a cleaner trend read with less whipsaw, while Bollinger Bands are more established and widely documented. Many traders find them complementary rather than competing.
Like all trend-following tools it lags — less than a simple moving average, but it still turns after price does, so it will not call exact tops and bottoms. It produces mixed signals in choppy, sideways markets, and by itself it only gives a directional and volatility read — it does not define entries, stops, or targets. It is best used as one high-quality component within a system, combined with a precise entry method, structure, and risk management.
A smooth trend read is most powerful when paired with precise, structure-backed entries. Quantum Algo layers Smart Money Concepts — order blocks, fair value gaps, liquidity, and market structure — on top of directional context, so the bias a tool like the Gaussian Channel provides turns into specific, high-probability entries. With a verified public track record behind the signals, it covers exactly the entry-timing and structure gap that a smoothed channel leaves open.
The Gaussian Channel works on any market — forex, crypto, indices, stocks, gold — and on any timeframe, because it is a general-purpose trend and volatility filter. Its behaviour scales with your settings: more smoothing suits higher timeframes and swing or position trading, while less smoothing suits lower timeframes and more reactive intraday styles. As always, its usefulness depends on the regime — it adds the most value in trending conditions and should be filtered or read as mean reversion in ranges — so test it on the specific market and timeframe you trade.
References & Related Guides
More in this topic
- Supertrend Indicator Guide
- Range Filter Indicator Guide
- Squeeze Momentum Indicator (TTM Squeeze): Complete Guide
- Bollinger Bands Guide
- VWAP Trading Guide
- SSL Channel Indicator: The Complete Guide
- Best TradingView Indicators
- Non-Repaint Indicators: The Complete Guide to Reliable Signals
- Best Buy/Sell Indicator: How to Choose One That Actually Works
- Trend Trading Strategy: The Complete Guide
- Mean Reversion Trading Guide
- SuperTrend AI (Clustering): The Complete Guide
- Machine Learning Trading Indicators (Lorentzian): Complete Guide
- What Are the Best Indicators for Swing Trading?
Core reading
- Best TradingView Indicators
- Risk Management in Trading — The Complete Survival Guide
- Non-Repaint Indicators: The Complete Guide to Reliable Signals
- All Premium Guides
- Public Track Record
- Quantum Algo on TradingView