The Best Indicator for NASDAQ (US100): Trading the Index's Intraday Liquidity Game
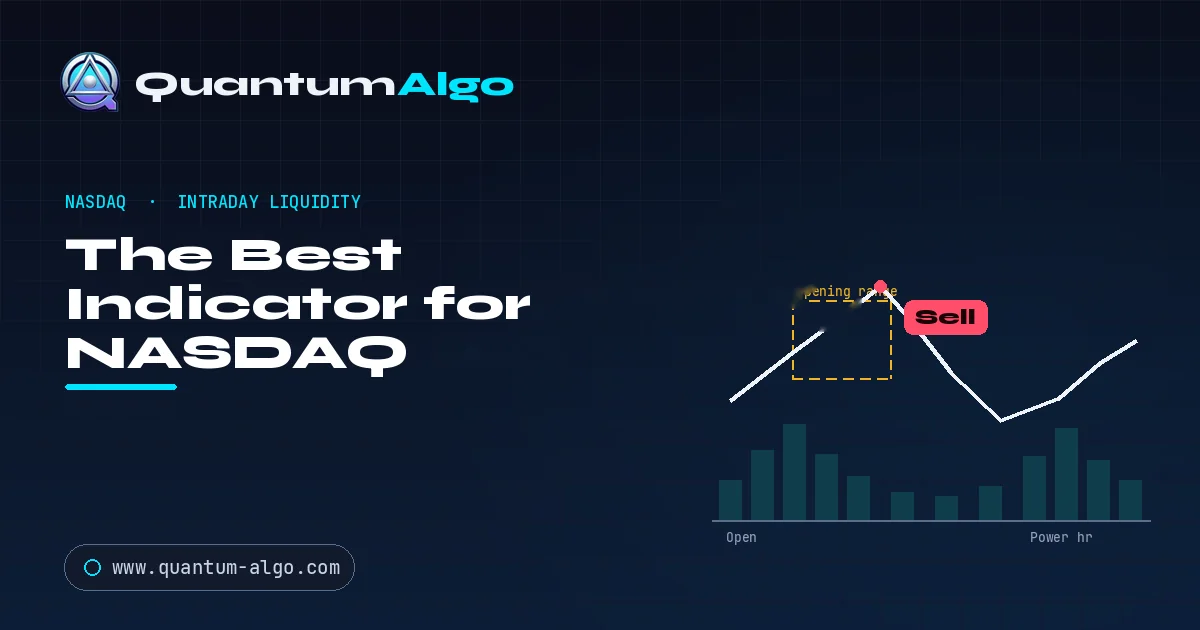
The best indicator for NASDAQ (US100) is a Smart Money Concepts structure engine that reads session liquidity (opening-range sweeps, order blocks, fair value gaps, stop clusters) rather than VWAP, RSI or a breakout level. The index typically fakes above the opening-range high, sweeps the buy-stops, reverses, then trends into the power hour; Quantum Algo trades that reversal with non-repainting signals.
The NASDAQ 100 — traded as the US100 or NAS100 index and its futures — has a personality unlike any single stock or currency pair. It is a leveraged basket dominated by a handful of tech mega-caps, priced around the clock in the futures market, and moved by algorithms that feast on the obvious levels retail traders lean on. Its signature is a violent open that runs the early breakout crowd, a dead midday, and an explosive afternoon. The best indicator for NASDAQ is the one that reads that intraday personality — the session liquidity and the stop-hunts — not a mean line the algos are designed to exploit. That is what Quantum Algo is built to do.
Indicators that prove themselves in public.
One engine, four precision tools — the Gold (XAU) Scalper, the institutional Gravity Zone, the Zeno momentum Oscillator, and Zeno Stocks for equities.
This guide is about how the US100 actually trades through a session: why the open behaves the way it does, where the liquidity sits, and how a Smart Money Concepts engine turns the index's stop-hunts into non-repainting entries with a verified record. If you've been run out of a clean opening-range breakout more times than you can count, this explains who took the other side.
| The instrument | A leveraged, mega-cap-weighted, futures-driven index that hunts obvious levels |
| What it is | A Smart Money Concepts structure engine that reads session liquidity, not a mean |
| Best for | US100 / NAS100 index and Nasdaq futures on TradingView — 1m up to 4H intraday |
| Reads | Session highs/lows, order blocks, FVGs, opening-range sweeps, MTF structure |
| Signals | Non-repainting, close-confirmed Buy / Sell with exact entry, stop, two targets |
| Proof | Public, timestamped record — 75% win rate over 160 closed signals |
Why does the US100 move the way it does?
Three facts explain almost everything about how the index trades. First, it is futures-driven — the index you watch is anchored to Nasdaq futures that price 23 hours a day, so overnight moves set traps that the cash session resolves. Second, it is mega-cap weighted — a handful of the largest tech names dominate, so the index gaps and lurches on their catalysts rather than moving like a smooth average of a hundred stocks. Third, it is algorithmically hunted — because so many retail traders place stops at the same obvious spots (the opening-range high, the prior day's high/low, the round number), those spots become magnets. The US100 doesn't drift toward liquidity; it lunges at it.
Put together, this produces the index's trademark rhythm: a fast, deceptive open, a low-liquidity midday drift, and a second burst of trend in the afternoon. A lagging indicator reads the same "overbought" at 9:35 whether price is about to reverse or extend. To trade the US100 you need a tool that reads where in the session's liquidity map you are.
How does a typical NASDAQ session unfold?
Here is the pattern that repeats more days than not, and that most breakout traders lose to.
At the open, volatility spikes and price often pushes just above the opening-range high, triggering the breakout longs and the buy-stops resting there. That push is frequently the trap: once the early liquidity is taken, the index reverses, leaving the breakout crowd underwater. Midday liquidity thins and price drifts. Then, into the afternoon power hour, real direction returns and the day's trend resolves. Quantum Algo reads this as a liquidity sweep of the opening range into a premium order block, waits for the change of character, and takes the reversal with the algos — not the doomed breakout against them.
Why does the US100 punish VWAP and opening-range trades?
The two most popular US100 tools are VWAP and the opening-range breakout, and the index is almost designed to punish both. VWAP tells you where the average participant sits — useful context, but blind to the stop clusters, so fading to VWAP works until the day it doesn't and the move accelerates straight through it. Opening-range breakouts place you exactly where the algos expect you: buying the high the moment the buy-stops trigger, right before the sweep reverses. RSI compounds the error, flagging "overbought" at the top of the sweep just as the reversal begins. None of these read the one thing that decides the next 100-point move — where the resting liquidity is. That is the gap a structure engine fills.
| VWAP · ORB · RSI | Quantum Algo (SMC) | |
|---|---|---|
| Reads | A mean or a breakout level | Session liquidity & structure |
| Opening range | Chases the breakout | Treats the break as a sweep |
| Stop clusters | Invisible | Mapped as the target |
| Timing | Lags the reversal | Confirms on the change of character |
| Trend context | Single timeframe | 4H / 1H confluence |
| Output | A line or a level | Entry, stop, two targets |
How Quantum Algo trades the open, the sweep and the power hour
Quantum Algo is one engine with four tools, and on a fast index they work in concert. The Structure engine marks the graded order block and unmitigated Fair Value Gap where the sweep is likely to reverse. The Gravity Zone is built for exactly this instrument: it highlights the session high/low and opening-range liquidity the index is magnetically drawn toward, so you see the target of the hunt before it happens. The Oscillator flags exhaustion on the reversal candle as confluence, never as a standalone trigger. The multi-timeframe panel keeps your 5-minute entry aligned with the 1-hour and 4-hour bias, so you take the reversal only in the direction the larger structure supports. The result is one non-repainting signal — critical on an instrument that can move a full stop in seconds.
US100 vs. US30 and US500: what's different
The same method applies across the US indices, but their personalities differ and it's worth knowing which you're trading. The US100 is the most volatile and the most algo-driven — the cleanest stop-hunts, the sharpest reversals, the biggest power-hour moves, because tech mega-caps dominate it. The US30 (Dow) is slower and more orderly; sweeps are gentler and ranges hold longer. The US500 (S&P) sits in between and often leads the others, so its structure is useful context even when you trade the Nasdaq. Quantum Algo's zone grading adapts to each, but if you're drawn to fast intraday action, the US100 is where the liquidity game is most pronounced — and most tradeable once you can read it.
The public record
Screenshots of caught reversals prove nothing. Quantum Algo posts its public Zeno calls on TradingView with a timestamp before the outcome, kept permanently — wins, losses and breakevens, never edited. Across the full record: a 75% win rate over 160 closed signals, 2.3:1 planned risk-to-reward. The curve below shows what disciplined 1% sizing does with an edge like that on a fast instrument.
The drawdowns matter more here than anywhere. The US100 can hand you several stopped sweeps in a choppy session, and the whole edge lives in the large sample, not the next trade. Fixed-fractional risk management is what keeps a normal losing streak on a fast index from becoming a bad day you can't recover from.
What does a US100 trading workflow look like?
Set the bias on the 4-hour and 1-hour before the session and trade only with it. Mark the session liquidity — the opening range, the overnight high/low, the prior day's extremes — as the likely targets of the hunt. Let the open play out: expect the first push to be a trap and wait for the sweep rather than chasing the breakout. Enter on the close-confirmed signal after the change of character, with a stop beyond the swept level. Respect the clock — the cleanest trends come in the power hour, and the midday drift is where good setups go to die. Journal the session and time-of-day with each trade; your edge will sharpen around specific windows.
How should you backtest the US100?
Because Quantum Algo doesn't repaint, you can scroll back through the US100 and see every opening-range sweep and signal exactly as it printed. Test with the session in mind: log which trades came at the open, midday and power hour, because the index's behavior is time-of-day dependent in a way stocks and forex are less so. Record at least fifty intraday trades with fixed risk and track win rate, average R and maximum drawdown together. If your numbers track the public ledger, the edge is real in your hands. The best indicator for NASDAQ isn't the one with the fastest breakout alert — it's the one that shows you the sweep coming so you're on the right side of the index's daily trap.

Automate your trades. Let Quantum Algo trade for you.
Every signal executed on your own account — 24/7, hands-off.
Frequently Asked Questions
The best NASDAQ indicator reads session liquidity and stop-hunts rather than a mean or a breakout level. Quantum Algo is a Smart Money Concepts engine that maps the opening range, session highs/lows and order blocks the index hunts, confirms with structure, and fires non-repainting signals with a defined plan — backed by a 75% win rate over 160 closed signals.
Because the opening-range high is where the day's most obvious buy-stops sit, and the index routinely pushes just above it to trigger them before reversing. You're placed exactly where the algos expect. Treating the break as a liquidity sweep to fade — after a structure shift — flips you to the profitable side.
VWAP is useful context but blind to stop clusters, so fading to it works until a liquidity-driven move accelerates straight through it. On an instrument this algo-driven, a structure engine that maps where the stops sit outperforms a mean line as a standalone tool.
The index's volatility is front- and back-loaded: the open produces the sharpest, most deceptive moves and the afternoon power hour produces the cleanest trends, while midday liquidity thins and drifts. Many US100 traders focus on the open's sweep and the power-hour continuation and avoid the midday chop.
Yes — the US100 / NAS100 index and Nasdaq futures on TradingView, from 1-minute up to 4-hour. Because the index is futures-anchored, the same order-block, FVG and liquidity-sweep logic applies across the cash and futures charts.
The US100 is the most volatile and algo-driven because tech mega-caps dominate it, giving the cleanest stop-hunts and sharpest reversals. The US30 is slower and more orderly; the US500 sits between and often leads. The same method applies, but the US100 has the most pronounced liquidity game.
No. Every signal is confirmed on candle close and never changes — essential on a fast index where a repainting tool would redraw the exact sweep candles that define the setup. You can scroll back and verify every past signal.
Yes, though the US100 is fast, so beginners should start small and slow. The output is a simple Buy or Sell with an exact entry, stop and two targets, the multi-timeframe panel simplifies bias, and the free 80-lesson Academy teaches the underlying concepts from scratch.
The public record shows a 75% win rate over 160 closed signals at a 2.3:1 planned risk-to-reward. Your results depend on trading with the higher-timeframe bias, waiting for the sweep instead of chasing breakouts, and using fixed-fractional risk. The verifiable ledger is how you judge the edge.
Where a broker or futures webhook is supported, signals route to automated execution with stop-loss, take-profit and breakeven handling — useful on a fast index. Otherwise you receive the same signals as push notifications with the full trade plan.
Matrix is $19/month for core signals, Atlas $39/month for the full SMC toolkit with filtering and backtesting, and Zeno $79/month for professionals with exact trade plans and the premium suite. Annual billing saves 25%, and every plan includes the public track record.
References & Related Guides
More in this topic
- Futures Trading for Beginners: Contracts, Ticks, Margin, Micros and Futures vs Options
- Best CFD Trading Platforms With Charting: Ranked for Chart-Driven Traders
- Best Indicator for S&P 500 (SPX500) — complete plan
- ADX Indicator: Complete Trading Guide
- AlphaTrend Indicator: Complete Trading Guide
- ATR (Average True Range): Complete Trading Guide
- Awesome Oscillator: Complete Indicator Guide
- What Are the Best Volume Indicators?
- Bollinger Bands — Complete Trading Indicator Guide
- CCI Indicator: Complete Guide
- Chandelier Exit: Complete Trading Guide
- Donchian Channels: Complete Indicator Guide
- Fibonacci Bollinger Bands: Complete Trading Guide
- Fibonacci Retracement — Complete Trading Guide
- Hull Moving Average (HMA): Complete Trading Guide
- Gaussian Channel Indicator Guide
- Best Buy/Sell Indicator Guide
Core reading
- BOS & CHoCH: Complete Market Structure Guide
- Order Blocks Trading: Complete Guide
- Best TradingView Indicators — Complete Guide
- Risk Management in Trading — Complete Guide
- Candlestick Patterns Guide — Engulfing, Pinbar & More
- All Premium Guides
- Quantum Algo on TradingView
- Public Track Record
Authoritative sources
For a focused comparison, read the Advance-Decline Line for Nasdaq before applying the setup.