What Is the Best Indicator for Nikkei 225 (JP225)?
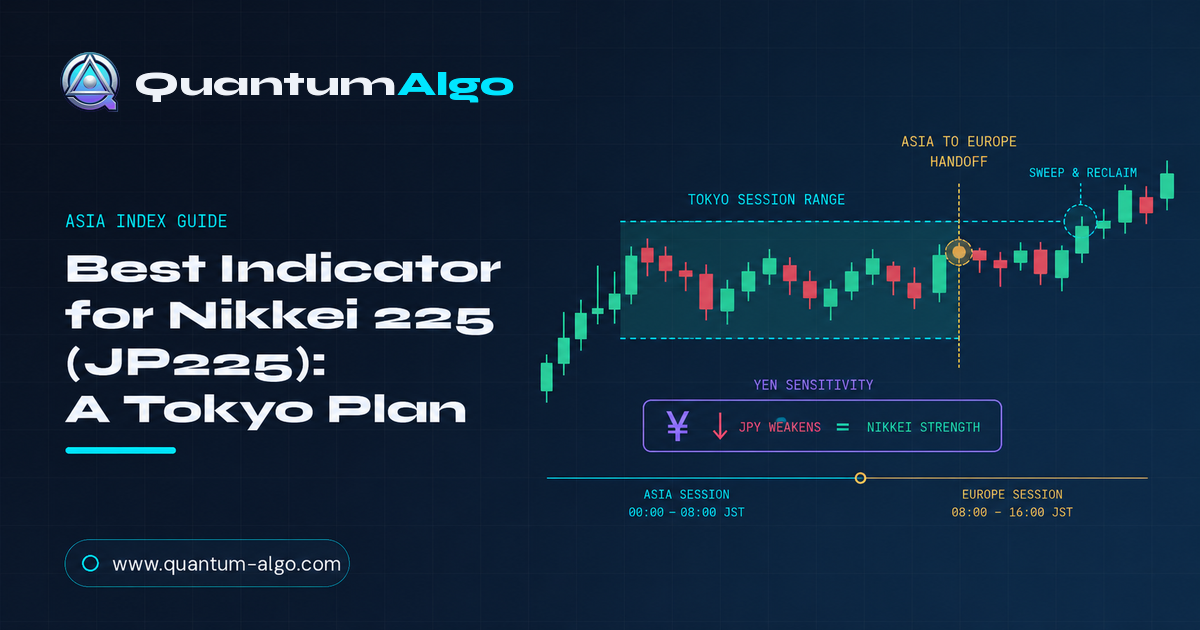
USDJPY can move JP225 more than any oscillator on the lower pane. A yen move can amplify a Nikkei breakout, blunt it, or turn a perfectly neat momentum signal into a trap during the Tokyo session. For the best indicator for Nikkei 225 trading, Quantum Algo’s workflow begins with local price structure and asks whether the currency impulse agrees.
The best indicator for Nikkei 225 trading is a session-aware SMC structure tool used with a yen-context check and volatility-based sizing. Mark the Tokyo range, wait for a sweep or displacement, check whether USDJPY supports the move, and enter only with a defined invalidation. Quantum Algo’s free public indicators mark order blocks and FVGs; Zeno supplies confirmed Buy/Sell signals with SL/TP and built-in risk management.
The Nikkei 225 is a Tokyo-range and yen-sensitivity problem before it is an oscillator problem: the cleanest plan waits for local structure, checks the currency impulse, then reads the handoff into Europe. That does not mean USDJPY becomes a second chart to trade. It means I refuse to call every JP225 breakout independent of the currency move that can amplify or weaken it.
Indicators that prove themselves in public.
One engine, four precision tools — the Gold (XAU) Scalper, the institutional Gravity Zone, the Zeno momentum Oscillator, and Zeno Stocks for equities.
JPX’s Nikkei 225 micro-futures page explains the smaller contract context; JPX’s futures specifications confirm the contract unit and trading schedule before you translate chart points into risk.
Use this guide for JP225 CFDs, Nikkei futures and the TradingView feed your broker supplies. JPX’s domestic trading-hours page establishes the local equity-market schedule, while Nikkei Indexes’ official profile is the cleanest source for what the Nikkei 225 represents. CME’s Nikkei futures page is the place to verify the contract you actually trade.
| Layer | Question | Do not confuse it with |
|---|---|---|
| Tokyo range | What liquidity did local traders build? | A promised breakout direction. |
| Yen context | Is the currency impulse supporting the index move? | A standalone USDJPY signal. |
| SMC structure | Was there a sweep, displacement or reclaim? | A candle-color prediction. |
| VWAP / ATR | Where is value and how wide is normal movement? | A reason to fade every extension. |
| Risk layer | What cash amount is invalidation worth? | A fixed stop copied from another feed. |
What is the best indicator for Nikkei 225 (JP225)?
I would choose a session-aware structure indicator with a separate volatility and currency-context layer. The structure tool finds the chart event: a Tokyo low swept and reclaimed, a displacement through a local high, or a fair value gap that offers a retracement. The context layer tells me whether the event is happening with or against the yen impulse.
The role separation matters. I am not building a system that enters because USDJPY moved 0.2%. I am using the currency as a reason to demand stronger price confirmation when the two markets disagree. The SMC guide covers the structure vocabulary; this page applies it to a market with a distinct local session.
What moves the Nikkei beyond its price chart?
The Nikkei’s price action can respond to Japanese equities, global risk appetite, technology leadership, futures positioning and currency translation. That is a lot of context for a retail chart. I narrow it to three practical questions: is Tokyo accepting the move, is the yen context fighting it, and has external liquidity been taken?
If the index breaks higher while USDJPY drops sharply, I do not automatically short the Nikkei. I lower confidence and wait for price to prove whether the relationship matters today. If the index and context move together, a continuation plan has a better starting point. Context can filter a trade; it should not manufacture one.
How does the Tokyo session create the working range?
Mark the Tokyo session high and low, the prior-day extremes and the first clear displacement. The range itself is not a prediction. It is a map of where local liquidity may sit before Europe arrives. A later sweep of that range is useful because many traders can see the same boundary and place stops around it.
On the 15-minute chart, distinguish a wick from acceptance. A wick above the range that closes back inside is a candidate liquidity event. A close outside followed by a retest that holds is acceptance. I would rather miss a breakout than turn a still-forming wick into a completed signal. The liquidity sweep guide is the natural companion.
How does yen sensitivity change confirmation?
Use the yen as a disagreement detector. When JP225 and USDJPY support each other, I can accept a normal structure confirmation. When they diverge, I demand a cleaner reclaim, a closer target or no trade. This prevents the common mistake of treating intermarket context as a prediction engine.
VWAP can help with location, and VWAP is a useful source for what the measure actually represents. ATR gives movement context; the ATR guide explains why a stop should adapt to volatility rather than to a favorite number of points.

Automate your trades. Let Quantum Algo trade for you.
Every signal executed on your own account — 24/7, hands-off.
Which tools help with the Asia-to-Europe handoff?
The handoff deserves a fresh read. Do not carry a Tokyo long through Europe simply because the first session was bullish. Re-mark the active high and low, check whether the overnight move is extended, then wait for the next displacement or reclaim. A 1H bias can remain bullish while a 15m handoff produces a short-term sweep; the level and invalidation decide which matters.
The free entry-confirmation lesson is useful here. I also compare JP225 with the DAX session guide because both punish traders who confuse a session handoff with a simple clock-based entry.
What does a JP225 plus USDJPY setup look like?
Consider an illustrative 15-minute JP225 long. The 4H bias is bullish. Tokyo forms a 210-point range. During the Europe handoff, price dips 65 points below the Tokyo low, then closes back inside with bullish displacement. USDJPY is stable rather than aggressively fighting the move. The entry waits for a retracement into the reclaim zone.
The stop sits beyond the sweep low and the structure that makes the long thesis valid. The target sits near external liquidity. If your broker values one JP225 point at ¥10, the planned cash risk is ¥1,700 per unit before costs. A CFD feed may use a different point value, so use the contract panel rather than copying this number.
The example is intentionally ordinary. The edge is not the dramatic Japanese skyline or a special oscillator setting; it is the sequence of local range, handoff, context check, reclaim and fixed risk.
Which timeframe keeps JP225’s yen move readable?
Use 4H and 1H for bias, 15m for Tokyo structure and the handoff, and 5m only for entry refinement. A 1m chart can be useful for execution if your spread and feed are clean, but it should not be allowed to rewrite the 15m invalidation.
For a second index comparison, the NASDAQ guide shows why an open can behave differently on a US tech-heavy index. The market changes; the discipline of matching the tool to the auction does not.
How do you size JP225 when USDJPY is moving?
This JP225 plus USDJPY context tool is deliberately simple: it is not a second signal generator. Use it to decide whether the currency move supports the index idea at the session you are trading, then demand the sweep, displacement or reclaim described above.
Round down to the permitted size. The position-sizing lesson is worth revisiting because index point values vary more than the chart labels suggest.
Tokyo also rewards a clean separation between local structure and macro narrative. A headline can explain why the market moved, but it does not tell me where the stop belongs. The chart still has to show the level that failed, the level that reclaimed and the price that would invalidate the trade.
Check the symbol convention carefully. JP225, NI225, NK225 and Nikkei futures may use different decimals or cash representations. A point on one feed is not automatically the same cash amount on another. That is a contract question, not an indicator question.
When the Asia-to-Europe handoff is quiet, the correct output can be no trade. The absence of a fresh displacement is information. I would rather preserve the risk budget for a completed event than turn a thin handoff into a prediction exercise.
That is why I prefer a market-specific rule to a universal setting. The local auction, the instrument specification and the session context all change the meaning of a chart event. A serious review records those details before it records the result, then checks whether the same decision would still be reasonable on the next session. That is the difference between an indicator review and a screenshot collection. It gives the next decision a measurable standard.
When the evidence is mixed, the cleanest decision is often to wait. A missed entry costs less than an explanation built from hindsight. Patience is part of the system. The next clean session will still offer information. Review it calmly and keep the rule visible before each new London trade.
For JP225, that patience matters twice: first while Tokyo builds its local range, and again when Europe decides whether to extend or reverse it. A clean plan can survive both decisions because the invalidation remains explicit. The handoff is part of the setup, not an afterthought. Record both decisions in the journal. That keeps context factual instead of dramatic. It also makes the next review comparable. Keep the note short and specific. I would rather have a smaller, repeatable sample than a dramatic chart screenshot with no session labels.
One more practical check belongs in the Nikkei journal: write down the exact session boundary and the feed symbol before you evaluate the result. That small habit prevents a Tokyo range from being compared with a synthetic broker window. It also makes the handoff review easier to repeat.
Does QuantumBot handle a JP225 signal with yen context?
Automation solves execution, not market understanding. QuantumBot is Quantum Algo’s automated execution service: it trades the signals for the user where a supported connection is available. The service is $199/mo; cancel anytime. Keep symbol selection, contract verification and risk limits separate from the execution layer. If you prefer signal-assisted execution, compare the Zeno AI Agent with the current plans.
What should you verify before using a JP225 indicator?
Review JP225 in the timezone that your feed actually uses. Tokyo labels can be shifted by chart settings, daylight-saving changes elsewhere, or a CFD broker’s synthetic session. Write the local session range in your journal instead of trusting a copied template. A session-aware guide is only useful if the session on the chart is the session you think it is.
Record the Tokyo range width, the first sweep and whether the Asia-to-Europe handoff expanded or reversed it. Then add one short currency note: USDJPY supported the move, opposed it, or was neutral. That is enough context for most retail reviews. You are not trying to build a macro forecast; you are checking whether the price event had a confirming or conflicting backdrop.
Do not turn yen sensitivity into a correlation superstition. Markets can diverge for hours. The point is to increase the evidence standard when the relationship is fighting the trade, not to force an opposite position because two lines are moving differently. A good review can end with “context disagreed, no trade” and still be a successful process day.
Use replay for the handoff. Freeze the chart at the first Europe candle, make the decision from the range and structure available at that moment, and only then reveal the next candles. The Academy backtesting lesson helps avoid the hindsight problem that is particularly tempting on a fast index.
The Nikkei does not need a magical setting. It needs a local range, a completed event, a context check and cash risk that matches the contract. If the indicator cannot make those four facts visible, it is not the tool I would keep.
That distinction also keeps the Quantum Algo workflow honest. Free public indicators mark order blocks and FVGs; Zeno supplies confirmed signals with SL/TP and built-in risk management. The tool can organize the decision, but it cannot verify your local session, currency context or contract multiplier for you.
In review, save the Tokyo range and the handoff state before revealing the outcome. That record shows whether you followed the plan rather than whether the final candle happened to reward it.
The final test is repeatability: can another trader read the same range, identify the same invalidation and calculate the same cash risk without needing your hindsight? If yes, the indicator has earned a place in the process. If not, simplify the chart before adding another tool.
That is the standard I would use for a buyer-intent page: the recommendation must survive a chart replay, a contract check and a risk calculation. A polished label is not enough. The decision should still make sense after the excitement of the opening candle is gone. That is the difference between a tool and a process you can audit later, before any new trade.
The Nikkei 225 is a Tokyo-range and yen-sensitivity problem before it is an oscillator problem: the cleanest plan waits for local structure, checks the currency impulse, then reads the handoff into Europe. Mark the local range, wait for the active auction, require structure confirmation, use the market-specific context filter, place the stop beyond invalidation and size from cash risk. If you automate, automate a verified plan rather than a naked arrow.
◆ Interactive check
Can you read JP225 and USDJPY together?
Questions traders ask about Nikkei 225
There is no single magic oscillator. The strongest approach is a session-aware structure workflow that maps liquidity, confirms displacement or reclaim, uses VWAP or breadth as context, and sizes the stop from current volatility. Quantum Algo’s free public indicators mark order blocks and FVGs; Zeno adds confirmed Buy/Sell signals with SL/TP and built-in risk management.
VWAP is useful as an intraday location reference, not as a complete entry system. It can show whether price is accepting above or below an average, but it cannot tell you whether liquidity was swept, whether breadth agrees, or where the idea becomes invalid.
The most useful window is the local cash-market open and the first active overlap that follows it. Check the official exchange schedule, your broker chart timezone and daylight-saving changes; do not copy a fixed clock time from another feed.
Use 4H and 1H for bias, 15 minutes for the session structure, and 5 minutes only to refine a qualified setup. A 1-minute chart can help with execution, but it should not rewrite the higher-timeframe invalidation or the cash-risk calculation.
The free public Quantum Algo indicators mark Smart Money Concepts structures such as order blocks and fair value gaps. Zeno is the paid signal layer: it provides confirmed Buy/Sell signals with stop-loss, take-profit and built-in risk management; it does not draw those structures.
Quantum Algo is built for TradingView markets including indices. Test the exact symbol, exchange feed, point value and session representation supplied by your broker before committing capital.
The stop belongs beyond the price level that invalidates the idea, not at a fixed number copied from another trader. Use the session structure and current volatility to set the distance, then reduce position size when the stop is wider.
QuantumBot is the automated execution service that trades the signals for the user where a supported connection is available. It executes the signal plan; it does not replace symbol verification, contract selection, position sizing or the responsibility to check the connection.
Quantum Algo publishes a public timestamped ledger showing a 75% win rate across 140 posted trades, with 105 wins and 35 losses. That is a record to verify, not a promise for this index or for any individual account.
The logic can transfer, but the contract cannot be assumed to match. CFDs and futures can have different point values, spreads, trading hours and rollover behavior. Translate the chart stop into the exact cash value for the instrument you trade.
References & Related Guides
Read next
- Best Indicator for Nasdaq: Complete Guide
- Best Indicator for DAX (GER40): A Trading Plan
- VWAP Indicator: Complete Trading Guide
- ATR (Average True Range): Complete Guide
- Liquidity Sweep Trading Guide
- Smart Money Concepts Guide
Authoritative sources
- JPX: trading hours for domestic equities
- Nikkei Indexes: Nikkei 225 profile
- CME Group: Nikkei 225 futures
- JPX: Nikkei 225 micro futures
- JPX: Nikkei 225 futures specifications