CPR Indicator: Central Pivot Range Formula, Narrow vs Wide CPR and How to Trade It
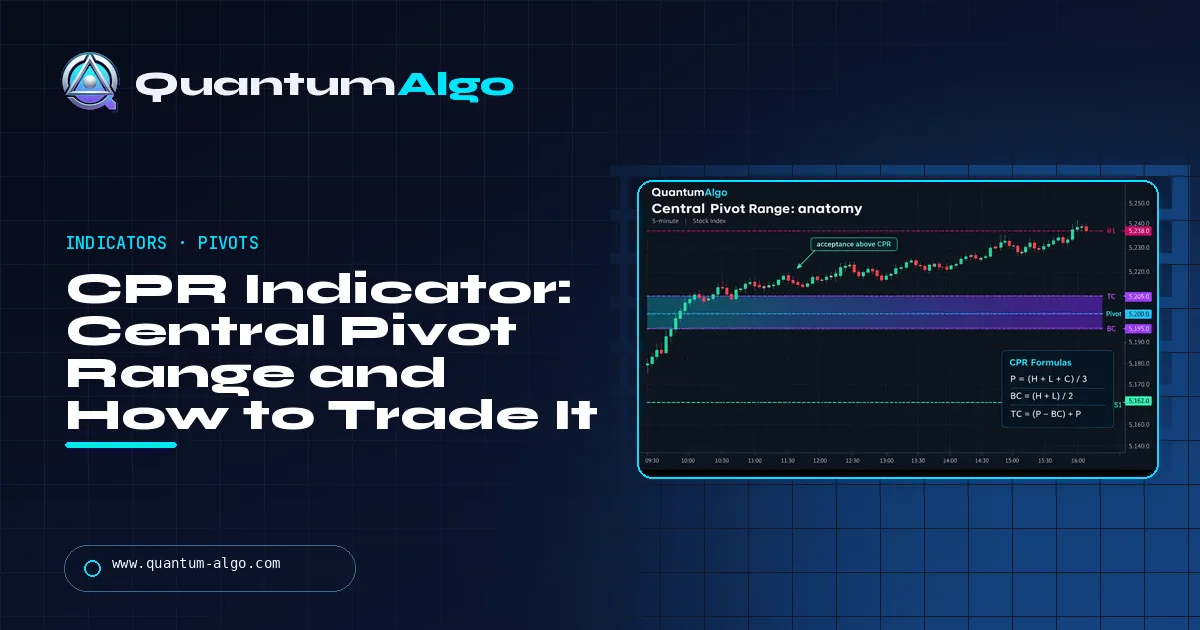
The CPR (Central Pivot Range) is a three-line band from yesterday's high, low and close: Pivot = (H+L+C)/3, BC = (H+L)/2 and TC = (Pivot − BC) + Pivot. Price holding above it favours longs, below it shorts. A narrow CPR often precedes a trending day; a wide one, a range. Popularised by Frank Ochoa (PivotBoss).
Most intraday levels tell you where price might react. The Central Pivot Range does that and one more thing: its width hints at what kind of day is coming before the market opens. It is three lines from three numbers, and the reason it works is a piece of arithmetic most guides skip — the width only measures where yesterday closed inside its own range. This guide covers what CPR is, the formulas, what narrow and wide really mean, a seven-step intraday routine, two-day relationships and virgin CPRs, the markets and session data it suits, a worked Nifty trend day, the common mistakes, and a calculator that turns yesterday's candle into today's plan.
Indicators that prove themselves in public.
One engine, four precision tools — the Gold (XAU) Scalper, the institutional Gravity Zone, the Zeno momentum Oscillator, and Zeno Stocks for equities.



What is the CPR indicator?
The Central Pivot Range (CPR) is a three-line band calculated from the previous session's high, low and close: the central pivot, the bottom central pivot (BC) and the top central pivot (TC). It was popularised by Frank Ochoa, who trades and teaches under the name PivotBoss, in his book Secrets of a Pivot Boss. The band is plotted on today's intraday chart before the first candle prints, and it does three jobs at once: it marks the area where yesterday's value sat, it gives a bias depending on whether price is above or below it, and its width hints at whether today is more likely to trend or to range.
CPR is especially popular with intraday traders of Nifty and Bank Nifty, where it is a standard part of the morning plan, but the maths works on any market with a clear session: index futures, stocks, gold, the major forex pairs. It is a sibling of the classic floor-trader levels covered in the pivot points guide; the difference is that CPR treats the pivot as a zone with a width rather than a single line, and that width is where most of its information lives.
How is the CPR calculated?
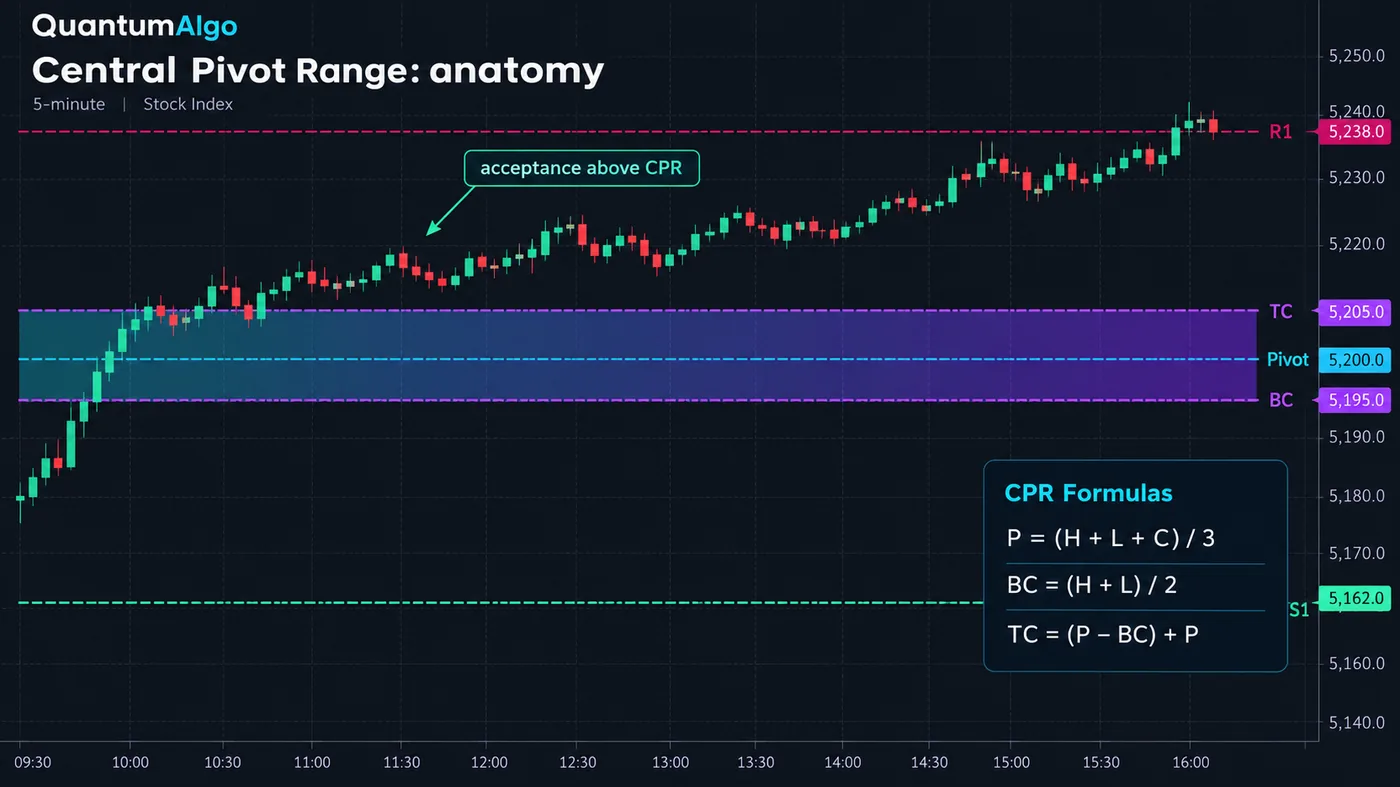
| Line | Formula | What it is |
|---|---|---|
| Pivot (P) | (High + Low + Close) ÷ 3 | The typical price of the previous session |
| Bottom central (BC) | (High + Low) ÷ 2 | The midpoint of the previous range |
| Top central (TC) | (Pivot − BC) + Pivot | The pivot reflected across itself |
| R1 / S1 (optional) | 2 × P − Low / 2 × P − High | The first classic pivot levels, for targets |
Depending on where yesterday closed, the TC formula can produce a number below BC. Ochoa's convention is simply to call the higher of the two TC and the lower BC, whichever formula produced it. The band then runs from BC to TC with the pivot in the middle.
There is a short piece of algebra that explains what the width really measures. Pivot minus BC works out to one third of the distance between yesterday's close and yesterday's midpoint, so the full width of the CPR is two thirds of the gap between the close and the middle of the range — which can never be more than a third of the range itself. Width therefore depends on two things: where yesterday closed and how big yesterday's range was. A narrow CPR comes from a balanced close near the midpoint, or from a small, sideways day — Ochoa's description is a market that traded sideways or consolidated. A wide CPR needs both a wide range and a close away from the middle: a day one side clearly won. Everything traders say about narrow and wide CPR follows from that.
What do narrow and wide CPR mean?
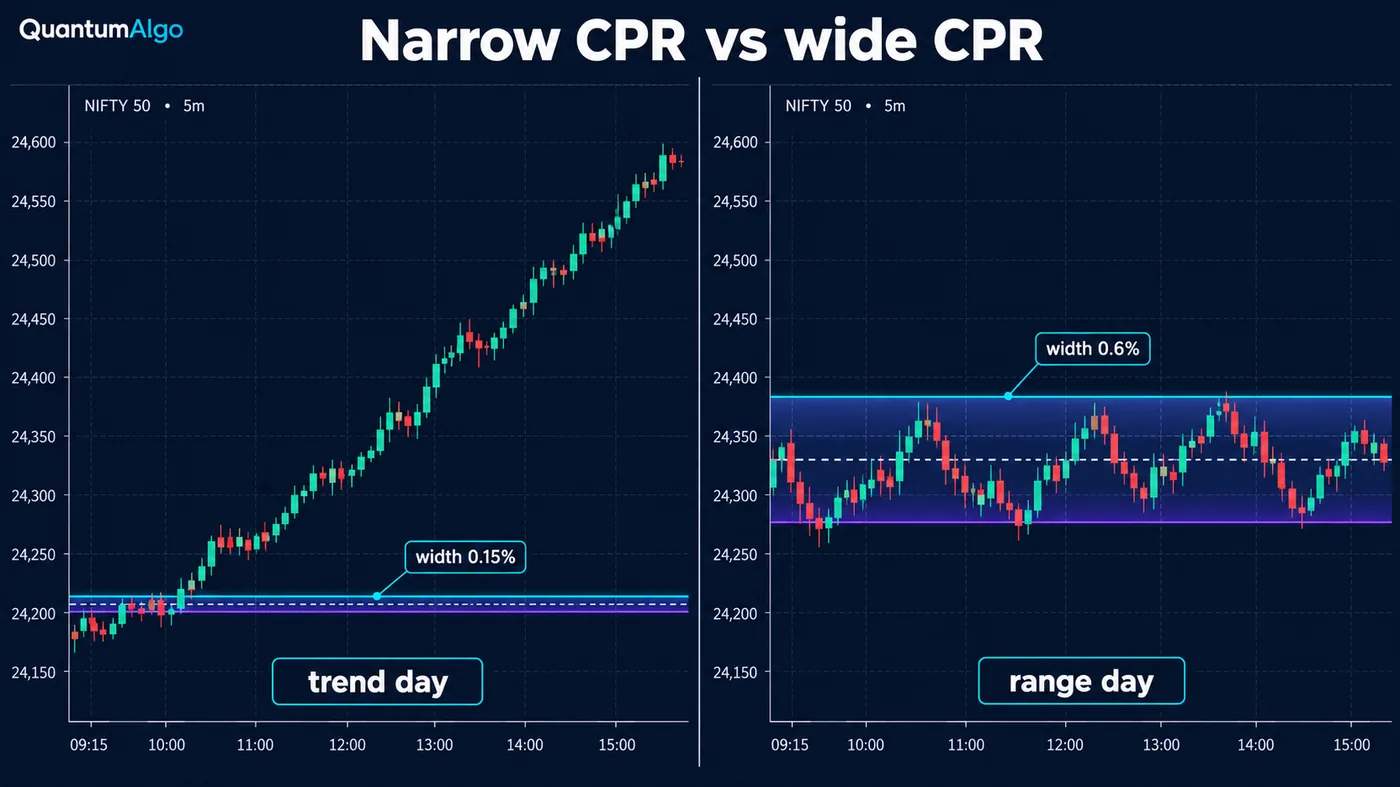
A narrow CPR is the classic trend-day setup. A balanced or compressed day leaves both sides undecided, and when today's open moves away from that balance, the move often runs: price leaves the band early, accepts outside it, and keeps going toward R1 or S1 and beyond. A wide CPR is the opposite: yesterday already made its directional move, and today tends to digest it, rotating back through the band and spending the session in a range.
Width is relative. A 0.15% CPR on Nifty is narrow; a 0.15% CPR on a slow forex pair may be normal. The cleanest way to judge is against the market's own recent widths — the narrowest fifth of the last 20 or 60 sessions is "narrow" for that market. As a rule of thumb for index futures, widths under about 0.2% of price are narrow and over about 0.5% are wide, and the calculator below uses those thresholds while reminding you to check your own market.

Automate your trades. Let Quantum Algo trade for you.
Every signal executed on your own account — on your account, with the plan you define.
How do you trade the CPR during the day?
- Mark the band before the open. TC, pivot and BC from yesterday's session high, low and close, plus R1 and S1 for targets.
- Judge the width. Narrow suggests a trend day is possible; wide suggests rotation. Compare with recent widths, not a fixed number.
- Watch the open relative to the band. An open above TC or below BC that holds for the first 15–30 minutes is acceptance away from value.
- Take the bias from acceptance, not from a touch. Above the CPR and holding → look for longs on pullbacks into TC; below and holding → shorts on rallies into BC.
- Use the far side as the invalidation. A long above the CPR is wrong if price closes back below BC; a short is wrong above TC.
- Target the next levels. R1/S1, the previous day's high or low, and the developing value of the session.
- Stand aside inside the band. Price rotating through a wide CPR has no agreement; that is a range-trading day or a day off.
What are two-day relationships and virgin CPRs?
Ochoa's framework also compares today's band with yesterday's, which he calls two-day pivot analysis. The relationship is a quick read on whether value is migrating:
| Today's CPR vs yesterday's | Read |
|---|---|
| Entirely above (higher value) | Value is moving up — bullish bias |
| Entirely below (lower value) | Value is moving down — bearish bias |
| Overlapping, slightly higher or lower | A mild lean in that direction |
| Inside yesterday's band (inside value) | Compression — breakout potential |
| Engulfing yesterday's band (outside value) | Balance — expect a range |
| Same as yesterday's (unchanged value) | Sideways — wait for the open to choose a side |
A virgin CPR is a band that price never touched during its own session. Because nobody traded at that value, traders keep it plotted forward as an untested level, and the first revisit often reacts. The same calculation also works on weekly and monthly data: a weekly CPR built from last week's high, low and close frames the whole week, and a daily setup that agrees with the weekly bias is the stronger one. For markets that trade around the clock, choose one session convention and stick to it — the New York close at 17:00 for forex, 00:00 UTC for crypto — because the high, low and close change with the cut-off.
Which markets does CPR suit?
| Market | Session data to use | Notes |
|---|---|---|
| Nifty / Bank Nifty | Cash session 09:15–15:30 IST | Where CPR is most widely used; pairs with the UT Bot and ORB plans |
| US index futures (ES, NQ) | Regular session or full Globex day — pick one | RTH levels react more cleanly at the cash open |
| Gold (XAUUSD) | New York 17:00 daily close | Wide CPRs are common after data days; respect them |
| Major forex pairs | New York 17:00 daily close | Narrow CPR into London open is the classic breakout setup |
| Crypto | 00:00 UTC daily close | Weekend sessions distort Monday's band; consider the weekly CPR |
For the Indian indices, the UT Bot settings for Nifty and Bank Nifty and the opening range breakout guide are the natural companions: CPR gives the morning bias, the opening range gives the first trigger. For US indices, the Nasdaq indicator guide covers the session behaviour CPR is applied to.
CPR calculator
Enter yesterday's high, low and close, and optionally the current price and yesterday's TC and BC. The calculator returns the three CPR lines, the width as a percentage of price, R1 and S1, today's bias from where price sits, and the two-day relationship if you gave yesterday's band.
Reference data
| Item | Value |
|---|---|
| Full name | Central Pivot Range (CPR), also called the pivot range |
| Popularised by | Frank Ochoa (PivotBoss), Secrets of a Pivot Boss |
| Inputs | Previous session high, low and close |
| Lines | Pivot = (H + L + C) ÷ 3; BC = (H + L) ÷ 2; TC = (P − BC) + P; higher of TC/BC is the top |
| Width | (TC − BC) ÷ Pivot × 100; equals two thirds of |close − midpoint| as a share of price |
| Narrow / wide (rule of thumb, index futures) | Under about 0.2% / over about 0.5% of price; compare with recent widths |
| Timeframes | Daily (intraday trading), weekly (swing), monthly (position) |
| On TradingView | Community "CPR" and "Pivot Range" scripts; the built-in Pivot Points Standard plots the classic levels |
| Checked | October 2026 |
Worked example: a narrow CPR trend day
An illustrative Nifty session, with round numbers to show the method. Yesterday's high was 24,950, the low 24,700 and the close 24,830. The pivot is (24,950 + 24,700 + 24,830) ÷ 3 = 24,826.7; BC is (24,950 + 24,700) ÷ 2 = 24,825; TC is 24,826.7 × 2 − 24,825 = 24,828.3. The band is barely three points wide — about 0.01% of price — because yesterday closed almost exactly at the middle of its range. R1 is 24,953.3 and S1 is 24,703.3.
The index opens at 24,880, well above the band, and the first 15-minute candle holds above TC. That is acceptance above a very narrow CPR — the textbook trend-day condition. The trader looks for a long on the first pullback toward the band rather than chasing the open: price dips to 24,845, prints a higher low on the 5-minute chart and breaks the opening high. The stop goes below BC at 24,815; the first target is R1 at 24,953, and the remainder is trailed under 5-minute swing lows. Had the index opened inside the band and rotated through it for the first hour, the same narrow CPR would have meant nothing — width is a forecast, acceptance is the confirmation.
What mistakes do traders make with CPR?
- Treating a narrow CPR as a guaranteed trend day. It raises the odds; the open and the acceptance decide.
- Buying the first touch of TC from above without waiting to see whether price holds.
- Using different session cut-offs on different days, which changes the band without the market changing.
- Fixed width thresholds copied from another market. Judge width against the instrument's own history.
- Trading inside a wide CPR as if it were a trend day. Wide bands are rotation days.
- Ignoring the higher timeframe. A daily long against a falling weekly CPR is a counter-trend trade.
- Stacking CPR, classic pivots, Camarilla and Fibonacci levels until every price is a level.
How does CPR fit with structure and the free indicators?
CPR tells you where yesterday's value sits and how likely today is to leave it; structure tells you when it actually does. The Institutional Key Levels script plots the previous day's and week's highs and lows that sit beyond R1 and S1, the SessionScope script marks the session windows that decide the open, and the Smart Money Concepts Engine prints the break of structure that turns acceptance into a trade. Zeno, the premium engine, prints the buy or sell signal with its own stop and targets, which a CPR bias filters: take the signals that agree with the side of the band price has accepted. For the classic floor levels behind R1 and S1, the pivot points guide covers Standard, Fibonacci, Woodie, Camarilla and DeMark side by side.
CPR is three lines from yesterday's high, low and close, and its width is two thirds of the gap between the close and the midpoint — so it reflects both where yesterday closed and how far it ranged. Narrow bands set up trend days, wide bands set up ranges, but acceptance above or below the band is the confirmation. Use one session convention, judge width against the market's own history, check the weekly CPR, and let structure decide the entry.
◆ Interactive check
Can you read the Central Pivot Range?
Questions traders ask about the CPR indicator
The Central Pivot Range is a band of three lines — top central (TC), pivot and bottom central (BC) — calculated from the previous session's high, low and close, used to set intraday bias and anticipate trend or range days.
Pivot = (High + Low + Close) ÷ 3; BC = (High + Low) ÷ 2; TC = (Pivot − BC) + Pivot. If TC comes out below BC, the higher value is used as the top and the lower as the bottom.
Yesterday was balanced — it closed near the middle of its range, or its range was small. A narrow band often precedes a trending or breakout day, especially when price opens away from the band and holds there.
Yesterday had a wide range and closed well away from its midpoint, so the directional move has already happened. Wide bands tend to precede rotational, range-bound sessions.
Mark the band before the open, judge the width, wait for price to accept above TC or below BC, take pullback entries in that direction, use the opposite side of the band as invalidation, and target R1/S1 and the previous day's high or low.
A CPR that price never touched during its own session. Traders plot it forward as an untested value area, and the first revisit often produces a reaction.
It is one of the most widely used intraday tools for the Indian indices. Use the cash-session 09:15–15:30 IST high, low and close, and combine the CPR bias with an opening-range or structure trigger.
Classic pivot points are single lines (P, R1–R3, S1–S3). CPR treats the pivot as a zone between BC and TC, and the width of that zone carries information about the coming session that a single line cannot.
Yes. Build it from the previous week's or month's high, low and close. The weekly CPR frames the week, and daily setups that agree with it are the stronger ones.
CPR works as a bias filter on TradingView alongside the free key-level, session and structure indicators. Zeno prints its own buy and sell signals with a stop and targets, and the CPR side price has accepted is a sensible filter for which signals to take.
References & Related Guides
Read next
- Pivot Points Guide
- UT Bot Settings for Nifty & Bank Nifty
- Opening Range Breakout (ORB)
- Best Indicator for NASDAQ
- Support and Resistance
- VWAP Guide
- Day Trading Strategies
- Range Trading Strategy
- Breakout Trading Strategy
- Market Profile Trading
- Institutional Key Levels (free indicator)
- Zeno — the premium engine