The Best Forex Indicator: Trading Session Liquidity & the London Killzone
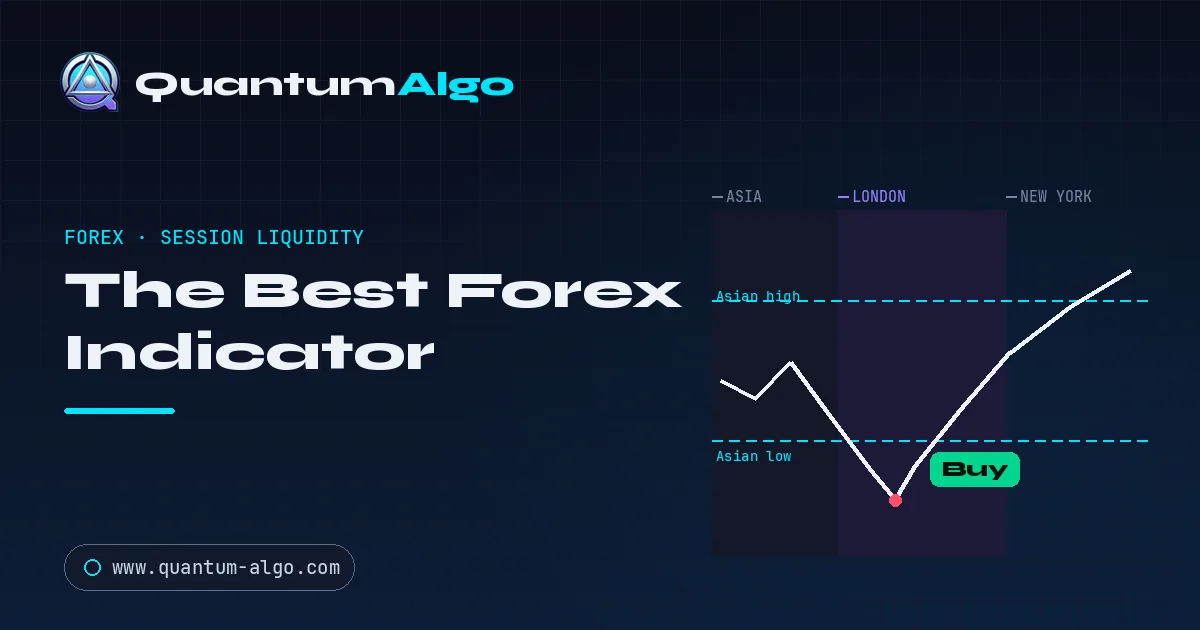
The best forex indicator reads session liquidity, not momentum: Asia builds a range, London sweeps the stops beyond its high or low, and New York carries the trend. Setups cluster in the London and New York killzones, each session's first hours. A Smart Money Concepts structure engine marks the range, flags the sweep and prints a non-repainting entry after structure breaks.
Forex runs on a clock, not on a signal. The same currency pair behaves completely differently at 3am, at the London open, and during the New York overlap — because the market's liquidity moves around the globe with the trading sessions. The reason most "best forex indicator" lists disappoint is that they hand you a tool that ignores this entirely: an oscillator reads the same "overbought" in dead Asian hours as it does in a London stop-run. The best forex indicator is the one that reads session liquidity — where the day's stops are engineered and swept — which is exactly what Quantum Algo is built to do.
Indicators that prove themselves in public.
One engine, four precision tools — the Gold (XAU) Scalper, the institutional Gravity Zone, the Zeno momentum Oscillator, and Zeno Stocks for equities.
This guide is about how currency pairs actually trade through the day: the session rhythm, the killzones where the real moves are made, and how a Smart Money Concepts engine turns that structure into non-repainting entries with a verified public record. If you keep getting stopped out minutes before your idea works, the problem usually isn't your idea — it's that you're trading against the session's liquidity instead of with it.
| What actually drives FX | Session liquidity — the day's stops engineered and swept across Asia, London and New York |
| What it is | A Smart Money Concepts structure engine that reads session liquidity, not a mean |
| Best for | Major, minor and cross FX pairs on TradingView — any timeframe, session-aware |
| Reads | Session highs/lows, order blocks, FVGs, liquidity sweeps, BOS / CHoCH, MTF bias |
| Signals | Non-repainting, close-confirmed Buy / Sell with exact entry, stop, two targets |
| Proof | Public, timestamped record — 75% win rate over 160 closed signals |
Why do sessions matter more than signals in forex?
Currencies trade 24 hours across three overlapping sessions, and each has a distinct character. Asia is typically quiet and range-bound — it builds a tight range whose high and low become obvious liquidity pools. London is the powerhouse: it opens into that Asian range and very often sweeps one side of it — running the stops beneath the Asian low or above the Asian high — before revealing the day's real direction. New York overlaps London for a few hours of peak liquidity and then carries or reverses the move. This is not folklore; it's a consequence of when the largest bank and institutional desks are active and where the day's resting orders sit. An indicator blind to the session clock is blind to the single biggest driver of intraday FX.
Why do the best forex setups cluster in the killzones?
The highest-probability forex setups cluster in the London and New York "killzones" — the first hours of each session, when liquidity is deep enough for institutions to fill size and the day's stop-runs happen. Here is the pattern that repeats across pairs, day after day.
Asia sets the range and the liquidity. London opens and drives price below the Asian low, triggering the sell-stops resting there — the liquidity grab that traps breakout sellers and fills institutional buys at a discount. Structure then breaks to the upside, and New York rides the trend. Quantum Algo marks the Asian range as liquidity, flags the sweep, waits for the break, and prints the entry inside the order block — so you're positioned with the desks, not sitting in the stops they came to take.
Why do lagging indicators fail on currency pairs?
FX punishes lagging tools harder than most markets for concrete reasons. Pairs are mean-reverting intraday but trending across sessions, so an oscillator that fades every "overbought" gets steamrolled the moment London trends. Spreads are tight but news spikes are brutal — a central-bank surprise or data release moves a pair 80 pips in seconds, blowing through any moving average.
And because FX is the deepest, most liquidity-driven market on earth, its moves are engineered around obvious levels more cleanly than anywhere: the Asian high, the prior day's high, the round number. RSI, MACD and moving averages read none of this; they read a smoothed version of price and arrive after the session's real move is done. The gap between "price is stretched" and "the sell-side liquidity beneath the Asian low just got swept" is the gap between a lagging indicator and a structure engine.
| Standard oscillators | Quantum Algo (SMC) | |
|---|---|---|
| Reads | Momentum vs. recent average | Session liquidity & structure |
| Session awareness | None — same read all day | Asia range, London/NY killzones |
| Liquidity | Blind to session stops | Maps and reads the sweep |
| News spikes | Whipsawed | Reads the sweep, waits for structure |
| Trend context | Single timeframe | Multi-timeframe confluence |
| Output | A line to read | Entry, stop, two targets |
How Quantum Algo maps session liquidity
Quantum Algo is one engine with four tools, tuned for the session rhythm. The Structure engine marks the Asian range, grades the order block the sweep leaves behind, and confirms the break of structure that reveals the day's direction. The Gravity Zone highlights the session highs and lows price is drawn toward — the exact liquidity the killzone move targets. The Oscillator adds exhaustion confluence on the reversal candle only. The multi-timeframe panel keeps your entry aligned with the daily bias, so you take the London long only when the daily supports it. The output is one non-repainting signal with an exact stop and two targets — the reading is session-aware and institutional, the decision is simple.
Does the method differ between majors and crosses?
The method spans the FX board, with nuances. Majors (EUR/USD, GBP/USD, USD/JPY) have the deepest liquidity and the cleanest session sweeps — the best place to learn the pattern. Crosses (EUR/GBP, AUD/JPY) trend well but move on two economies' news, so bias work matters more. On all of them, scheduled news is a discipline problem, not an indicator problem: no tool predicts a rate decision, so the professional approach is to be flat into high-impact releases and trade the structure that forms afterward, once the new range and its liquidity establish. Quantum Algo's job is to read the engineered move around the session and the news, not to guess the number — and that's precisely where its edge lives.
USD/JPY also leaks into the equity board: the same yen move that shapes a Tokyo-session sweep often decides whether a Nikkei breakout holds, which is why the JP225 indicator plan with yen context reads the pair before the index.
The public record
Anyone can post a screenshot of a caught London reversal. Quantum Algo posts its public Zeno calls on TradingView with a timestamp before the outcome, kept permanently — wins, losses and breakevens, never edited. Across the full record: a 75% win rate over 160 closed signals, 2.3:1 planned risk-to-reward. The curve below shows disciplined 1%-per-trade sizing applied to an edge like that.
The drawdowns are the honest part — a run of stopped sweeps during a choppy, news-heavy week is normal, and the edge lives in the large sample. What compounds the account is pairing the session-aware signals with fixed-fractional risk management: the tool finds the killzone setup, your sizing turns it into a curve.
What does a session-based forex workflow look like?
Set the daily bias on the multi-timeframe panel before the session. Mark the Asian range — its high and low are the day's first liquidity pools. Wait for the London killzone: expect a sweep of one side of the Asian range and don't chase the initial spike. Enter on the close-confirmed signal after the sweep and the break of structure, inside the order block, with a stop beyond the swept extreme. Manage into New York, moving to breakeven at the first target and letting the second run. Stay flat into scheduled news and journal the session and pair with every trade — your edge will concentrate around specific pairs and windows.
How do you backtest forex strategies honestly?
Because Quantum Algo doesn't repaint, you can scroll back through any pair and see every session sweep and signal exactly as it printed. Test with the clock in mind: tag each trade by session, because a setup that's high-probability in the London killzone is a coin flip in dead Asian hours, and mixing them will muddy your stats. Record at least fifty trades with fixed risk and track win rate, average R and maximum drawdown together. If your numbers track the public ledger, the edge is real in your hands. The best forex indicator isn't the one with the most lines on the chart — it's the one that reads the session's liquidity so you take the London sweep instead of getting taken by it.

Automate your trades. Let Quantum Algo trade for you.
Every signal executed on your own account — 24/7, hands-off.
Frequently Asked Questions
The best forex indicator reads session liquidity — where the day's stops are engineered and swept across the Asia, London and New York sessions — rather than momentum. Quantum Algo is a Smart Money Concepts engine that maps the session ranges, order blocks and liquidity sweeps, confirms with structure, and fires non-repainting signals with a defined plan, backed by a 75% win rate over 160 closed signals.
Usually because your stop sits in an obvious session liquidity pool — under the Asian low or prior-day low — that London is engineered to sweep before the real move. Reading the session structure and placing entries after the sweep, with stops beyond it, flips you to the side the sweep is fueling.
Killzones are the first hours of the London and New York sessions, when liquidity is deep enough for institutions to fill size and the day's stop-runs happen. The highest-probability setups cluster there; setups in low-liquidity hours between sessions are far less reliable.
They lag and are session-blind — they read the same 'overbought' in dead Asian hours as in a London trend, and get whipsawed by news spikes. They can add minor confluence but underperform a session-aware structure approach as standalone triggers.
Yes — majors, minors and crosses on TradingView, on any timeframe. Majors like EUR/USD have the deepest liquidity and cleanest session sweeps and are the best place to learn the pattern; crosses trend well but require more bias work because they move on two economies' news.
No indicator predicts a rate decision or data surprise, so the professional approach is to be flat into high-impact releases and trade the structure that forms afterward, once the new range and its liquidity establish. Quantum Algo reads the engineered move around the news, not the number itself.
No. Every signal is confirmed on candle close and never changes, which is essential for honest backtesting — you can scroll back through any pair and see each session sweep and signal exactly as it printed.
It works on any timeframe, but the session logic is clearest on 15-minute to 1-hour charts, where the Asian range, London sweep and New York trend are easy to see. Higher timeframes give the bias; the entry timeframe is where you read the killzone.
The public record shows a 75% win rate over 160 closed signals at a 2.3:1 planned risk-to-reward. Your results depend on trading with the daily bias, taking setups in the killzones, staying flat into news, and using fixed-fractional risk. The verifiable ledger is how you judge the edge.
Where a broker webhook is supported, signals route to automated execution with stop-loss, take-profit and breakeven handling. Otherwise you receive the same signals as TradingView push notifications with the full trade plan to execute manually.
Matrix is $19/month for core signals, Atlas $39/month for the full SMC toolkit with filtering and backtesting, and Zeno $79/month for professionals with exact trade plans and the premium suite. Annual billing saves 25%, and every plan includes the public track record.
References & Related Guides
More in this topic
- Forex Market Hours: When the Forex Market Opens, Closes and Actually Moves
- Best Forex Pairs to Trade: By Session, Spread, Volatility and Style
- Best Forex Brokers: How to Choose One That Protects Your Money (US, UK/EU/AU and Everywhere Else)
- How Many Trading Days Are in a Year? (Calendar, by Market, Calculator)
- Lot Size Calculator for Forex and Gold: Size the Trade from the Stop, Not the Ticket
- Pip Value Calculator for All Forex Pairs (Formula + Free Tool)
- ADX Indicator: Complete Trading Guide
- AlphaTrend Indicator: Complete Trading Guide
- ATR (Average True Range): Complete Trading Guide
- Awesome Oscillator: Complete Indicator Guide
- What Are the Best Volume Indicators?
- Bollinger Bands — Complete Trading Indicator Guide
- CCI Indicator: Complete Guide
- Chandelier Exit: Complete Trading Guide
- Donchian Channels: Complete Indicator Guide
- Fibonacci Bollinger Bands: Complete Trading Guide
- Fibonacci Retracement — Complete Trading Guide
- Hull Moving Average (HMA): Complete Trading Guide
- Gaussian Channel Indicator Guide
- Best Buy/Sell Indicator Guide
Core reading
- BOS & CHoCH: Complete Market Structure Guide
- Order Blocks Trading: Complete Guide
- Best TradingView Indicators — Complete Guide
- Risk Management in Trading — Complete Guide
- Candlestick Patterns Guide — Engulfing, Pinbar & More
- All Premium Guides
- Quantum Algo on TradingView
- Public Track Record
Authoritative sources
For the next decision, continue with automated forex execution and keep the execution rule separate from the context.