ICT IPDA: Data Ranges, Look-Back and Cast-Forward Explained
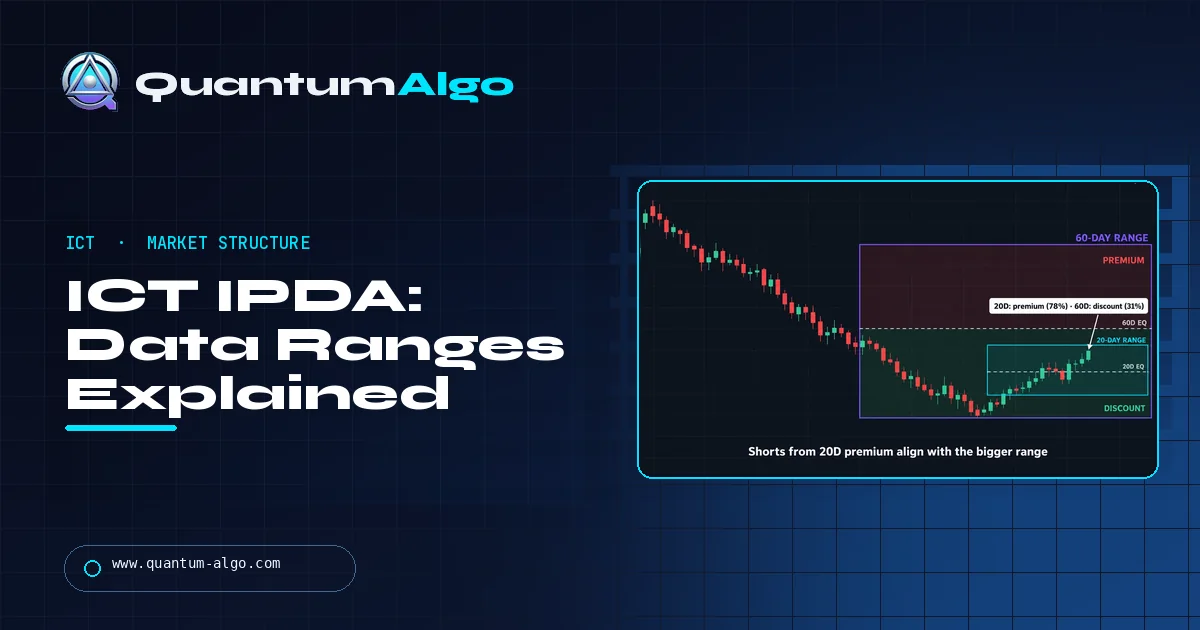
ICT IPDA (Interbank Price Delivery Algorithm) is Michael Huddleston's framework claiming price seeks liquidity and rebalances inefficiencies using recent daily data. Traders mark the highest high and lowest low of the last 20, 40 and 60 trading days, plus each range's 50% equilibrium, to find liquidity targets and judge premium or discount. It is a teaching model, not a verified institutional algorithm.
Most explanations of ICT's IPDA either treat it as gospel or dismiss it as nonsense. Neither helps you trade. Underneath the jargon is a concrete, checkable routine: mark the highs and lows of the last 20, 40 and 60 trading days, find the midpoint of each range, and decide whether price is cheap or expensive. This Quantum Algo guide explains exactly what ICT teaches about data ranges, look-back, cast-forward and quarterly shifts, works through a full EURUSD example, and gives you a calculator plus an honest look at the evidence.
Indicators that prove themselves in public.
One engine, four precision tools — the Gold (XAU) Scalper, the institutional Gravity Zone, the Zeno momentum Oscillator, and Zeno Stocks for equities.
What does ICT mean by IPDA?
IPDA stands for Interbank Price Delivery Algorithm. The term comes from Michael J. Huddleston, who teaches as The Inner Circle Trader (ICT), and it sits underneath most of his other concepts. His claim is that price in the major markets is not delivered randomly but by an algorithm that repeatedly does two jobs: it seeks liquidity (the stop orders and resting orders above old highs and below old lows), and it rebalances inefficiencies (the fast, one-sided moves he calls fair value gaps).
In ICT's model, that algorithm doesn't look at the whole history of a market. It references a limited window of recent daily data, and he gives those windows specific lengths: 20, 40 and 60 trading days. The highs and lows inside those windows become the reference points price is expected to reach for, and the midpoint of the range splits it into premium (expensive) and discount (cheap) halves.
◆ Read this first: IPDA is ICT's framework and terminology. No exchange, bank or regulator has published or confirmed a single algorithm that delivers price across the interbank market, and ICT has not released code or test results for one. This guide explains accurately what he teaches and how traders apply it, then looks honestly at the evidence. If you want background on the teacher himself, see our profile of ICT, Michael Huddleston.
You don't need to believe in a literal algorithm to get something out of the idea. Strip away the name and what remains is a disciplined way to answer two questions every trader faces: where is the obvious liquidity on the daily chart, and is price currently cheap or expensive relative to its recent range? Those questions are useful under any theory of how markets work.
What are the IPDA data ranges of 20, 40 and 60 days?
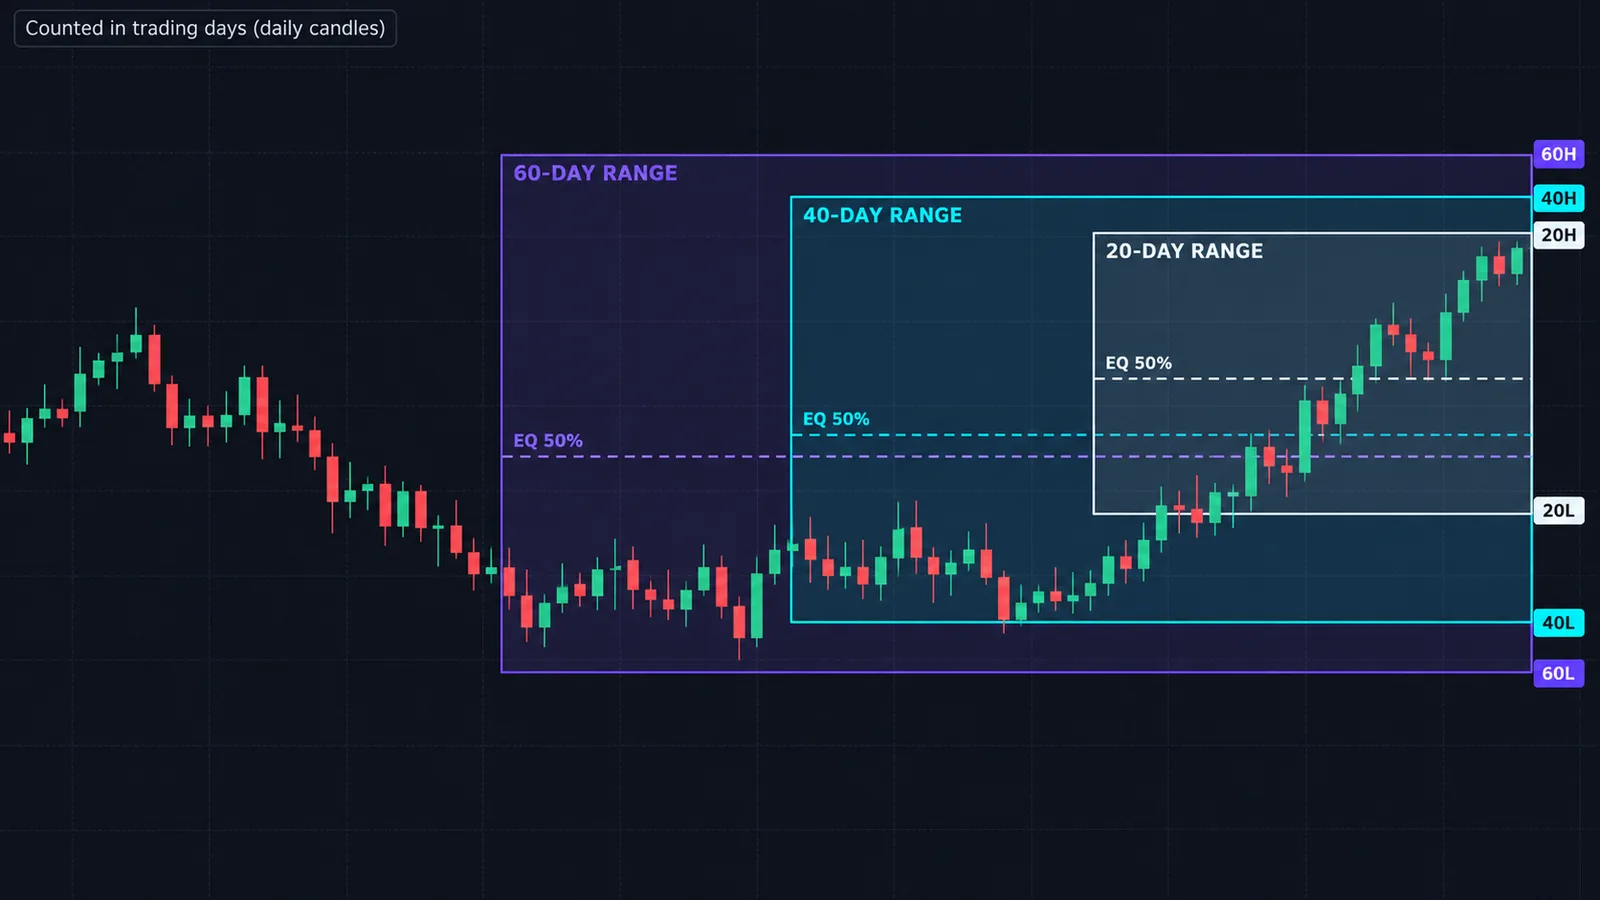
The data ranges are three look-back windows counted in trading days, meaning daily candles, not calendar days. Roughly, 20 trading days is a month, 40 is two months, and 60 is a quarter.
| Range | Approx. calendar span | What traders use it for |
|---|---|---|
| 20-day | About 1 month | Nearest liquidity targets; short-term swing bias |
| 40-day | About 2 months | Intermediate targets once the 20-day extreme is taken |
| 60-day | About 1 quarter | Major reference high and low; where quarterly moves tend to aim |
For each window you record three numbers: the highest high, the lowest low, and the midpoint between them (equilibrium). That gives you nine levels in total, though they often overlap. In a strongly trending market, the 20-day low might also be the 40-day low. In a range, the 60-day high and low can sit untouched for weeks while price rotates inside the 20-day range.
The typical ICT reading goes like this. Price runs the liquidity beyond a 20-day high or low, often in a false break, then reverses and travels toward the opposite side, with the 40-day or 60-day extreme as the bigger objective. Each data range is, in effect, a ladder of targets. Our liquidity trading guide explains why those old highs and lows attract price in the first place: they're where stop-loss and breakout orders pile up.
How do you count? Practitioners generally treat the most recently closed daily candle as day 1 and count backward. Whether you include today's still-forming candle is a choice; we exclude it, so the levels don't move during the session.
How do look-back and cast-forward work?
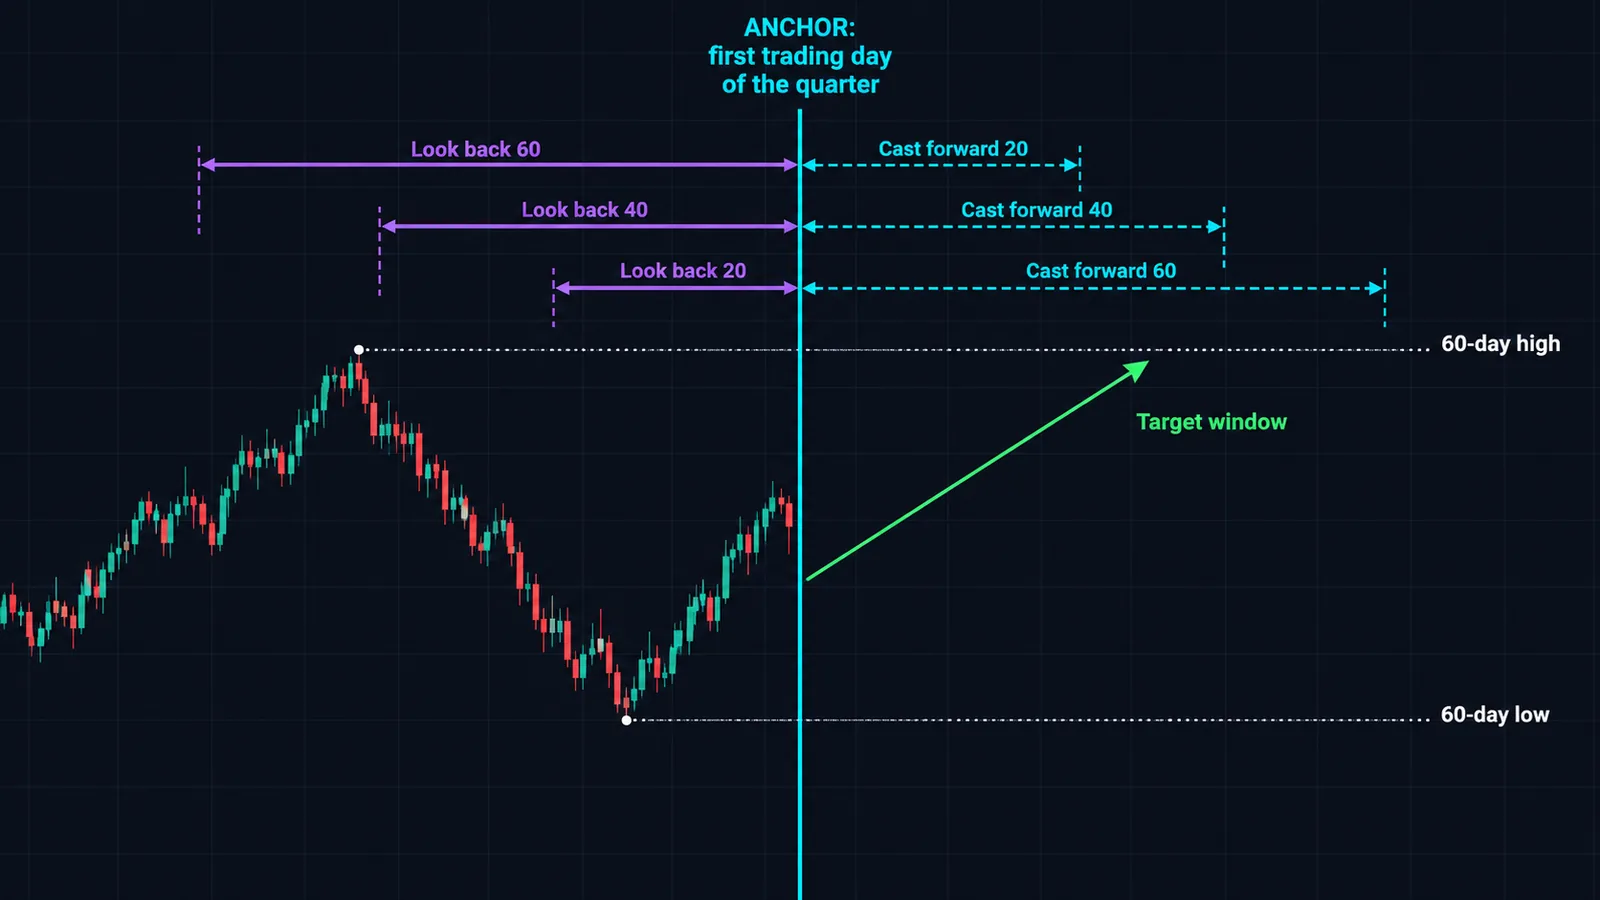
ICT teaches the data ranges as a pair of operations around an anchor date. In his 2016 mentorship lesson on quarterly shifts and IPDA data ranges, the anchor is the first trading day of the month you're studying, marked with a vertical line on the daily chart.
Look back
From the anchor, you look back 20, 40 and 60 trading days. Within those windows you note the significant highs and lows, along with the order blocks and fair value gaps that formed there. You also note the general direction: has price been trending higher or lower over the last 60 days? These are the reference points the "algorithm" is said to be working with.
Cast forward
From the same anchor, you project 20, 40 and 60 trading days into the future. This isn't a price forecast. It's a time window. The idea is that the levels found in the look-back are likely to be revisited, or that a meaningful directional shift may occur, within the cast-forward window. So if you anchor on the first trading day of a quarter, the 60-day cast-forward covers roughly that whole quarter.
| Step | Direction | Output |
|---|---|---|
| Mark anchor | First trading day of the month or quarter | Vertical line |
| Look back 20/40/60 | Into the past | Highs, lows, PD arrays, recent bias |
| Cast forward 20/40/60 | Into the future | Time windows for those levels to be targeted |
In day-to-day use, many traders simplify this into a rolling look-back: every morning, they recompute the 20/40/60-day highs and lows from the latest closed candle. That's what the calculator below does. The anchored version is more faithful to the original lesson and is better for planning a whole quarter; the rolling version is easier to keep current.
What is an IPDA quarterly shift?
ICT observes that markets tend to make a significant directional change, or switch from trending to consolidating, every three to four months. He calls this the quarterly shift. The 60-day data range is roughly one quarter long, which is why the two ideas are taught together: the 60-day look-back tells you what happened in the last quarter, and the 60-day cast-forward frames the next one.
In practice, a quarterly shift tends to show up like this on a daily chart. Price spends weeks pushing in one direction and eventually takes out an obvious 40-day or 60-day extreme. Instead of continuing, it stalls, breaks a recent daily swing in the opposite direction, and begins working toward the other side of the range. The shift is only visible as a pattern after it has started, which is the honest limitation: the concept tells you to expect a turn every few months, not when exactly it will come.
Some traders combine this with time-based models that split the year, month, week and day into quarters. If that interests you, our ICT quarterly theory guide covers that framework, and the Power of Three (AMD) guide explains the accumulation, manipulation and distribution sequence many ICT traders expect inside each period.
▲ Practical use: at the start of each calendar quarter, redo the full 60-day look-back. If price is already deep in premium of the 60-day range after a long rally, the odds that the next quarter brings a meaningful pullback are higher than when price sits mid-range. That's a bias, not a trigger.
How do the data ranges link to premium, discount and equilibrium?
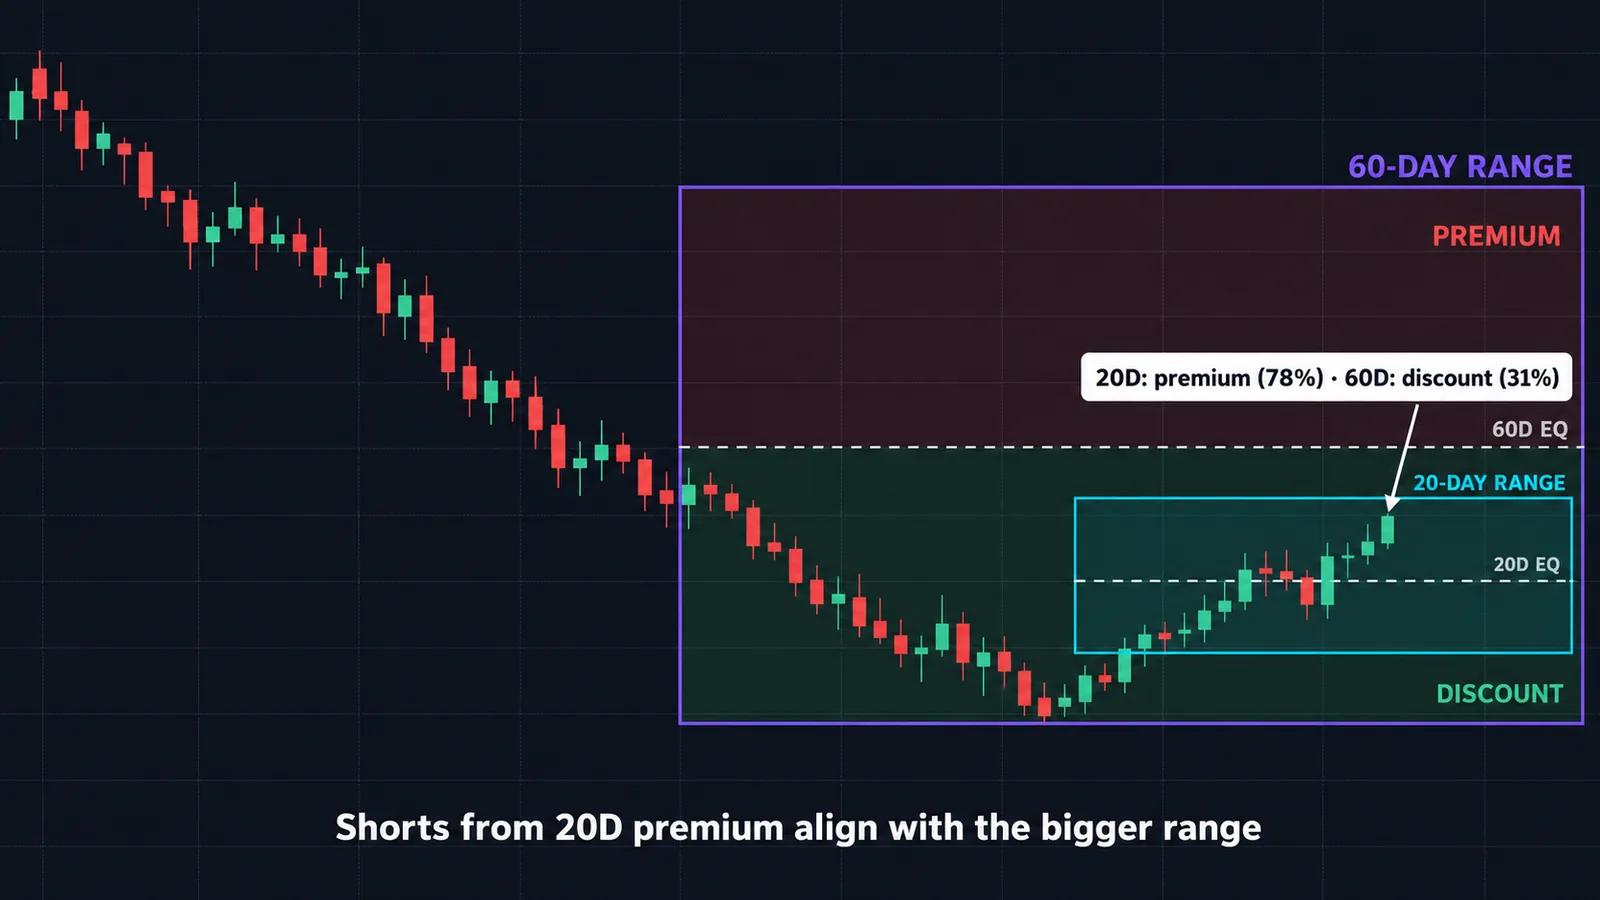
Every data range has a midpoint, which ICT calls equilibrium. Above it is premium, below it is discount. The formula is simple:
Equilibrium = (N-day high + N-day low) ÷ 2Position % = (Price − N-day low) ÷ (N-day high − N-day low) × 100A position above 50% is premium; below 50% is discount. ICT's rule of thumb is to look for buys in discount when the bias is bullish and sells in premium when the bias is bearish. Buying in premium means you're paying up near the obvious stop-loss cluster above, which shrinks your reward and puts your stop where it is most likely to get run.
The useful twist that the data ranges add is that "premium" depends on which range you're looking at. Price can be in premium of the 20-day range and in discount of the 60-day range at the same time. That disagreement is information. It usually means a short-term rally inside a bigger decline, or a pullback inside a bigger rally.
| 20-day | 60-day | Typical reading |
|---|---|---|
| Premium | Premium | Extended; avoid fresh longs, watch for buy-side runs and reversals |
| Discount | Discount | Washed out; avoid fresh shorts, watch for sell-side runs and reversals |
| Premium | Discount | Bounce inside a bigger decline; shorts from 20-day premium align with the larger range |
| Discount | Premium | Pullback inside a bigger rally; longs from 20-day discount align with the larger range |
Many ICT traders also pin the optimal trade entry zone (the 62% to 79% retracement band) on the leg into these levels. Our premium and discount zones guide and OTE guide go into those tools in detail.
Worked example: reading EURUSD with the three ranges
Here are the numbers from the sample data loaded in the calculator. Think of it as EURUSD on the daily chart, with the current price at 1.1695.
| Range | High | Low | Equilibrium | Price position |
|---|---|---|---|---|
| 20-day | 1.1720 | 1.1580 | 1.1650 | 82.1% (premium) |
| 40-day | 1.1785 | 1.1520 | 1.16525 | 66.0% (premium) |
| 60-day | 1.1840 | 1.1460 | 1.1650 | 61.8% (premium) |
The 20-day math: the range is 1.1720 − 1.1580 = 0.0140 (140 pips). Price sits 1.1695 − 1.1580 = 0.0115 above the low, so its position is 0.0115 ÷ 0.0140 = 82.1%. The 40-day range is 265 pips and the 60-day range 380 pips, giving 66.0% and 61.8%.
What it tells you
Price is in premium on all three ranges and only 25 pips below the 20-day high. In ICT terms, the nearest draw on liquidity is the buy-side resting above 1.1720. Beyond it sit the 40-day high (1.1785) and the 60-day high (1.1840). Starting a fresh long here means buying expensive with the obvious stop cluster just overhead, which is the opposite of what the framework recommends.
Two ways to plan it
Plan A, the sweep-and-reverse short. Wait for price to run above 1.1720. Say it spikes to 1.1738, then on the 15-minute chart it breaks a recent swing low (a market structure shift) and you sell a retrace at 1.1725. A stop above the sweep high at 1.1745 risks 20 pips. The first target is the 20-day equilibrium at 1.1650, which is 75 pips away, or 3.75R. A runner can aim for the 20-day low at 1.1580 (145 pips, about 7R).
Position size on a $50,000 account risking 1% ($500): at roughly $10 per pip per standard lot on EURUSD, a 20-pip stop costs $200 per lot, so you trade 2.5 lots.
Plan B, the discount long. If price instead pulls back below 1.1650 without first running the high, you're in 20-day discount while still in the upper half of the 60-day range. That's the "pullback inside a bigger rally" case from the table above, and a bullish fair value gap or order block in that area becomes a candidate entry, targeting 1.1720 and then 1.1785.
Notice what the ranges did. They didn't predict direction. They told you where you'd be willing to act and where you wouldn't, and they handed you objective targets. That alone tends to improve trade selection.
How do you mark IPDA ranges on TradingView?
You can do it by hand in about two minutes per chart, or use a script. By hand:
- Switch to the daily chart. Check what time your data feed starts each daily candle, and whether it prints a short Sunday candle. Some forex feeds do, and that adds an extra bar to every count.
- Place a vertical line on your anchor. For the rolling version that's the last closed candle; for the anchored version, the first trading day of the month or quarter.
- Use the Date and Price Range tool from the measuring tools and drag it back from the anchor until the bar count reads 20. Note the highest high and lowest low inside. Repeat for 40 and 60.
- Draw horizontal rays at each high and low, and label them (20H, 20L, 40H and so on).
- Draw a Fibonacci retracement from each range's low to its high and keep only the 0, 0.5 and 1 levels. The 0.5 line is equilibrium.
- Repeat at the start of each week, or each day if you trade the rolling version.
If you'd rather automate it, open the Indicators dialog, go to Community, and search "IPDA." Several open-source scripts draw the 20/40/60-day ranges, and some, such as "Neo Quarterly Shift / IPDA Data Ranges," include the anchored look-back and cast-forward version with a 50% line. Read the source to confirm whether a script counts trading days (daily bars) or calendar days, and whether it includes the current day. Our TradingView platform guide covers the drawing tools and how to save templates so you don't redo the setup on every chart.
A Pine script user can also compute the levels in a few lines with request.security on the daily timeframe and ta.highest and ta.lowest over 20, 40 and 60 bars, offset by one bar so only closed candles count.
How do traders combine IPDA with other ICT tools?
On its own, IPDA gives you a map. The rest of the ICT toolkit provides the entry. A common top-down sequence looks like this:
- Daily: data ranges. Mark the 20/40/60-day highs, lows and equilibria. Decide which side is the more likely draw on liquidity.
- Daily or 4H: bias. Is price in premium or discount of each range? Is there a quarterly shift underway?
- Intraday: the raid. Wait for price to take a range extreme, usually the 20-day one, ideally during a high-volume session. Our liquidity sweep guide covers what a genuine raid looks like.
- Confirmation: shift and displacement. Look for a break of structure in the opposite direction with an energetic candle that leaves a fair value gap.
- Entry: PD array. Enter on a retrace into that fair value gap or order block, preferably in the OTE band.
- Targets: the ranges. First target the range equilibrium, then the opposite extreme.
Correlated markets add a cross-check. If EURUSD sweeps its 20-day low but GBPUSD doesn't, ICT traders read that as SMT divergence and a hint that the sweep is a reversal rather than a breakdown. For a full model that strings these steps together, see the ICT 2022 model and our broader ICT trading strategy guide.
Is IPDA real? What the evidence says
This is the section most IPDA guides skip, and it's the one that matters most if you're putting money behind the idea.
What argues against a literal algorithm
The foreign exchange market isn't one venue running one program. The Bank for International Settlements' Triennial Survey put global over-the-counter FX turnover at $9.6 trillion a day in April 2025, with trading between reporting dealers at 46% of the total and spot at about $3 trillion a day. That volume is spread across many dealing banks, electronic platforms and non-bank liquidity providers, each with its own pricing and execution algorithms. Nothing in the public data shows a single "interbank algorithm" coordinating all of them, and ICT has not published a specification or a test that would let anyone check the claim. So treat the "algorithm" as a metaphor.
What argues for the useful parts
The practical core of IPDA, rolling N-day highs and lows, is old and well tested in other forms. Richard Donchian's channel is exactly a rolling N-day high and low, and the famous Turtle traders built their entries on 20-day and 55-day breakouts. Our Donchian channels guide covers that lineage. Old highs and lows also attract orders for a mechanical reason: traders put stops just beyond them, and breakout traders place entries there. So it's reasonable that price often reacts at the 20-day and 60-day extremes, without any hidden coordinator.
Notice the tension, though. The Turtles traded breakouts of the 20-day range; ICT traders often fade them. Both can't be right all the time. Which behavior dominates depends on the market and the regime: trending markets reward breakouts, mean-reverting ones reward fades. Measuring that tendency, for example with the Hurst exponent, is a more objective way to decide than taking either side on faith.
Why it can look perfect in hindsight
With nine levels on the chart (three highs, three lows, three equilibria), plus order blocks and fair value gaps, price will almost always be "reacting" to something. Explaining past moves with that many levels is easy. Predicting the next one is not. The fix is to write rules down before the fact, log every setup, and count the ones that failed as carefully as the ones that worked.
★ Our view: use the 20/40/60-day ranges as a clean, objective way to locate liquidity and value. Don't use the "algorithm" story as a reason to size up or to ignore a stop.
How can you test IPDA ranges on your own market?
You don't need special software to find out whether the data ranges carry information on the market you trade. A spreadsheet and a few years of daily data are enough. Here's a simple study we'd run before trusting the framework with real size:
- Build the levels. For every day in your sample, compute the 20-day high, low and equilibrium from the previous 20 closed candles (no look-ahead).
- Flag the events. Mark each day where the high trades above the prior 20-day high, and each day where the low trades below the prior 20-day low.
- Measure what happens next. For each event, record whether price closed back inside the range that day (a failed break, which favors the ICT fade) or closed beyond it (a clean break, which favors the Turtle-style breakout). Then record where price was 5 and 10 days later.
- Split by context. Separate the events by whether price was in premium or discount of the 60-day range when they happened. If the framework adds value, fades of 20-day highs should work better when price is already in 60-day premium.
- Compare with a baseline. Pick random days and measure the same forward returns. An edge only exists if the event days behave differently from random ones.
Expect the answer to differ by market. A pair that spends most of its time ranging may reward fades of the 20-day extremes, while a stock index in a strong trend may punish them. Whatever you find, it will be more useful than any screenshot, because it's your market and your rules. Keep the paper trail. If you later trade the setup live, compare live results to the study every few months.
Common IPDA mistakes and when the framework fails
- Counting calendar days. The ranges are trading days, which means daily bars. Counting 20 calendar days gives you roughly 14 bars and the wrong levels.
- Letting Sunday candles slip in. If your forex feed prints a short Sunday bar, every count is off by one for each week in the window. Check your data's session settings.
- Including the live candle. If today's bar is in the window, your levels shift during the session. Use closed candles only.
- Fading every 20-day high. In a strong trend, price can walk through 20-day highs for weeks. A run of the 20-day extreme is only a setup when an intraday shift confirms it.
- Treating premium as "must short." Premium is a location, not a signal. In a bull trend, price can stay in premium of the 20-day range for a long time.
- Ignoring news. A central bank decision or a payrolls release can blow through every range in minutes. The levels still matter afterward, but stops near them get hit first.
- Using it where it wasn't taught. ICT developed these ideas mainly on forex and index futures. Thin small caps or new crypto pairs with short histories may not have meaningful 60-day ranges at all.
- Cherry-picking examples. If you only screenshot the sweeps that reversed, you'll overestimate the edge. Track the failures too.
ICT IPDA and Quantum Algo
IPDA ranges are a map, so they pair best with tools that make the map visible and with something that times the entry. On the free side, our Institutional Key Levels indicator plots prior period highs and lows automatically, the Liquidity Sweeps script highlights when one of those levels gets raided, and the Smart Money Concepts Engine and Fair Value Gaps Inversion scripts mark the structure shifts and gaps you'd use for the entry.
Zeno, Quantum Algo's premium TradingView suite, doesn't draw IPDA ranges, order blocks or fair value gaps. It gives buy and sell signals with a built-in stop and targets. A practical way to combine them: use the 20/40/60-day position as a location filter (only take Zeno buys when price is in discount of the 20-day range, only sells in premium) and let Zeno handle the timing and the risk. You can review how the signals have performed on the public track record, and the free QuantumAlgo Academy covers liquidity, premium and discount, and market structure from the ground up.
◆ Interactive check
How well do you know ICT IPDA?
Questions traders ask about ICT IPDA
IPDA stands for Interbank Price Delivery Algorithm. It is the term Michael Huddleston (ICT) uses for his model of how price is delivered between pools of liquidity and areas of inefficiency.
They are the last 20, 40 and 60 trading days of daily price data. Traders mark the highest high, lowest low and 50% equilibrium of each window and use them as liquidity targets and premium/discount references.
Count daily candles, not calendar days. Most practitioners treat the most recently closed daily candle as day 1 and count backward, excluding the live candle so the levels don't shift during the session.
ICT teaches that markets tend to change direction, or switch between trending and consolidating, every three to four months. The 60-day data range is roughly one quarter, so it is used to frame those shifts.
Look-back means examining the 20, 40 and 60 trading days before an anchor date for highs, lows and PD arrays. Cast-forward projects the same number of days after the anchor as the time window in which those levels may be targeted.
There is no public evidence of a single algorithm delivering price across the interbank market, and ICT has not published one. The rolling highs and lows the framework uses are real and widely watched, which is why many traders use the levels while staying skeptical of the story.
The ranges themselves are built on the daily chart. Traders then drop to the 1-hour, 15-minute or 5-minute chart to look for a liquidity sweep and structure shift near those levels.
There is no built-in one, but several open-source community scripts plot 20/40/60-day ranges, some with anchored look-back and cast-forward. Check whether a script counts daily bars or calendar days before relying on it.
Each data range has a 50% equilibrium. Above it is premium and below it is discount, and ICT teaches buying in discount and selling in premium in line with the higher-timeframe bias. See our premium and discount guide for more.
The math works on any market with daily data. ICT developed the idea mainly around forex and index futures, and newer or thinly traded assets may not have meaningful 60-day ranges, so test it on your own market first.
References & Related Guides
Read next
- Premium and Discount Zones
- ICT Quarterly Theory
- Liquidity in Trading
- The ICT 2022 Model
- Who Is ICT (Michael J. Huddleston)? The Trader Behind Killzones, FVGs and the 2022 Model
- Optimal Trade Entry
- Power of Three (AMD)
- What Is a Market Structure Shift (MSS)?
- TradingView
- Liquidity Sweep Trading
- Free TradingView indicators
- Zeno — the premium engine
Primary sources
- The Inner Circle Trader (YouTube) — ICT Mentorship Core Content, Month 05: Quarterly Shifts & IPDA Data Ranges
- InnerCircleTrader.net — ICT IPDA tutorial
- TradingView — Neo Quarterly Shift / IPDA Data Ranges (open-source script)
- LuxAlgo Library — ICT IPDA
- Bank for International Settlements — OTC foreign exchange turnover in April 2025
- Backtrex — ICT Dealing Range and IPDA Data Range guide