ICT Quarterly Theory: AMDX, True Opens and the Fractal Quarters of Time
Quarterly theory splits every time cycle (the year, month, week, day and each six-hour session) into four quarters and expects price to move through them as accumulation, manipulation, distribution and continuation or reversal (AMDX). The "true open" is the open of each cycle's second quarter, such as midnight New York for the day; price trading below it favours longs and above it favours shorts. It is a timing framework built on ICT ideas and popularised by the trader Daye, not a tested system.
ICT traders spend a lot of time on where price will go: liquidity pools, order blocks, fair value gaps. Quarterly theory is about when. It takes the familiar Power of Three idea (accumulate, manipulate, distribute) and applies it to every scale of time at once, from the year down to 90-minute blocks. This guide explains the quarters, AMDX and XAMD, how true opens are used, how traders combine it with standard ICT entries and where its evidence runs out. There is a live quarter clock further down.
Indicators that prove themselves in public.
One engine, four precision tools — the Gold (XAU) Scalper, the institutional Gravity Zone, the Zeno momentum Oscillator, and Zeno Stocks for equities.
What is ICT quarterly theory?
Quarterly theory is a time-based framework from the ICT (Inner Circle Trader) school of trading. It says that every cycle of time, from a year down to a 90-minute block, can be divided into four quarters, and that price tends to move through those quarters in the same sequence: a quiet build-up, a false move, the real move, and then either continuation or a reversal.
The ingredients come from Michael Huddleston's teachings (killzones, the Power of Three, time-of-day anchors), but the "quarters at every scale" structure is usually credited to a trader known as Daye, who organised it in the early 2020s. There is no formal publication; it circulates through videos, mentorship notes and indicator write-ups, which is why the details vary from one presenter to the next. If you want the background on the source, see who ICT is.
The appeal is that it gives structure to timing. Instead of asking only where liquidity sits, you also ask which quarter you are in, and whether the move in front of you is likely to be the manipulation or the real distribution.
What are the fractal quarters?
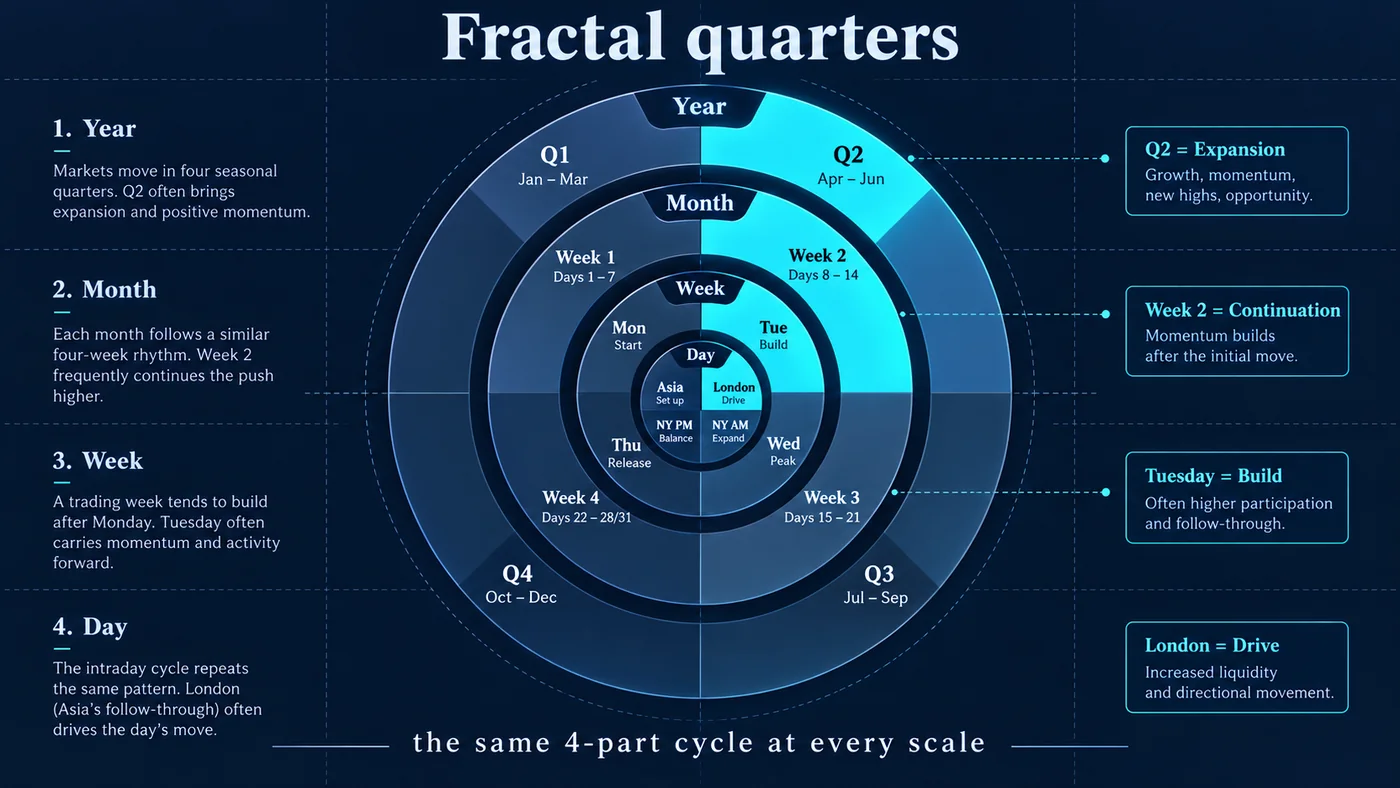
The core idea is fractal: the same four-part split applies at every scale. The common grid, in New York time:
| Cycle | Q1 | Q2 | Q3 | Q4 |
|---|---|---|---|---|
| Year | Jan–Mar | Apr–Jun | Jul–Sep | Oct–Dec |
| Month | Week 1 | Week 2 | Week 3 | Week 4 |
| Week | Monday | Tuesday | Wednesday | Thursday (Friday sits outside the quarters) |
| Day (6-hour sessions) | Asia 18:00–00:00 | London 00:00–06:00 | New York 06:00–12:00 | Afternoon 12:00–18:00 |
| Session (90-minute blocks) | 1st 90 minutes | 2nd 90 minutes | 3rd 90 minutes | 4th 90 minutes |
Some presenters go further, splitting each 90-minute block into four blocks of 22.5 minutes. The deeper you go, the more the grid becomes a matter of convention and the less it says on its own. The day is measured from 18:00 New York, the start of the futures and forex trading day, which is why Asia is Q1 rather than Q4.
What is AMDX?
AMDX is the sequence quarterly theory expects inside each cycle. It extends ICT's Power of Three (accumulation, manipulation, distribution) with a fourth phase.
| Quarter | Phase | What price typically does |
|---|---|---|
| Q1 | A · Accumulation | Builds a range; liquidity collects above and below it |
| Q2 | M · Manipulation | A false break of the range that sweeps stops (the "Judas" move) |
| Q3 | D · Distribution | The real expansion, in the opposite direction to the manipulation |
| Q4 | X · Continuation or reversal | The move either extends or reverses into the next cycle |
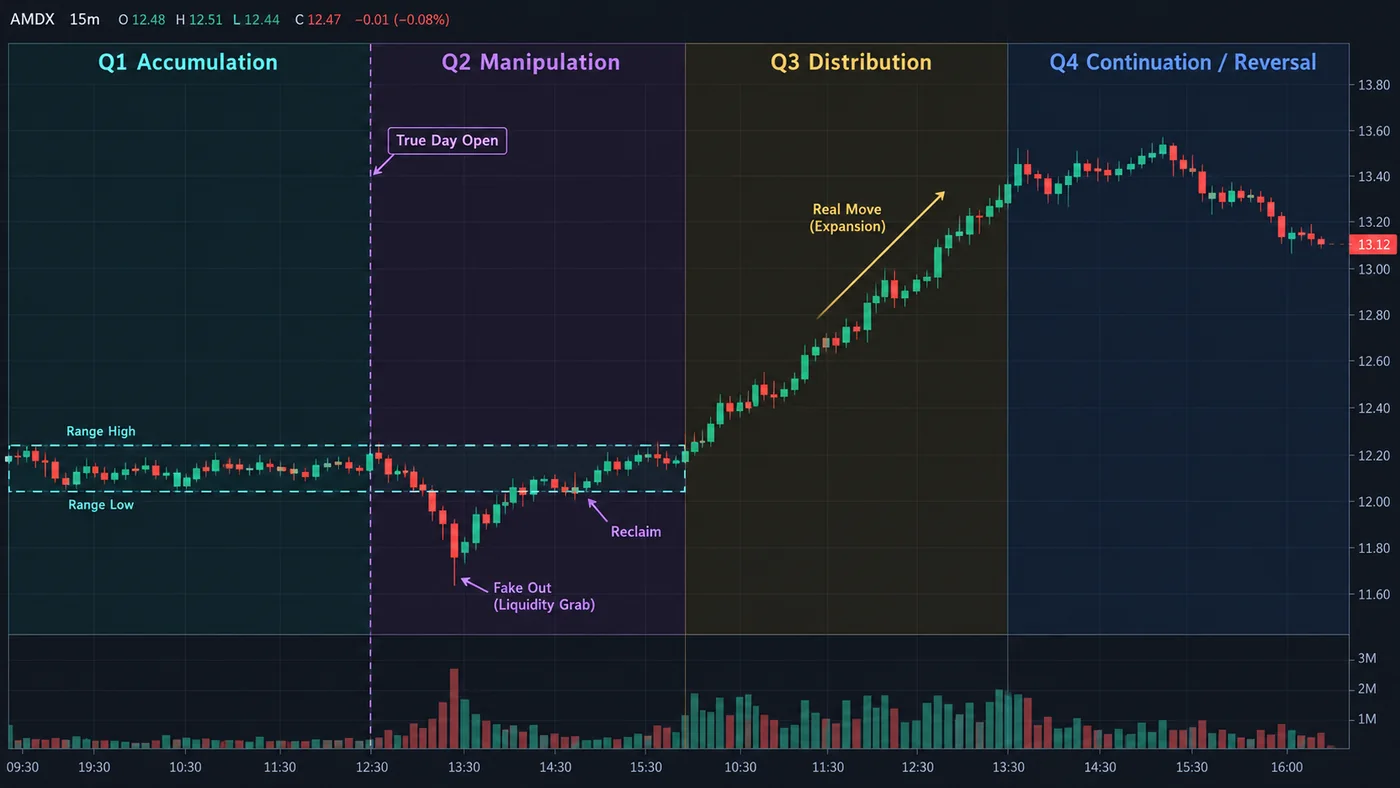
XAMD is the variant used when a cycle shifts: the expansion (X) comes first, and accumulation, manipulation and distribution follow. Deciding which sequence is in play is discretionary and usually done by looking at what the previous, larger quarter did. If the prior session already delivered a big move, the next one may open with continuation or reversal rather than a fresh range. For the underlying idea, see the Power of Three (AMD) guide.
What is the true open?
The true open is the open of a cycle's second quarter, used instead of the calendar open as the cycle's reference price. The logic: Q1 is accumulation, so the cycle's "real" starting point is where manipulation begins.
| Cycle | True open (common convention) |
|---|---|
| Year | First trading day of April |
| Week | Monday 18:00 New York (the start of Tuesday's trading day) |
| Day | 00:00 New York (the "true day open") |
| Session | The open of its second 90-minute block (for example 07:30 in the 06:00–12:00 session) |
Sources disagree on some anchors, particularly the month. The true day open at midnight New York is the most widely used and is also a standard ICT reference level.
How traders use it: in a bullish day, they want to buy below the true day open (a discount relative to the day's real start); in a bearish day, sell above it (a premium). It acts as a simple filter. If your bias is bullish and price is already well above the true open, the best part of the move may be gone, or a better entry may come after a manipulation back below it. This mirrors the premium and discount logic, applied to time instead of a price range.
How do the 90-minute cycles work?
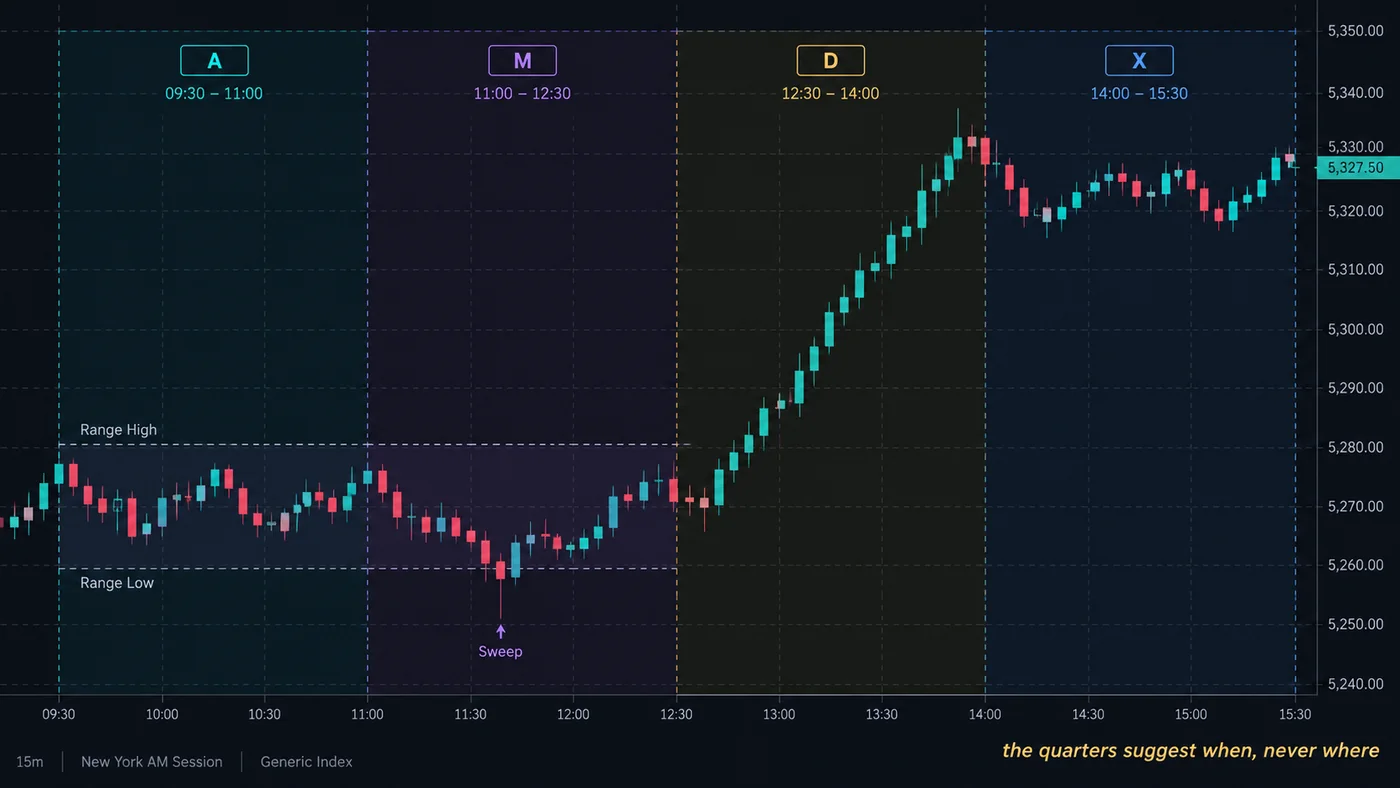
Inside each six-hour session, the four 90-minute blocks follow the same AMDX template. For an intraday trader this is where quarterly theory becomes practical: the second block of a session is when a sweep of the session's early range is most expected, and the third block is when the real move is expected.
Two anchoring conventions are common. One keeps the session grid (for New York: 06:00, 07:30, 09:00 and 10:30). The other anchors to the 9:30 equity cash open, because index futures change character at that moment. Pick one, write it down and use it consistently; mixing them is a common way to see whatever pattern you want.
The phrase in the chart above is the right mindset: the quarters suggest when a move may happen, never where. The location still comes from liquidity and structure: buy-side and sell-side liquidity, fair value gaps and order blocks.
How do you trade quarterly theory?
Quarterly theory is a filter and a timing aid, not a complete system. A typical intraday workflow combines it with standard ICT entries:
- Higher-timeframe bias. Decide the daily direction from structure and the higher-timeframe draw on liquidity. Quarterly theory does not tell you direction.
- Mark the references. The true day open, the Asia range (Q1 of the day) and the session's first 90-minute range.
- Wait for Q2 manipulation. In a bullish day, look for a sweep below the Asia range or the early session low, ideally beneath the true day open (discount).
- Confirm with structure. A market structure shift back up after the sweep, leaving a fair value gap to enter on.
- Target Q3 distribution. Aim for the opposing liquidity (the previous day's high, the London high) during the third quarter, and manage the trade into Q4.
The stop goes beyond the manipulation extreme. If price keeps going in the "manipulation" direction through Q3, the read was wrong: the move was distribution, not manipulation. That is the most common failure, and the reason the framework should never override structure.
Quarter clock
The clock shows where any moment sits in the quarterly grid, in New York time: the quarter of the year, month, week, day and 90-minute cycle, the AMDX phase and the true opens to watch. Leave it on "Live" to follow the current session, or pick a date and time to study a past chart.
Quarterly theory vs killzones and the Power of Three
| Concept | What it organises | Scale | Main use |
|---|---|---|---|
| Quarterly theory | Time into four repeating quarters | Year down to 90 minutes | When the manipulation and the real move are likely |
| Killzones | Specific high-activity windows | Intraday | When to be at the screen |
| Power of Three | Accumulation, manipulation, distribution | Mostly the daily candle | The shape of a day |
| ICT macros | Short algorithmic windows (around 20 minutes) | Intraday | Precise entry timing |
| Silver Bullet | A one-hour window setup | Intraday | A specific FVG entry |
The pieces overlap. The London and New York killzones roughly coincide with the Q2 and Q3 sessions of the day, and the Power of Three is quarterly theory applied to one daily candle. If you already trade killzones, quarterly theory mainly adds the idea that the same pattern repeats inside each session and across days of the week.
Is quarterly theory backed by evidence?
Not in any independent, published sense. The framework has no formal statistical study behind it, and the anecdotal examples that circulate are chosen after the fact. That does not make it useless; it means you should treat it as a hypothesis to test on your own market.
A fair test is simple to run. Mark the true day open and the Asia range on, say, 60 consecutive trading days of one market. Record whether the London or early New York quarter swept one side of the Asia range and then closed the day on the other side. Compare the hit rate with what you would expect from chance and from a plain "fade the first break of the Asia range" rule. Time-of-day effects in markets are real (volatility clusters around opens and data releases), so some structure should show up. The question is whether the quarter labels add anything beyond that.
Crypto trades around the clock and fits the grid mechanically. Stocks, with a 6.5-hour cash session, fit less neatly, which is why most practitioners apply the quarters to index futures rather than to individual equities.
What mistakes do traders make with quarterly theory?
- Trading time without location. Being in Q2 is not a signal. You still need a sweep of a real liquidity pool and a structure shift.
- Forcing AMDX on every cycle. Some sessions are XAMD, some are inside days that do nothing. Let the chart decide.
- Mixing time anchors. Switching between the 06:00 and 9:30 grids, or between time zones, guarantees confusing results. Use New York time and one grid.
- Ignoring news. High-impact releases override any time template.
- Calling distribution "manipulation". If the "false" move keeps going into Q3, it was the real move. Respect the stop.
- Over-fractalising. Going down to 22.5-minute quarters on a 1-minute chart produces a label for every candle and a reason for every trade.
Reference data
| Item | Detail |
|---|---|
| Origin | ICT time concepts; organised by the trader Daye in the early 2020s |
| Time zone | New York |
| Day start | 18:00 (futures and forex trading day) |
| Sessions | Asia 18–00 · London 00–06 · New York 06–12 · Afternoon 12–18 |
| Sequence | AMDX (or XAMD when the cycle shifts) |
| True day open | 00:00 New York |
| Weekly true open | Monday 18:00 New York |
| Evidence | Anecdotal; no independent statistical validation |
| On TradingView | Community scripts plot the quarters and true opens; no built-in tool |
How does quarterly theory fit with Quantum Algo's indicators?
Quarterly theory answers "when"; the trade still needs "where". The free Quantum Algo indicators on TradingView mark sessions, liquidity sweeps, structure shifts and fair value gaps, which are the locations a Q2 manipulation is supposed to hit. Zeno, the premium engine from Quantum Algo (QuantumAlgo), prints buy and sell signals with an entry, a stop and two targets; checking which quarter a signal fires in is a simple way to add a time filter without letting time make the decision. Every Zeno call is logged on the public track record.
Quarterly theory divides every cycle (year, month, week, day, session) into four quarters and expects accumulation, manipulation, distribution and then continuation or reversal. The true open, the start of Q2, is the cycle's reference price: buy below it in a bullish cycle, sell above it in a bearish one. Use it to time entries after a Q2 sweep, confirmed by a structure shift, and to target liquidity in Q3. It has no published statistical validation, so test it on your own market and never let the clock override structure.
◆ Interactive check
Do you know your quarters?
Questions traders ask about ICT quarterly theory
A time framework that divides every cycle (year, month, week, day, session) into four quarters and expects price to move through accumulation, manipulation, distribution and continuation or reversal.
It builds on ICT's time-based teachings and is usually credited to a trader known as Daye, who organised it in the early 2020s. There is no formal publication.
Accumulation, manipulation, distribution and X (continuation or reversal): the four-phase sequence quarterly theory expects inside each cycle.
A shifted version of the sequence in which the expansion comes first and accumulation, manipulation and distribution follow, used when the cycle has already delivered a move.
Midnight New York (00:00), the open of the day's second quarter. Traders use it as a reference: below it is a discount for longs, above it a premium for shorts.
In New York time: Asia 18:00–00:00 (Q1), London 00:00–06:00 (Q2), New York 06:00–12:00 (Q3) and the afternoon 12:00–18:00 (Q4).
Each six-hour session split into four 90-minute blocks that follow the same AMDX template. Some presenters anchor them to the session open, others to the 9:30 cash open.
There is no independent statistical validation. Time-of-day effects are real, but whether the quarter labels add anything is something to test on your own market.
Yes. Crypto trades around the clock and fits the grid mechanically; the same caution about evidence applies.
There is no built-in tool, but several community scripts plot the quarters, the AMDX labels and the true opens.
References & Related Guides
Read next
- Power of Three (AMD)
- ICT Macros
- ICT Silver Bullet
- ICT Trading Strategy
- ICT 2022 Model
- Higher Timeframe Bias
- Liquidity Sweep Trading
- Premium and Discount Zones
- Who Is ICT?
- Forex Market Hours
- Free TradingView indicators
- Zeno — the premium engine