Power of Three (AMD)
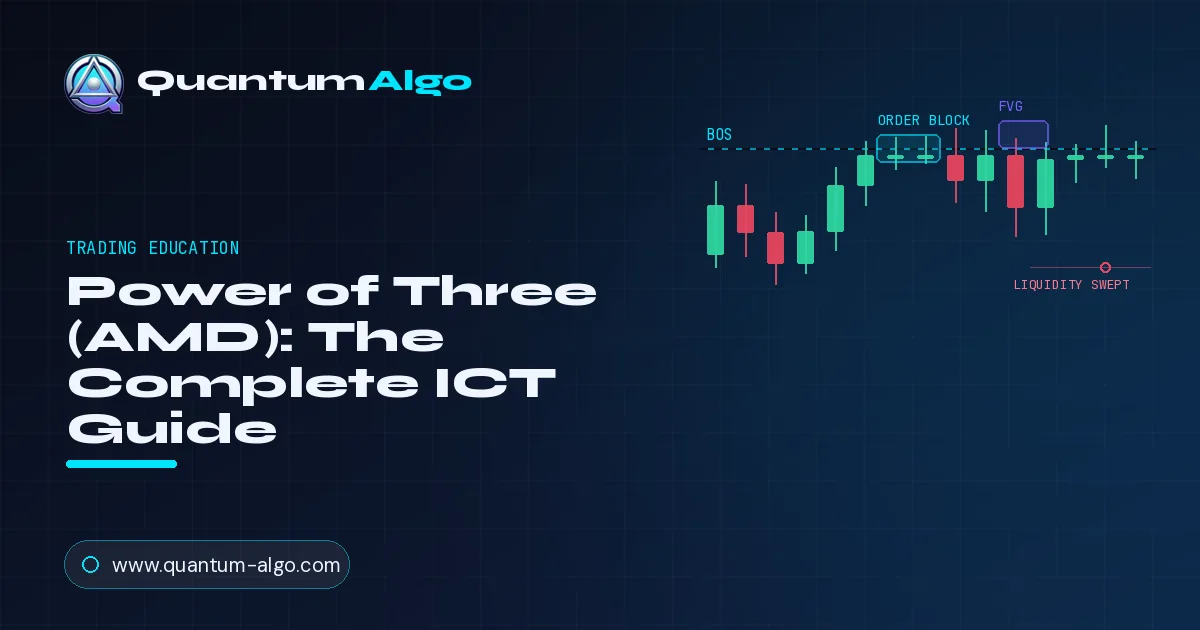
The Power of Three (PO3), or AMD model, is an ICT concept describing how smart money builds nearly every daily, weekly or session candle in three phases: accumulation (a quiet range near the open where positions are loaded), manipulation (a false move that sweeps liquidity to trap retail and fill orders), and distribution (the true expansion toward the close).
What is the Power of Three (AMD)?
The Power of Three — abbreviated PO3 and also known as the AMD model (Accumulation, Manipulation, Distribution) — is one of the foundational concepts in ICT (Inner Circle Trader) methodology and Smart Money Concepts. It describes the three-phase footprint that institutional order flow leaves on almost every meaningful candle, whether you are looking at a daily bar, a weekly bar, or a single trading session.
The core insight is deceptively simple: large institutions cannot enter and exit positions the way a retail trader can. When a fund needs to buy millions of dollars of an asset, there simply aren’t enough willing sellers at one price to fill that order without moving the market against itself. So instead of buying in the open, smart money engineers the conditions to get filled — and that engineering leaves a repeatable three-part signature.
First they accumulate quietly in a range. Then they manipulate price in the opposite direction to generate the liquidity they need. Finally they distribute — expanding price in the real direction toward the close. Understanding this cycle transforms how you read a chart, because it explains the single most frustrating experience in retail trading: entering on a clean breakout, only to watch price immediately reverse and run the other way.
That reversal is not bad luck — it is the manipulation phase doing exactly what it is designed to do.
What happens in accumulation, manipulation and distribution?
Each letter of AMD corresponds to a distinct phase with a distinct purpose. Understanding what smart money is doing in each — and what retail traders are doing at the same time — is the whole game.
The three phases always occur in the same order, and each sets up the next. Accumulation is the quiet range around the candle’s open, where positions are built without alerting the market. Manipulation is the deliberate false move — the Judas swing — that sweeps the liquidity resting just beyond the accumulation range, trapping breakout traders and filling the remaining institutional orders at better prices. Distribution is the real, sustained expansion toward the candle’s close, in the opposite direction to the manipulation.
The practical takeaway is that the move most retail traders react to — the manipulation spike — is precisely the move you should be fading, and the distribution leg that follows is the one you want to be positioned for.
How do you identify the Power of Three on a chart?
The beauty of the AMD model is that it is fractal — it appears on every timeframe and nests inside itself. A daily candle’s three phases each contain their own smaller three-phase cycles on lower timeframes. To spot it in practice, work through a simple visual checklist.
- Find the range (accumulation). Mark the consolidation that forms around the open of your chosen candle — the daily open, the weekly open, or a session open. This box holds the liquidity that will be targeted.
- Watch for the sweep (manipulation). Look for a sharp thrust out of one side of the range that takes out an obvious high or low — equal highs, equal lows, or a prior session extreme — and then fails to hold. This is liquidity being taken.
- Confirm the reversal (distribution). A genuine PO3 shows price rejecting the swept level and expanding decisively the other way. A break of structure in the new direction confirms the distribution phase has begun.
The context that matters most is where the sweep happens. A manipulation leg that sweeps a well-defined pool of liquidity — the stops above equal highs, or below a prior day’s low — and then reverses into a liquidity void or order block is a textbook AMD setup. Sweeps that happen in the middle of nowhere, with no obvious liquidity target, are far less reliable.
How do you align the Power of Three across timeframes?
Because the model is fractal, the most powerful way to use it is to align the phases across timeframes — a technique that turns PO3 from an interesting idea into a genuine edge. The principle is that the manipulation phase of a higher timeframe candle is the ideal window to hunt for a distribution entry on a lower timeframe.
| Timeframe | Accumulation | Manipulation | Distribution |
|---|---|---|---|
| Daily candle | Around the daily open (00:00 or midnight open) | London / early move sweeps Asia range | New York expansion to the close |
| Weekly candle | Monday’s range | Monday–Tuesday false move | Wednesday–Friday true trend |
| Session | First consolidation of the session | Early liquidity grab | Session trend leg |
The classic daily example is the interplay between global sessions. Price accumulates during the quiet Asian session, London delivers the manipulation by sweeping the Asian high or low, and New York delivers the distribution — the real directional move of the day. A trader who understands this stops treating the London sweep as a breakout to chase and instead waits for it as the signal that the daily distribution is about to begin.
Aligning a lower-timeframe entry with a higher-timeframe manipulation phase is where intraday traders find their highest-probability setups.

Automate your trades. Let Quantum Algo trade for you.
Every signal executed on your own account — 24/7, hands-off.
How to trade the Power of Three
Translating the model into an actual trade comes down to patience: you wait for the manipulation phase to complete, then enter at the start of distribution with clearly defined risk. Chasing any earlier phase is how the model traps you rather than pays you.
- Establish your higher-timeframe bias. Decide the direction you expect distribution to run — using higher-timeframe structure, an unfilled fair value gap, or a daily order block as the target.
- Let accumulation and manipulation play out. Do not touch the range. Wait for the manipulation leg to sweep liquidity against your intended direction.
- Enter on the distribution confirmation. When price rejects the swept level and shifts structure in your direction, enter — ideally on a return to the order block or fair value gap that caused the reversal.
- Place the stop beyond the sweep. Your invalidation is the extreme of the manipulation wick. If price trades back beyond it, the AMD read was wrong. This gives a tight, logical stop.
- Target the opposite liquidity. Distribution runs toward the next pool of liquidity or the candle’s expected close. Take partials into it and manage the rest with your risk plan.
The reason this structure produces such favourable risk-to-reward is that your stop sits just beyond the manipulation extreme — a level the market has already shown it does not want to trade back through — while your target is the full distribution leg. Entering at the transition from manipulation to distribution means you are positioned exactly where institutions are, with a stop where they have proven price will not go.
How does the Power of Three differ from a classic breakout?
The Power of Three model is, in many ways, the institutional explanation for why naive breakout trading fails so consistently. A retail breakout trader sees price push above a range high and buys the breakout. What they are usually buying is the manipulation phase — the exact move engineered to trap them.
Consider the two mental models side by side. The breakout trader sees a range, waits for price to exit it, and enters in the direction of the exit, placing a stop back inside the range. The AMD trader sees the same range but expects the first exit to be a false one designed to harvest the liquidity resting beyond it.
Where the breakout trader enters, the AMD trader waits; where the breakout trader’s stop sits (just inside the range), the AMD trader knows a pool of liquidity is resting, and expects price to reach for it. This is why so many breakouts reverse the moment retail commits: the stops those traders leave behind are the fuel for the distribution leg in the opposite direction.
Understanding PO3 does not just give you a setup — it inoculates you against the single most common way retail traders donate their capital to the market. It reframes the false breakout from a source of frustration into a source of signal.
What is the draw on liquidity?
The distribution phase always runs somewhere — toward a specific target that institutions are reaching for. That target is the draw on liquidity, and identifying it before the candle even opens is what lets you predict which direction distribution will take. Without a draw, you are guessing; with one, you are anticipating.
The draw is simply the most obvious pool of liquidity that price is being pulled toward. It usually takes one of a few forms. An old high or low that has not yet been taken acts as a magnet, because the stops and breakout orders resting there are exactly what institutions need to fill large positions. An unfilled fair value gap on a higher timeframe draws price back to rebalance the imbalance.
A cluster of equal highs or equal lows is a particularly strong draw, since obvious levels accumulate the most resting orders.
- Zoom out first. On the daily and weekly charts, mark the nearest untapped high above price and untapped low below it. One of these is the likely draw.
- Note unfilled gaps. Mark any higher-timeframe fair value gaps that price has not yet returned to fill — they attract price like magnets.
- Decide the bias. If the nearest meaningful draw sits above, expect distribution to run up after a downside manipulation; if it sits below, expect the opposite.
Once you know the draw, the whole AMD cycle snaps into focus. The manipulation phase will typically move away from the draw first — a downside sweep when the draw is above, trapping sellers — before distribution reverses and runs toward it.
Reading the draw turns the Power of Three from a pattern you recognise after the fact into a roadmap you can trade in advance, because you already know where the real move is trying to go before it begins. This is the single most important habit that separates traders who use PO3 profitably from those who merely describe it.
How does the Power of Three work on weekly and monthly candles?
Because the model is fractal, swing and position traders can apply the exact same logic to the weekly and monthly candles — and doing so often produces the cleanest, highest-conviction setups of all, precisely because higher-timeframe manipulation traps more traders and distribution runs further.
On the weekly candle, the week’s open (Monday) begins the accumulation. The classic pattern sees Monday and often Tuesday deliver the manipulation — a false move that sweeps the prior week’s high or low — before the true weekly trend distributes from midweek into Friday. A swing trader who understands this stops chasing Monday’s move and instead treats an early-week sweep as the signal that the real weekly direction is about to reveal itself.
The same logic scales to the monthly candle, where the first days of the month accumulate, an early sweep manipulates, and the month’s genuine trend distributes thereafter.
The practical power comes from nesting the timeframes. When the weekly candle is in its manipulation phase — sweeping the prior week’s low, say — you can drop to an intraday chart and look for a daily or session-level Power of Three that distributes in the new weekly direction. The higher timeframe tells you the story and the bias; the lower timeframe gives you a precise, low-risk entry.
This top-down alignment is the same principle that underpins the Silver Bullet and virtually every other institutional approach: let the big picture set direction, and let the small picture set the entry.
Common Power of Three mistakes to avoid
- Trading the manipulation leg. The single biggest error is entering on the sharp false move because it looks like momentum. That move is the trap. Wait for the sweep to fail before acting.
- Forcing PO3 where there is no liquidity. The model only works when the manipulation sweeps a genuine pool of liquidity. A sweep of a random level with no stops behind it is not a reliable setup.
- Ignoring higher-timeframe bias. Distribution runs in the direction of the higher-timeframe draw on liquidity. Fading that context because a lower-timeframe manipulation looks convincing leads to trading against the real move.
- Impatience with the accumulation phase. Consolidation is not dead time — it is the setup building. Traders who cannot wait through it enter early and get caught in the manipulation.
- No defined invalidation. Without a stop beyond the manipulation extreme, a failed read becomes an open-ended loss. The wick that swept liquidity is your line in the sand.
- Over-applying the model. Not every candle is a clean AMD cycle. Forcing the framework onto choppy, low-liquidity conditions produces more noise than edge.
◆ Test Your Knowledge
Power of Three with Quantum Algo
The Power of Three cycle is invisible until you can see where liquidity sits and where structure genuinely shifts. Quantum Algo’s Smart Money Concepts tools mark the accumulation ranges, the liquidity that gets swept during manipulation, and the order blocks that fire the distribution leg — so you can read the AMD story on your chart in real time instead of guessing after the fact.
Related guides
◇ Frequently Asked Questions
The Power of Three (PO3), also called the AMD model, is an ICT concept describing how smart money builds nearly every candle in three phases: accumulation (a quiet range near the open), manipulation (a false move that sweeps liquidity), and distribution (the true expansion toward the close).
AMD stands for Accumulation, Manipulation, Distribution — the three sequential phases of the Power of Three model. They describe how institutions build a position, engineer liquidity with a false move, then expand price in the real direction.
Manipulation is the second phase of PO3: a sharp false move, often called the Judas swing, that drives price the wrong way to sweep the liquidity resting beyond the accumulation range. It traps breakout traders and fills institutional orders before the real move.
Establish a higher-timeframe directional bias, let accumulation and manipulation play out without entering, then enter at the start of distribution when price rejects the swept level and shifts structure. Place your stop beyond the manipulation extreme and target the opposite liquidity.
Yes. Power of Three and AMD are two names for the same model. 'Power of Three' refers to the three phases, and 'AMD' is the acronym for those phases: Accumulation, Manipulation, Distribution.
The Power of Three is fractal and appears on every timeframe — daily, weekly, and individual sessions — nesting inside itself. The most powerful use aligns a higher-timeframe manipulation phase with a lower-timeframe distribution entry.
The Judas swing is another name for the manipulation phase — the deliberate false move at the start of a candle or session that betrays breakout traders by moving the wrong way first to sweep liquidity before the true move.
Naive breakouts often fail because the initial move out of a range is frequently the manipulation phase — engineered to trap breakout buyers and sellers and harvest their stops as fuel for the distribution leg in the opposite direction.
Power of Three is a core Smart Money Concepts and ICT idea. It complements liquidity, order blocks, fair value gaps, and market structure by explaining the sequence in which smart money engineers price to build and distribute positions.
Place your stop just beyond the extreme of the manipulation wick — the high or low that swept liquidity. If price trades back through that level, the AMD read was invalid, giving you a tight, logical invalidation point.
References & Related Guides
More in this topic
- Best TradingView Indicators — Complete Guide
- Divergence Trading: Complete Guide
- Elliott Wave Theory — Complete Trading Guide
- Fisher Transform Indicator: Complete Guide
- Harmonic Patterns: Complete Trading Guide
- Heikin Ashi — Complete Smoothed Candlestick Guide
- Inside Bar Trading: Complete Guide
- Leverage Trading: The Complete Guide
- Machine Learning Trading Indicators (Lorentzian): Complete Guide
- Pin Bar Trading: Complete Guide
- Pivot Points — Complete Intraday Support & Resistance Guide
- Position Trading: Complete Guide
Core reading
- BOS & CHoCH: Complete Market Structure Guide
- Order Blocks Trading: Complete Guide
- Risk Management in Trading — Complete Guide
- Candlestick Patterns Guide — Engulfing, Pinbar & More
- All Premium Guides
- Quantum Algo on TradingView
- Public Track Record