Institutional Key Levels [Quantum Algo]
Support and resistance the way institutions leave it: pivots clustered into single ranked levels, a touch count on every line, thicker for the strongest, expiring when stale, and signals only on confirmed rejection.
The short answer
Institutional Key Levels is a free, open-source TradingView indicator that finds the price levels where institutions have repeatedly defended or rejected price and draws them as clean, ranked horizontal lines — not thick boxes — each labelled with how many times it has been tested, with thicker and more vivid lines for the strongest, automatic expiry for the stale, and strict buy/sell signals that fire only on a confirmed rejection candle. It merges nearby swing points into single high-confidence levels through pivot clustering, detects liquidity sweeps of those levels, and adds a volume-weighted dynamic level that shows where institutional money is concentrating now. It is the support-and-resistance tool built for Smart Money traders and the level layer behind our key-levels approach in the Academy.
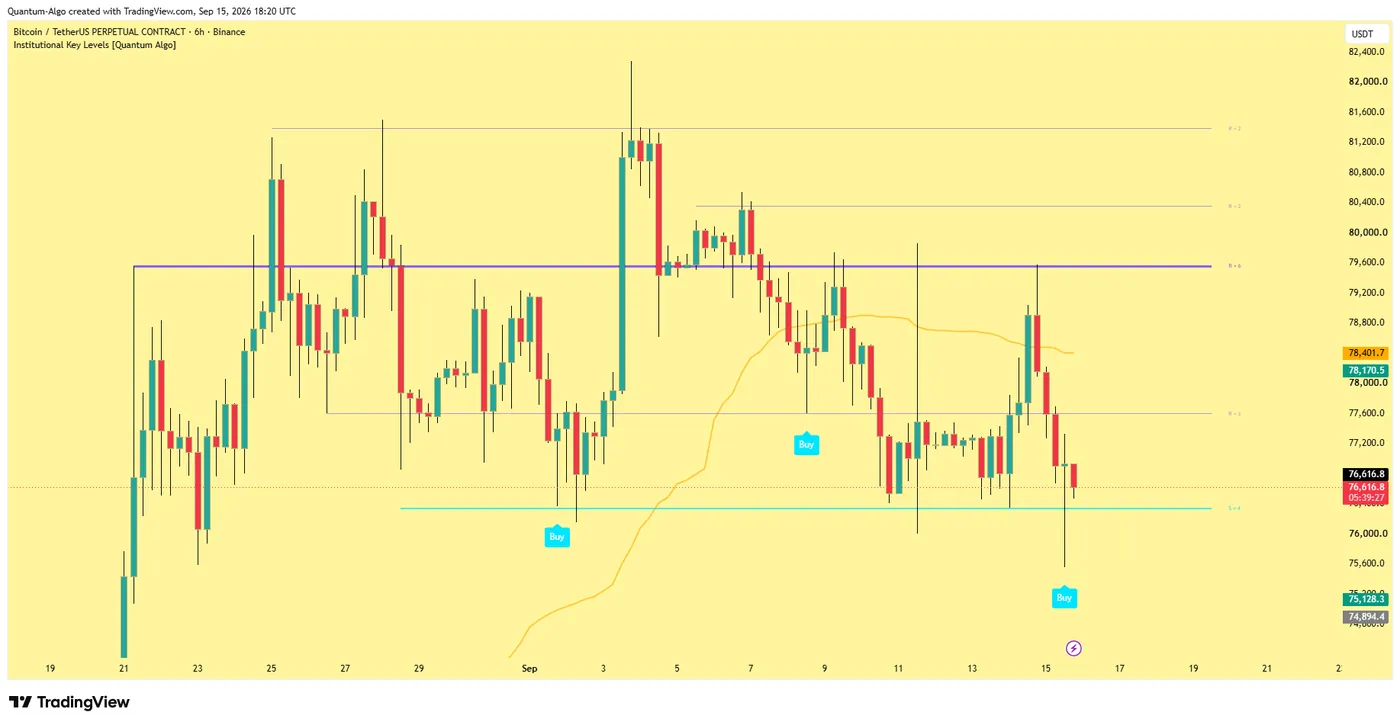
Ranked S/R lines labelled "S × n" / "R × n", buy/sell signals on rejection candles, sweep markers, and a gold volume-weighted dynamic level.
Thin lines, pivot clustering, power scoring, automatic expiry, strict rejection signals with cooldown.
Rejection at a 5+ touch level; dynamic-level confluence; sweep-and-reclaim of a ranked level.
Why these key levels are different
Most support and resistance indicators draw thick boxes everywhere, signal on every touch, and never remove old levels — so every level looks equally important and you ignore all of them. This indicator is built on five principles no other free key-level tool combines:
Thin lines, not boxes
A single horizontal line per level; the chart stays readable.
Pivot clustering
Nearby swing points merge into one level at their average price; five pivots at similar prices become one strong level, not five lines.
Power scoring
Every level shows its touch count on the chart: "S × 7" has been tested seven times, "R × 2" twice. Line thickness and opacity scale with strength.
Automatic expiry
Levels older than the configurable lifespan disappear; only levels relevant to the current structure remain.
Strict rejection signals
No signal on a mere touch; a signal needs a wick into the level at least half the candle's range and a close back outside in the signal direction, with a cooldown against consecutive signals at the same level.
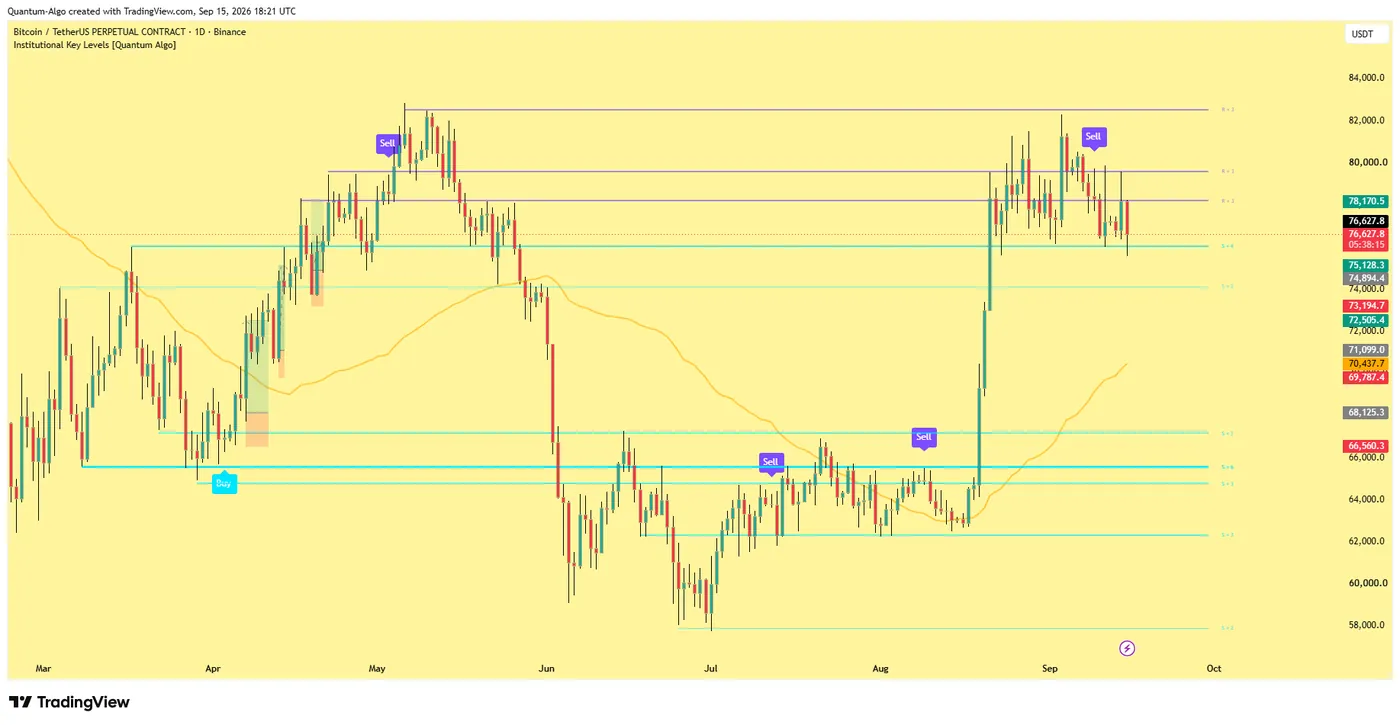
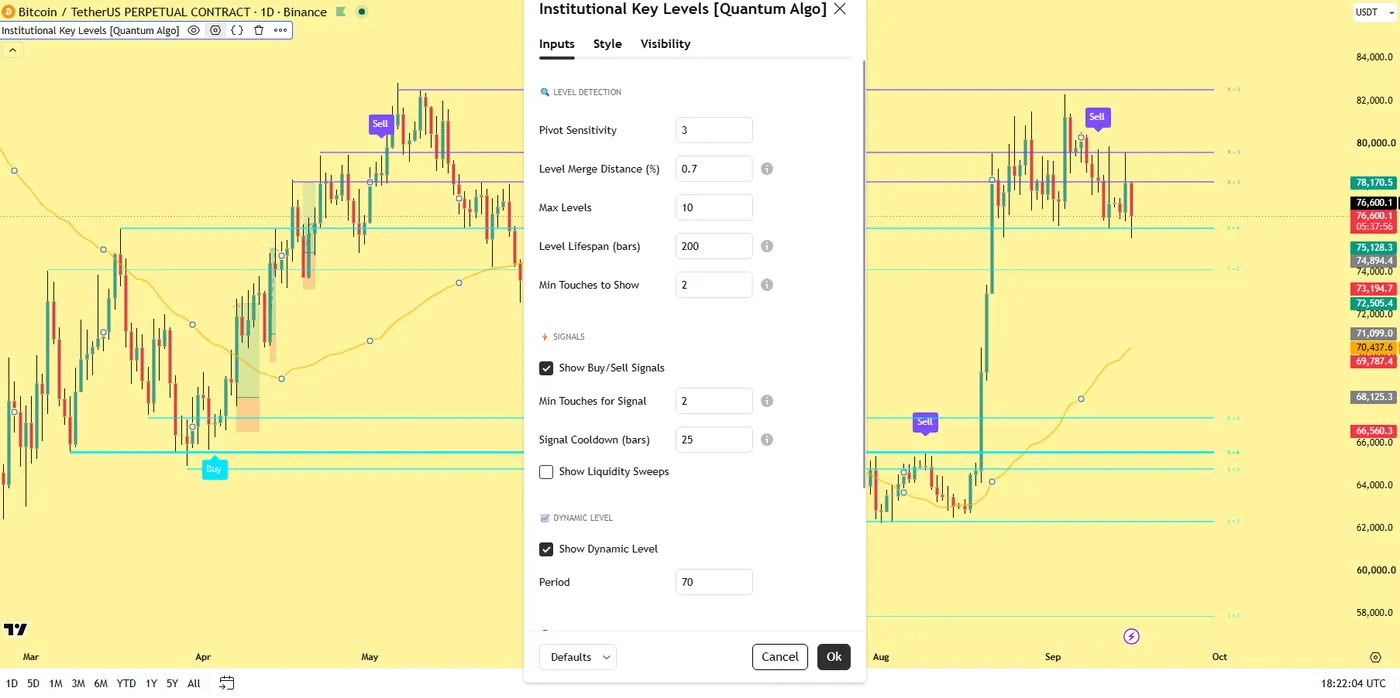
The Bitcoin 6-hour and daily screenshots on this page show the ranked levels with their touch counts and the dynamic level; the settings screenshot shows the detection group.
What it draws
Support and resistance lines
Ranked by touch count, thickness and opacity scaling with strength, labelled "S × n" / "R × n".
Buy and sell signals
On confirmed rejection candles at qualified levels.
Liquidity sweep markers
When price breaks through a level and closes back on the other side — the institutional trap, distinct from the regular signals.
The dynamic institutional level
A volume-weighted average of typical price that floats with where money is concentrating; when it aligns with a static level the confluence is the highest-probability zone.
How it works
Pivot collection. All pivot highs and lows within the scan window, at the configured sensitivity.
Clustering. Pivots within the Level Merge Distance are grouped; the level's price is the average of the cluster; the touch count is the number of independent pivot confirmations.
Ranking and drawing. Levels are sorted by touch count; the strongest are always visible; five or more touches draw thick, three to four medium, newer levels thin.
Management. Levels are born when clusters form and expire after the lifespan; new interactions are counted continuously; levels below the minimum touch threshold or past their lifespan are removed. The chart cleans itself.
Signals. Three conditions at once: price wicks into or through a qualified level; the candle shows rejection (wick at least 50% of range); the close confirms the direction. A cooldown timer prevents rapid repeats.
Sweeps. A bar that breaks through a level and closes back on the opposite side is marked as a sweep, separately from signals.
Settings
| Group | Input | What it does | Where to start (crypto 1H–4H) |
|---|---|---|---|
| Level detection | Pivot Sensitivity | How significant a swing must be | 3 |
| Level Merge Distance | How close pivots must be to merge | 0.7% | |
| Max Levels | Visible cap | 10 | |
| Level Lifespan | Expiry in bars | 200 | |
| Min Touches | Filters weak levels | 2 | |
| Signals | Buy/sell signals, liquidity sweeps | Independent toggles | on / on |
| Min touches for signals | Only signal at strong levels | 3 | |
| Signal Cooldown | Bars between signals at a level | 25 | |
| Dynamic level | Toggle, period | The volume-weighted institutional level | on / 50 |
| Palette | Resistance, support, sweep, dynamic colours | Appearance | — |
Scalping, 5m–15m: lifespan 100, pivot sensitivity 5–8 for fewer, stronger levels. Swing trading, daily: lifespan 300–400, max levels 5–6 for only the most significant.
How to use it
Trade rejections at strong levels.
When price approaches a level with a high touch count, wait for the rejection candle; if the indicator fires a signal, level and candle agree. Enter in the signal direction with the stop beyond the level — the stop-loss page has the distance rule.
Use touch count for conviction.
A seven-touch level is far more significant than a two-touch one; size accordingly.
Watch for dynamic-level confluence.
When the gold dynamic line sits on a static level, the probability of a reaction rises; these are the highest-confidence setups.
Read the sweep markers as traps.
A sweep of a strong level followed by a reclaim is the Smart Money entry the Liquidity Sweeps indicator is built for; the two tools together are the pair we run on the daily chart.
Adjust for timeframe.
Lower sensitivity and lifespan on fast charts; raise them on slow ones.
Three setups
Rejection at a 5+ touch level with a signal — the indicator's own trade: rejection candle, close confirmation, stop beyond the level, target at the next ranked level.
Dynamic-level confluence — the volume-weighted level and a static level within a few ticks; the reaction there is the strongest the tool finds.
Sweep and reclaim of a ranked level — the marker prints, price closes back, and the next candle confirms; the stop goes beyond the sweep wick, the target is the level on the other side of the range.
How it compares
Against the popular support-and-resistance scripts: boxes versus lines, every touch versus confirmed rejections, permanent versus expiring levels, and no clustering versus pivot clustering. Against the Liquidity Sweeps indicator: that one maps every swing as a pool and detects sweeps; this one ranks clustered levels by strength and signals rejections, with sweeps as a secondary marker — they are complementary. Against Zeno: Zeno's signals come from structure and order flow with entry, stop and targets; this indicator is the level map to read them against, and the Institutional Volume Profile shows where the volume sits at each level.
Limitations
Levels are only as significant as the pivot sensitivity makes them; too low a setting fills the chart, too high misses intraday levels. The dynamic level depends on volume quality. Signals require the strict rejection shape and so will skip some reactions — by design. All drawing is managed within TradingView's object limits.
Step-by-step: adding it to your TradingView chart
Open the script page on TradingView (link above) and click Add to favorites, then Use on chart — or on any chart, open Indicators, search "Institutional Key Levels Quantum Algo" and add it. It is free on every TradingView plan, including the free tier.
Open the indicator's settings (the gear icon on its label) and set the inputs for your market and timeframe from the table above; the defaults are tuned for crypto and gold on intraday charts.
In the Style tab, match the colours to your chart theme; the dashboard position and text size are in Inputs.
To set alerts, right-click the chart → Add alert, choose the indicator as the condition and pick the event you want; set the trigger to "Once per bar close" so alerts match the closed-bar logic.
Save the chart layout so the indicator loads with it, and — if you use our other free tools — add them to the same layout; they are designed to sit together without clutter.
To read or reuse the code, click Source code on the script page. Republishing is subject to TradingView's house rules; personal modification is not.
Inside the code, for developers
The script is Pine Script v5, published open source. The pieces worth reading if you want to modify it:
Pivot confirmation
Uses ta.pivothigh / ta.pivotlow with a symmetric lookback, which is why every structural event lags by the pivot length — the deliberate cost of a non-repainting result.
State is held in arrays
Of boxes, lines and labels with explicit life-cycle functions (create, update, retire), capped by the "keep" inputs; TradingView's object limits are respected by design.
Everything evaluates on barstate.isconfirmed
The developing bar is never used for detection or signals.
Alerts
Use named alertcondition calls (or alert() where the message carries data), so webhooks receive a consistent payload.
If you build on it, our Pine Script tutorials in the Academy and the TradingView backtesting guide cover strategy conversion and testing.
Using it with the other free indicators
The five Smart Money tools are built to layer: the Smart Money Concepts Engine for bias and the score; Order Blocks with Volume for the zone and its quality; Fair Value Gaps + Inversion for the imbalance and the polarity flip; Liquidity Sweeps for the trigger; Institutional Key Levels for the ranked map the rest is read against. A full read on one chart: bias from the engine's swing tier → the nearest ranked level → a sweep of the liquidity there → a return to a high-volume block or an inverted gap → entry with the stop beyond the sweep and the target at the next level. The free-indicators hub lists every tool; the SMC guide is the method behind the layering.
Common mistakes with this indicator
- Trusting the developing bar — every event here waits for the close, and so should you.
- Trading every marker — the tool highlights context and locations; the entry needs confirmation from structure and a stop beyond the level.
- Running it on the wrong timeframe with default lengths — adjust the pivot inputs to the chart, as the settings table shows.
- Ignoring volume quality — on CFD tick-volume feeds the volume features are indicative; on exchanges and futures they are real.
- Stacking too many tools — the five free indicators layer; ten random scripts do not.
Want the signal, not just the structure?
Zeno reads the same Smart Money structure across timeframes and prints the entry, stop, TP1 and TP2 on your chart — with a public record of 160 posted trades, 120 wins and 40 losses at the stated levels. QuantumBot executes it on Bybit, Binance, OKX, Bitget and Kraken.

Glossary for this indicator
Frequently asked questions
Does the key levels indicator repaint?
Signals fire on the close of the rejection candle and levels come from confirmed pivots; a level's touch count and thickness update as new pivots confirm, which is the level growing stronger, not repainting.
What does "S × 7" mean?
A support level that has received seven independent pivot confirmations. The higher the count, the thicker and more opaque the line, and the more institutional interest it represents.
What is the dynamic institutional level?
A volume-weighted average of typical price over the configured period — a floating anchor for where money is concentrating. Its confluence with a static level marks the highest-probability zones.
Why did a level disappear?
It exceeded its lifespan or fell below the minimum touch threshold. Expiry keeps the chart on the levels that matter to current structure.
Which settings for scalping?
Lifespan 100 and pivot sensitivity 5–8 on 5-minute to 15-minute charts for fewer, stronger levels; keep the signal cooldown at 25 bars.
Is it free?
Yes — open source on TradingView; the code and the clustering logic are there to read.
How does it relate to Zeno?
Zeno prints the signal with entry, stop and targets; this free indicator draws the ranked levels those signals are read against, and pairs with the Institutional Volume Profile for the volume at each level.
How is this different from a pivot-point indicator?
Pivot points are computed from yesterday's range by formula; these levels come from actual swing points clustered by price and ranked by how many times they have been tested. They are where price has reacted, not where a formula says it might.
Why do line thicknesses change?
Thickness and opacity scale with touch count: five or more touches thick, three to four medium, new levels thin. A level growing thicker is gaining confirmations.
Can I turn signals off and keep the levels?
Yes — buy/sell signals and sweep markers toggle independently; many traders run the levels as a map and take entries from the Liquidity Sweeps or Order Blocks tools.
What is the signal cooldown for?
It prevents consecutive signals at the same level within the configured number of bars, which removes the noise other support-and-resistance indicators produce on every touch.
Does it work on stocks?
Yes; the dynamic level and the clustering both benefit from real exchange volume and clean sessions. Use the stock merge distance around 0.5%.
How does it relate to Zeno?
Zeno prints signals with entry, stop and targets from structure; this free indicator draws the ranked level map they are read against, and pairs with the Institutional Volume Profile for volume at each level.
The other free Smart Money indicators
Built to layer on one chart: the engine for bias and the score, the dedicated tools for each element.
Add Institutional Key Levels to your chart
One click on TradingView, free on every plan, code you can read. Nothing repaints.