Candle Range Theory (CRT): The Three-Candle Model, Traded Properly
Candle Range Theory (CRT) is a three-candle model read on a higher timeframe: candle 1 sets a range with its high and low, candle 2 sweeps one side of that range and closes back inside it, and candle 3 expands toward the opposite side. You trade the sweep on a lower timeframe — usually 4H candles entered on the 15-minute chart — with the stop beyond candle 2's wick and the target at the far end of candle 1. It is ICT's Power of Three with the candle, not the session, as the unit.
I came to CRT sceptical, because most things that trend on trading X are old ideas with a new acronym. That is exactly what it is — and the packaging is good enough that it is worth learning on its own terms. Three candles, one rule for the second one, and a stop that is never in doubt. This page is the model, the timeframe pairs, the entry step by step, a BTCUSDT example with real-looking numbers, how it relates to Power of Three and Turtle Soup, and the five ways it fails. The calculator turns candle 1 and the sweep into a plan.
Indicators that prove themselves in public.
One engine, four precision tools — the Gold (XAU) Scalper, the institutional Gravity Zone, the Zeno momentum Oscillator, and Zeno Stocks for equities.



What is Candle Range Theory?
Candle Range Theory, usually shortened to CRT, is a three-candle model read on a higher timeframe. The first candle defines a range with its high and its low. The second candle pushes through one side of that range, takes the stops resting there, and closes back inside it. The third candle expands toward the opposite side. The trade is the second candle's sweep, entered on a lower timeframe, with the stop beyond the wick and the target at the far end of the first candle.
That is the whole model, and its appeal is that it is small. There is no indicator, no drawing tool, nothing to calibrate. You look at three 4-hour candles, or three daily candles, and either the second one has swept the first and closed back inside or it has not. CRT was popularised on X by the trader Romeo (RomeoTPT) and it is, in the plainest terms, ICT's Power of Three applied to a candle instead of a session: accumulation is candle 1, manipulation is candle 2, distribution is candle 3.
What it does not do matters as much. CRT does not tell you which candle will be the manipulation until it has closed. It does not forecast the size of candle 3. And it says nothing about direction on its own — a 4H sweep of the low inside a daily downtrend is a countertrend trade, however textbook the candles look. The model gives you a location and a sequence. Bias comes from the timeframe above.
The three candles
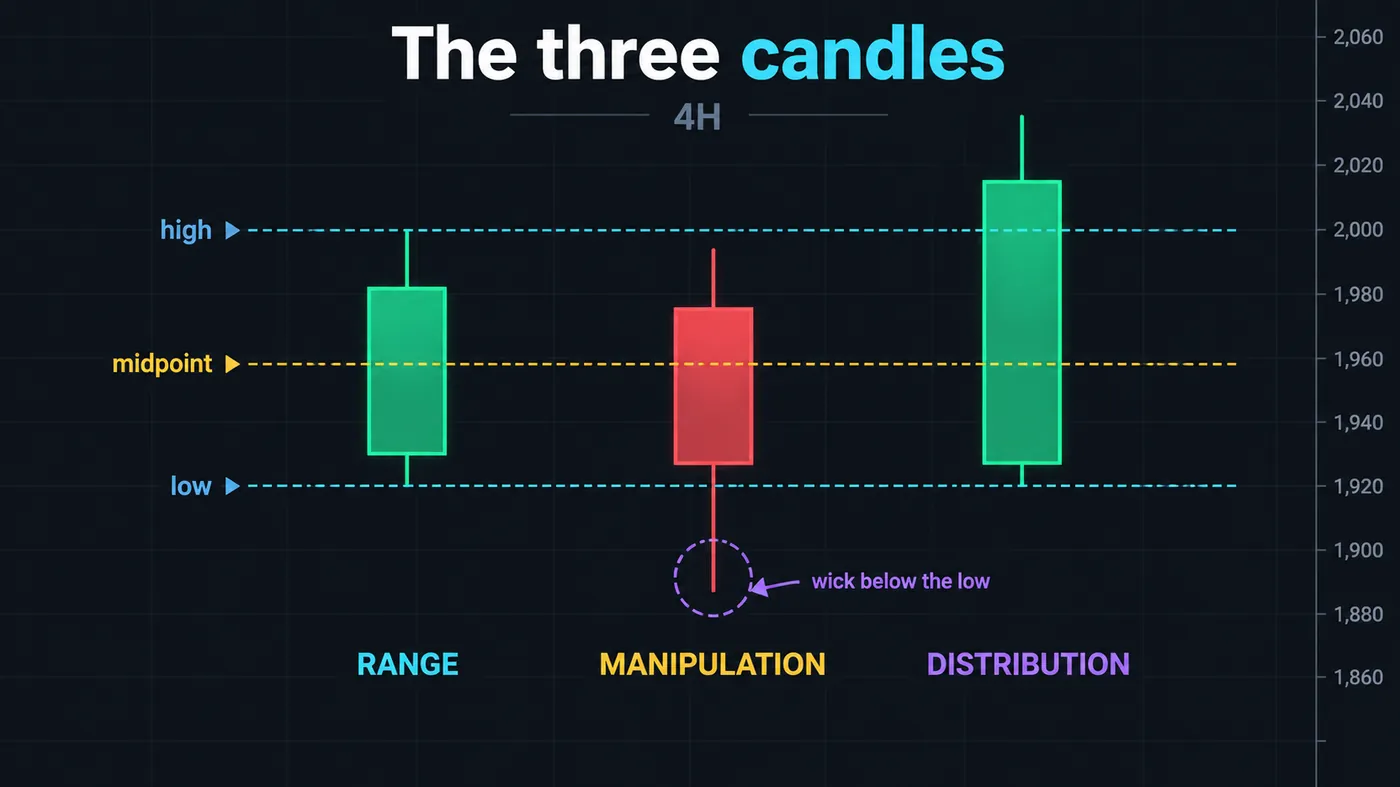
Candle 1, the range. Any candle can be candle 1; it simply sets the high and the low that the next candle will interact with. In practice the ones worth watching are the candles that open at a time the market cares about — the 4H candle that opens at 01:00, 05:00 or 09:00 New York, the daily candle at 00:00 UTC on crypto or 17:00 ET on futures, the weekly candle. Those opens are where the institutional order flow resets, so their ranges are the ones that get run.
Candle 2, the manipulation. This candle must trade beyond one side of candle 1 and close back inside candle 1's range. Both halves are required. A candle that closes beyond the range is not a sweep, it is a breakout, and CRT has nothing to say about it. A candle that never leaves the range is an inside bar — also not CRT. The wick that goes beyond is the liquidity sweep; the close back inside is the failure that makes the sweep tradable. The deeper the wick relative to the range, the more stops it collected and the worse your risk-to-reward becomes, which the calculator below will show you.
Candle 3, the distribution. The expansion candle. It opens inside the range and travels toward the side that was not swept. It is the candle you are paid by, and the candle you never trade off, because by the time it has printed the move is over. Everything you do happens while candle 2 is forming and, at the latest, in the first quarter of candle 3.
Which timeframe pairs to use
CRT is always two timeframes: the one you read the three candles on and the one you enter on. The pairing is roughly 16:1 — a 4H candle contains sixteen 15-minute candles, a daily candle contains twenty-four 1-hour candles. That ratio matters because the lower timeframe has to be fine enough to show a structure shift inside the sweep, and coarse enough that one shift means something.
| Read the candles on | Enter on | Candle opens that matter (New York time) | Typical hold |
|---|---|---|---|
| 4H | 15M | 01:00 · 05:00 · 09:00 · 13:00 (the four candles that bracket London and New York) | 4–12 hours |
| 1H | 5M | Each hour; the 09:00, 10:00 and 15:00 candles in New York carry the most | 1–4 hours |
| Daily | 1H | 00:00 UTC on crypto perpetuals; 17:00 ET on CME futures; 00:00 ET on forex | 1–3 days |
| Weekly | 4H | Sunday 17:00 ET open | 1–2 weeks |
The 4H/15M pairing is the one most CRT traders run, and the reason is the 4H candle boundaries. The 01:00, 05:00 and 09:00 New York candles line up with the London open, the London–New York overlap and the New York open, so a 4H sweep is usually a session sweep seen at a lower resolution. That is also why CRT and the ICT macros overlap so often: the 09:50–10:10 macro sits in the first hour of the 09:00 4H candle, and a sweep in that macro is frequently the manipulation leg of the candle.

Automate your trades. Let Quantum Algo trade for you.
Every signal executed on your own account — on your account, with the plan you define.
The entry model, step by step
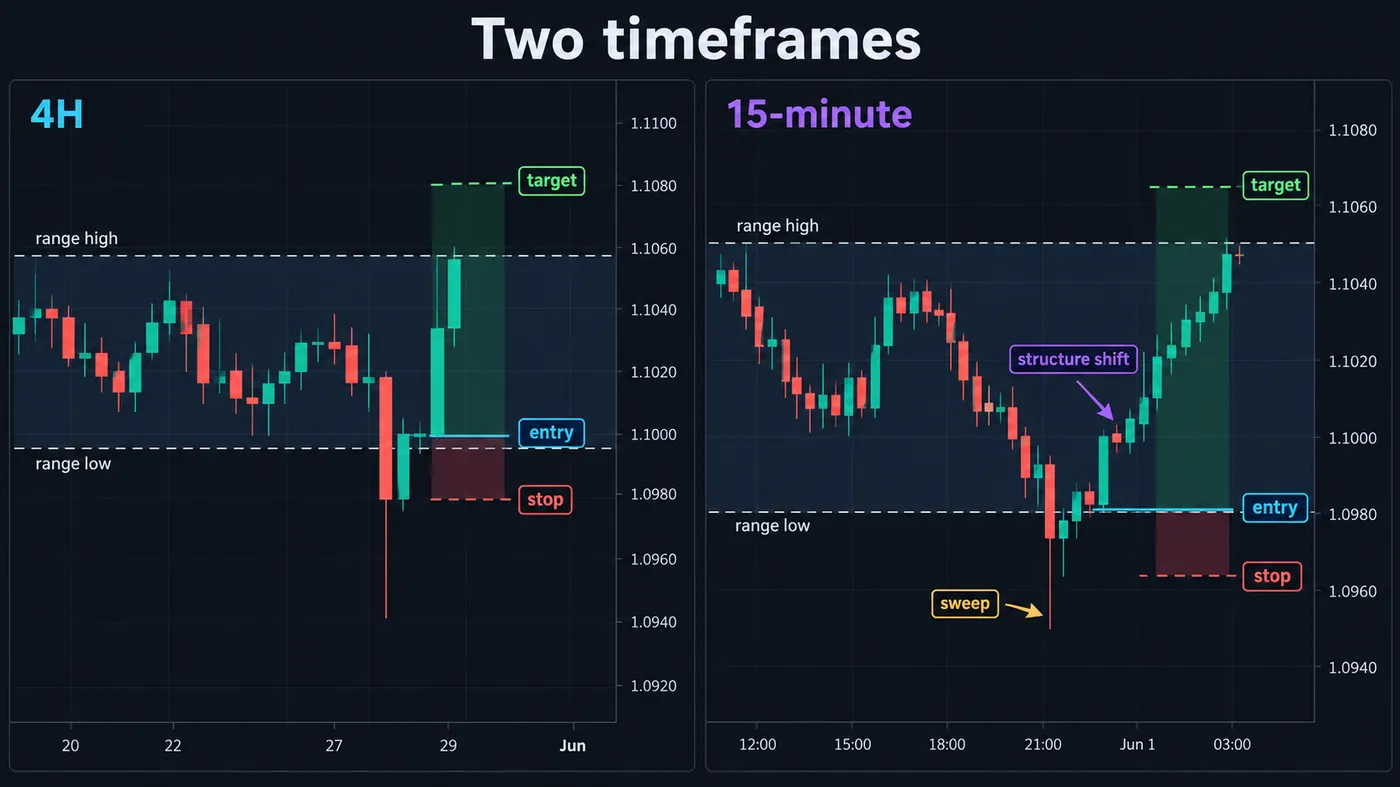
- Mark candle 1. When a 4H candle closes at one of the key opens, draw its high and its low. Mark the midpoint as well — half the range is where partials go.
- Wait for the sweep. Candle 2 has to trade beyond one side. Do nothing until price is beyond the level and, ideally, until the 15-minute chart shows a swing beyond it. A sweep that has not yet failed is just a breakout in progress.
- Confirm the failure on the 15-minute chart. You want a market structure shift back inside the range: a 15M close above the last 15M lower high (for a bullish CRT) after the low was swept. The 4H close back inside the range is the formal confirmation, but waiting for it costs most of the move; the 15M shift is the working signal.
- Enter at the returned level or the gap. Two entries. The aggressive one is the retest of candle 1's low from inside the range — the level that was swept, now acting as support. The patient one is the 15M fair value gap left by the shift. Both have the same stop.
- Stop beyond the sweep wick. A few ticks or a fraction of ATR beyond the extreme of candle 2's wick. If price goes back through that wick the sweep has failed to fail, and the model is wrong.
- Target the opposite side of candle 1. Partial at the midpoint, the rest at candle 1's high. If candle 3 closes beyond the high with displacement, trail the remainder under 15M structure; if it stalls at the high, take it. The high is the draw, not a promise.
Reference data
| Item | Value |
|---|---|
| Candles in the model | 3 — range, manipulation, distribution |
| Qualifying condition for candle 2 | Trades beyond one side of candle 1 and closes inside candle 1's range |
| Disqualifying closes | Candle 2 closes beyond the range (breakout) or never leaves it (inside bar) |
| Standard timeframe pairs | 4H/15M · 1H/5M · Daily/1H · Weekly/4H |
| Key 4H opens (New York time) | 01:00 · 05:00 · 09:00 · 13:00 |
| Entry | Retest of the swept level from inside the range, or the LTF fair value gap after the shift |
| Stop | Beyond the extreme of candle 2's wick |
| Targets | Midpoint of candle 1 (partial), opposite side of candle 1 (full) |
| Origin | ICT Power of Three (accumulation, manipulation, distribution) applied per candle; popularised as CRT by Romeo (RomeoTPT) |
| Related models | Turtle Soup (Raschke and Connors), swing failure pattern, judas swing, Silver Bullet |
CRT level calculator
Put in candle 1's high and low and the extreme of candle 2's wick. The tool returns the entry, the stop, both targets and the R multiple to each, and flags a sweep too deep to be worth taking.
Worked example: BTCUSDT, 4H into 15M
Take a BTCUSDT perpetual 4H candle that opened at 05:00 New York and closed with a high of 64,980 and a low of 63,640 — a 1,340-point range, unremarkable for Bitcoin on a London morning. That is candle 1. The 09:00 candle opens at 64,210, sells off through the New York open and prints 63,410 at 09:58, 230 points under candle 1's low, right inside the 09:50–10:10 macro. On the 15-minute chart the 09:45 candle makes the low, the 10:00 candle closes back above 63,640, and the 10:15 candle closes above the 09:30 lower high at 63,905. That close is the shift.
The entry is the retest of 63,640 at 10:40. The stop goes at 63,350, sixty points under the wick, for 290 of risk. The midpoint of candle 1 is 64,310 — 670 points away, 2.3R. Candle 1's high at 64,980 is 1,340 away, 4.6R. The 09:00 candle closed at 64,120, inside the range, which confirmed the model; the 13:00 candle opened and drove to 65,040 by 15:20, through the high. Partial at the midpoint, remainder at the high: a blended 3.5R for a trade that lasted five hours and was defined entirely by three candles and one 15-minute close.
Note what the numbers did not require. No indicator settings, no drawing of order blocks, no debate about which fib level. The sweep depth was 17% of the range, which is on the shallow side; had the wick gone to 62,900 — a 55% sweep — the stop would have sat 800 points away and the midpoint would have paid under 1R. The calculator above rejects that trade for exactly that reason.
CRT versus Power of Three, Turtle Soup and the SFP
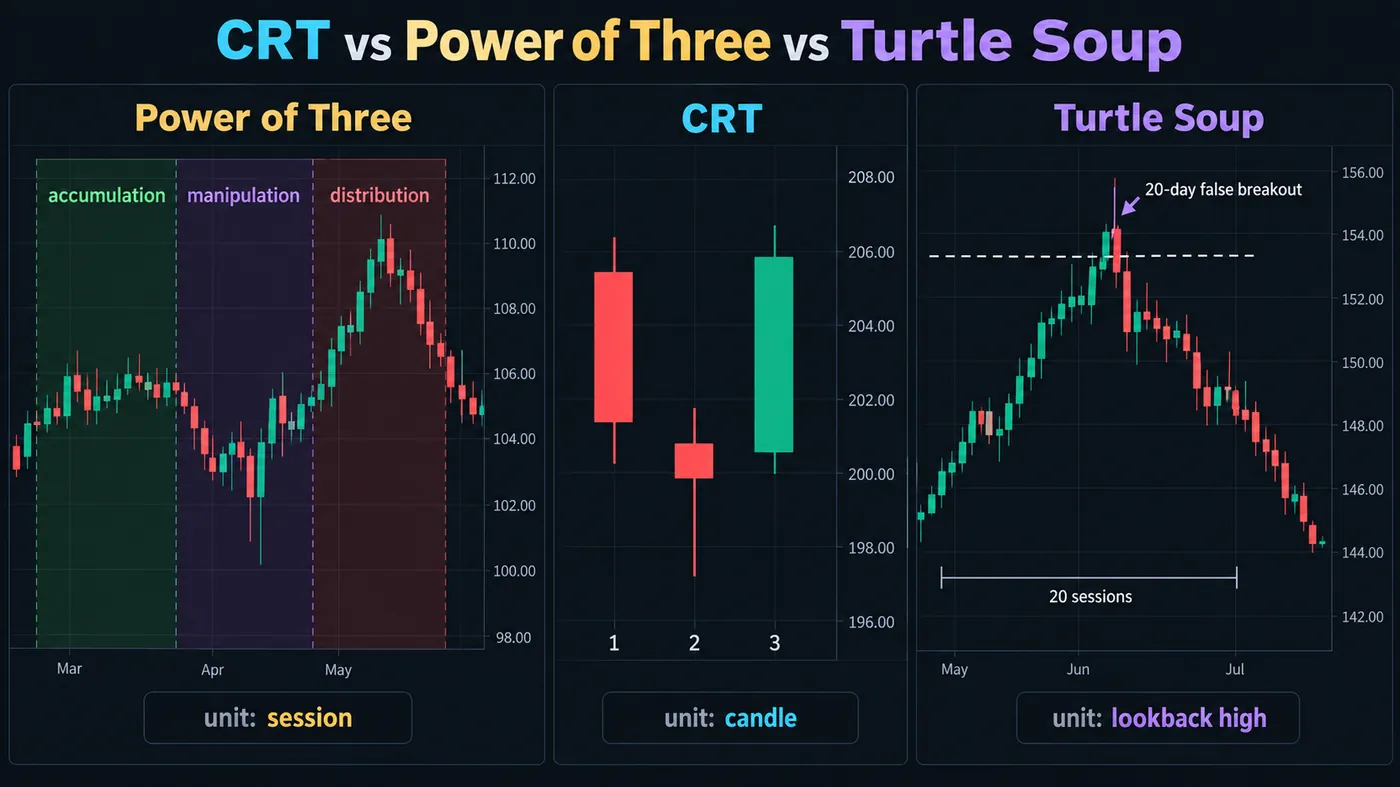
CRT is not a new idea, it is a tidy packaging of several old ones. Knowing which is which stops you from stacking the same signal three times and calling it confluence.
| Model | What defines it | Timeframe logic | Where it differs from CRT |
|---|---|---|---|
| Candle Range Theory | Three candles: range, sweep-and-close-inside, expansion | HTF candles, LTF entry | — |
| Power of Three (AMD) | Accumulation, manipulation, distribution across a session or a day | Session-based | CRT is PO3 with the candle as the unit instead of the session; same logic, tighter definition |
| Turtle Soup | False breakout of a 20-day high or low, fade it | Daily, lookback-based | Turtle Soup needs a lookback high; CRT only needs the previous candle |
| Swing failure pattern | A wick beyond a swing point with a close back inside | Any timeframe, swing-based | An SFP is the candle-2 event on its own; CRT adds candle 1 as the reference and candle 3 as the target |
| Judas swing | The false move early in a session before the real direction | Session open | A judas swing is candle 2 of a session-level CRT |
Where CRT fails
Trending higher timeframes. A 4H sweep of the low in a daily downtrend gets you a bounce to the midpoint, sometimes, and then a fresh low. The model is symmetrical; markets are not. Read the daily and weekly candle first, and take 4H CRTs only in the direction of the daily candle's open-to-current, or accept that the countertrend ones get partials at CE and nothing more.
Candle 2 closes outside. This is the most common way it fails and it is not a failure of the model, it is the model correctly telling you there was no sweep. A 4H close beyond the range is a breakout; the level you were waiting to fade has become the level to buy the retest of. Do not carry a CRT bias through a close that invalidates it.
Deep sweeps. When the wick takes more than about 40% of candle 1's range, the stop is far and the midpoint is close, and the maths stops working. Deep sweeps also tend to mean the range was not the real reference — there was a larger pool below it. Zoom out one candle.
No lower-timeframe shift. Price can poke below a level and drift back above it without any displacement, without a 15M candle closing through a lower high. That is a range, not a manipulation. Without the shift you have a level and a hope, and a stop that will be hit by the second poke.
News candles. A 4H candle containing CPI or FOMC produces a wick, a close inside and then whatever the market decides. The three-candle logic still holds but the second candle's wick was made by a headline, not by a stop run, and candle 3 does not owe it anything.
Mistakes traders make with CRT
- Treating every candle as candle 1. The model works because certain candles matter more; the 03:00 4H candle on a Tuesday is not the 09:00 candle. Mark the ones at key opens and ignore the rest.
- Entering during the sweep. Price beyond candle 1's low is where the trade is being set up, not where it is taken. Wait for the lower-timeframe close back inside and the shift.
- Targeting the candle-2 wick as a re-entry. Once price has returned inside the range the wick is spent. Buying a second dip toward it is buying a level that has already been used.
- Ignoring the ratio. CRT on a 4H candle with 15M entries is a five-hour trade; managing it with 1-minute candles adds noise and no information.
- Stacking it with the same signal under a different name. The 15M SFP inside the 4H sweep inside the London judas swing is one event described three ways. Count it once.
- Holding for the far target on every trade. The opposite side of candle 1 is the draw. Sometimes candle 3 is a doji. Take the midpoint and let the rest breathe.
CRT and the free indicators
Two of the free scripts do the mechanical part of this. The Liquidity Sweeps indicator marks the wick-beyond-and-close-inside event on any timeframe, which is candle 2 in a single label. Sessionscope draws the session boxes and the killzones, so the 4H candles that matter are the ones sitting on a session boundary you can see. Run both on the 15-minute chart with the 4H candle high and low drawn by hand, and the setup announces itself. The premium engine, Zeno, does not mark CRTs — it gives signals with a stop and targets, and a 4H sweep is one of the contexts its signals print in.
Three candles, one condition. Candle 2 has to go beyond candle 1 and close back inside — that close is the whole signal. Enter on the lower timeframe after the shift, stop beyond the wick, partial at the midpoint, the rest at the far side of candle 1. Take it with the daily candle, not against it, and skip sweeps deeper than about 40% of the range.
◆ Interactive check
Do you know the three candles?
Questions traders ask about Candle Range Theory
A three-candle model. One candle sets a range, the next sweeps one side of it and closes back inside, and the third expands to the other side. You trade the sweep on a lower timeframe, with the stop beyond the wick and the target at the far end of the first candle.
The acronym and the packaging were popularised by the trader Romeo (RomeoTPT) on X. The underlying logic is ICT's Power of Three — accumulation, manipulation, distribution — applied to a single candle rather than a session, and the candle-2 event is the same thing Raschke and Connors described as Turtle Soup in the 1990s.
4H candles with 15-minute entries is the standard, because the 01:00, 05:00 and 09:00 New York 4H opens line up with the London and New York sessions. 1H/5M, Daily/1H and Weekly/4H follow the same ratio of roughly sixteen lower-timeframe candles per higher-timeframe candle.
Yes, and the 00:00 UTC daily candle on Bitcoin and Ethereum perpetuals is one of the cleanest candle-1 references there is, because it is where funding, open interest and the exchange day reset. The 4H candles on Binance and Bybit open at 00:00, 04:00, 08:00 UTC and so on, which is 20:00, 00:00, 04:00 New York — not the same boundaries as the ICT 4H candles, so check which clock your chart is on.
An SFP is the candle-2 event alone: a wick beyond a swing point with a close back inside. CRT adds the reference (candle 1 as the range being swept) and the target (the opposite side of candle 1). Every CRT contains an SFP; not every SFP is part of a CRT.
Beyond the extreme of candle 2's wick, plus a small buffer for spread and noise. If price trades back through that wick the manipulation has not held and the model is wrong for that candle.
There is no fixed rule, but once the wick has taken more than about 40% of candle 1's range the stop is far, the midpoint is close, and the trade rarely pays 2R. Deep sweeps also often mean the real pool of stops was lower and candle 1 was not the reference. Zoom out one candle.
Yes. The model needs a range, a sweep, a lower-timeframe reversal and a target. You can confirm the reversal with a break of a lower high, a candle close, or an indicator signal — the ICT vocabulary (fair value gap, market structure shift) is the most precise way to describe the entry, not a requirement.
The free Liquidity Sweeps indicator labels the wick-beyond-and-close-inside event on any timeframe, which is candle 2. Sessionscope draws the session boxes so the 4H candles that sit on a session boundary are obvious. Zeno, the premium engine, does not mark CRTs; it prints buy and sell signals with a stop and targets, and many of those print inside a 4H sweep.
References & Related Guides
Read next
- Power of Three (AMD): The Complete ICT Guide
- Liquidity Sweep Trading
- Swing Failure Pattern (SFP)
- ICT Macros: The Time Windows
- Fair Value Gaps: Complete Guide
- What Is a Market Structure Shift?
- Higher Timeframe Bias
- ICT 2022 Model
- Liquidity Sweeps (free indicator)
- Sessionscope (free indicator)
- Turtle Soup — glossary
- Zeno — the premium engine
Primary sources
- TradingView Pine Script reference: request.security (reading higher-timeframe candles)
- CME Group: trading hours (the 17:00 ET futures open)
- The Inner Circle Trader on YouTube (Power of Three, the origin of the model)
- Raschke and Connors, Street Smarts (1995) — Turtle Soup, the original false-breakout fade