Market Structure Shift (MSS)
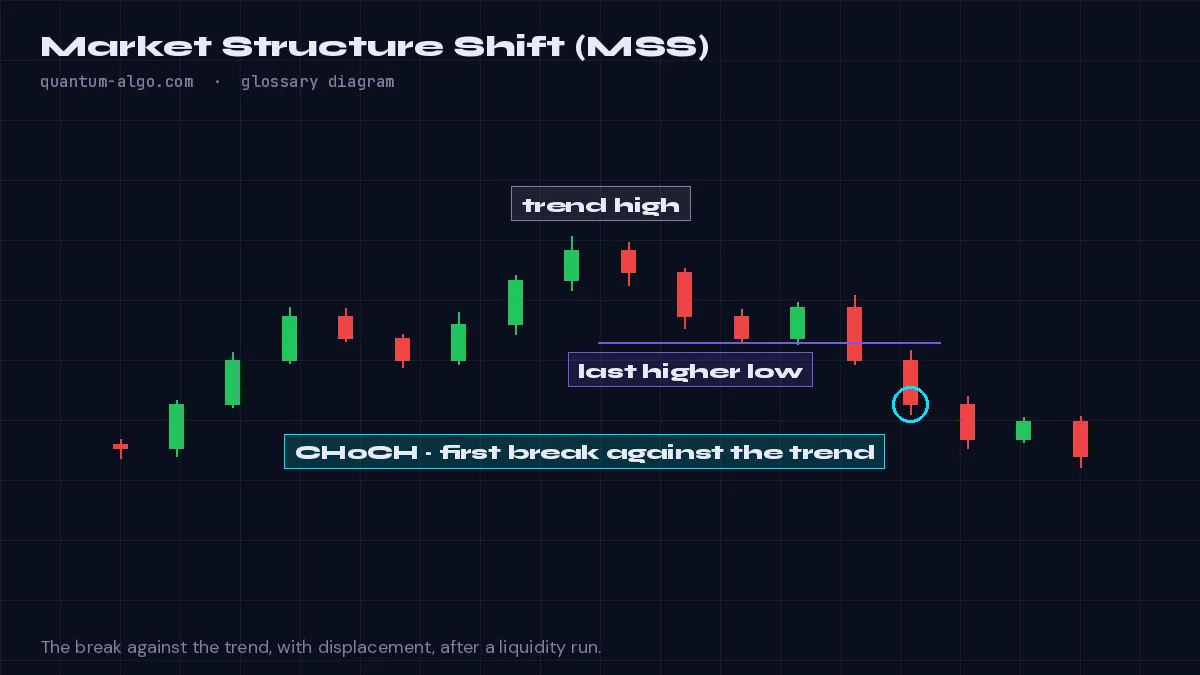
A market structure shift is a break of a short-term swing point against the prevailing trend, made with displacement right after a liquidity sweep. It is ICT's confirmation that a reversal has begun. Traders use it on the 1–15 minute entry timeframe and enter on the return to the FVG or order block the displacement created.
◆Full guide: What Is a Market Structure Shift (MSS)?
What it means
A market structure shift is the ICT term for what SMC traders call a change of character, with one extra condition: it must come with displacement and it should follow a liquidity run. Price sweeps a high, then breaks the most recent short-term low with a large-bodied candle — that break is the MSS. The gap left by the displacement becomes the entry.
The MSS is the first confirmation in the reversal sequence: sweep → MSS → return to the FVG or order block → expansion. Without displacement the break is just a swing violation and the odds are ordinary; with displacement it signals real order flow behind the reversal.
Traders use the MSS on the entry timeframe (1–15 minutes) after the higher timeframe has reached a point of interest. It is the trigger, not the bias.
How to identify it on a chart
- After a liquidity sweep, mark the most recent opposing short-term swing.
- A candle body closes beyond it with displacement — that is the MSS.
- Enter on the return to the fair value gap or order block created by the displacement.
Worked example
NQ sweeps the overnight high at 09:35, then a 2-minute candle drops 30 points closing below the 09:28 low. That close is the MSS; the gap it left is the short entry on the retest.
See it on the chart, read it in depth
Frequently asked questions
Is a market structure shift the same as a CHoCH?
Nearly: both are the first break against the trend. ICT's MSS adds the requirement of displacement and typically follows a liquidity sweep.
How is MSS different from BOS?
A BOS confirms continuation; an MSS marks the start of a reversal.
What if there is no displacement?
Then it is a weak break — wait for the next one or for the displacement to arrive.
Which indicator marks it?
The Smart Money Concepts Engine labels CHoCH/MSS events and their displacement.
Related terms
See Market Structure Shift (MSS) on your TradingView chart
Zeno reads Smart Money structure across timeframes and prints the entry, stop and targets — with a public record of every posted trade. The free indicators draw the concepts this page defines.