Swing Failure Pattern (SFP)
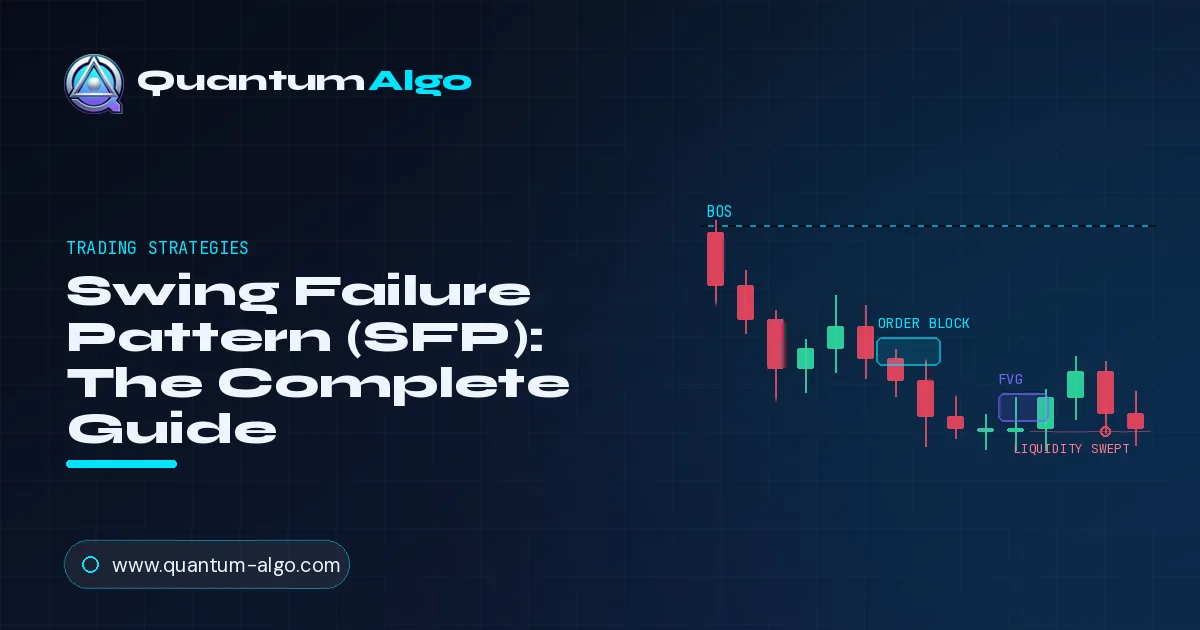
A Swing Failure Pattern (SFP) is a reversal setup where price briefly trades beyond a prior swing high or low, sweeping the liquidity there, then closes back inside the range. The close is everything: a candle closing beyond the level is a breakout, not an SFP. Enter on the rejection close, stop beyond the sweep, target the opposite liquidity pool.
What is a Swing Failure Pattern (SFP)?
A Swing Failure Pattern, universally abbreviated SFP, is a reversal pattern rooted in Smart Money Concepts. It occurs when price pushes beyond an obvious swing high or swing low, takes out the liquidity resting there, and then fails to continue — snapping back inside the prior range and closing on the other side of the level it just broke.
Related: swing points.
To understand why the SFP is so powerful, you have to understand what sits at swing points. A prior swing low is not just a price level; it is a shelf of resting orders. Below it sit the protective stop-losses of everyone who bought near that low, plus the entry orders of breakout sellers waiting for the level to break.
That cluster of orders is liquidity — and liquidity is exactly what large institutions need to fill their own positions. So when price dips below the swing low, triggers all those stops and breakout entries, and then immediately reverses, what looks like a failed breakdown is actually a deliberate harvest.
The institutions have used the retail reaction to fill their buy orders, and now price is free to reverse upward against a crowd of trapped sellers. The SFP is the visible signature of that harvest — and once you can read it, obvious support and resistance breaks stop looking like breakouts and start looking like traps.
How does an SFP unfold from sweep to reversal?
Every SFP unfolds in the same sequence. Walk through it step by step below, then we will break down what each stage means for your entry.
The critical detail — the one that separates an SFP from an ordinary breakout — is the close. Price must trade beyond the level intrabar (the sweep) but close back inside the range. A candle that wicks below a swing low and closes back above it is an SFP; a candle that closes below the low is a genuine breakdown.
This is why SFPs are best read on closed candles: the wick shows the liquidity grab, and the close confirms the failure. The trapped traders on the wrong side of that close become forced buyers (or sellers) as price reverses, and their scramble to exit adds momentum to the move you are trading.
What is the difference between bullish and bearish SFPs?
SFPs form in both directions, and the logic is a mirror image. Knowing which is which keeps you on the right side of the trap.
Bullish SFP
Price sweeps below a prior swing low, grabbing the stops of longs and the entries of breakout shorts, then closes back above the low. Trapped sellers must cover, fuelling an upward reversal. You look to buy the rejection.
Bearish SFP
Price sweeps above a prior swing high, grabbing the stops of shorts and the entries of breakout longs, then closes back below the high. Trapped buyers must sell, fuelling a downward reversal. You look to sell the rejection.
In both cases, the pattern targets the most obvious liquidity on the chart — the highs and lows that every retail trader can see and that therefore accumulate the most resting orders. This is why SFPs at equal highs or equal lows are especially reliable: a double bottom or double top is a magnet for stops, and a sweep of that obvious level followed by a failure is a textbook institutional liquidity grab.
The more obvious the level, the more liquidity rests behind it, and the more meaningful its failure becomes. Learning to read these alongside support and resistance will completely change how you interpret a level being ‘broken’.
How to trade a Swing Failure Pattern
The SFP gives you an unusually clean trade structure because the pattern itself defines your entry, stop and target. Here is the process for a bullish SFP; simply invert it for a bearish one.
- Mark the liquidity. Identify a clear prior swing low — ideally equal lows or an obvious support — where stops are likely resting.
- Wait for the sweep and close. Let price trade below the low and, crucially, close back above it. Act on the closed candle, not the intrabar wick.
- Enter on the rejection. Enter as the SFP candle closes, or on a small retracement into the level. Aggressive traders enter on the close; conservative traders wait for a shift in structure to confirm.
- Stop below the wick. Place your stop just beneath the low of the sweep. If price trades back below that wick, the pattern failed — giving you a tight, well-defined invalidation.
- Target opposite liquidity. Aim for the next pool of liquidity above — a prior swing high, equal highs, or an unfilled gap — taking partials and managing per your risk rules.
The reason SFPs offer such attractive risk-to-reward is the geometry of the setup: your stop sits just below the sweep wick — a level price has already rejected — while your target is the entire opposite side of the range. A sweep that fails by only a few points can open a trade that runs for many times its risk.
This asymmetry is the whole appeal, and it is why the SFP is a staple of liquidity-based trading.

Automate your trades. Let Quantum Algo trade for you.
Every signal executed on your own account — 24/7, hands-off.
Confluence that makes an SFP high-probability
Not every sweep-and-reject deserves your capital. The highest-probability SFPs stack several factors together, and learning to demand that confluence is what separates disciplined SFP traders from those who fade every wick.
Obvious liquidity
The swept level should be a level everyone can see — equal highs/lows, a session high/low, or a prior day’s extreme. Obvious levels hold the most stops.
Higher-timeframe context
An SFP that aligns with a higher-timeframe order block, fair value gap, or premium/discount zone is far stronger than one in the middle of a range.
Timing
SFPs that form during a key session open or a known liquidity window carry more weight, because that is when institutions are most active.
Structure shift
A break of short-term structure immediately after the sweep confirms the reversal is underway and reduces the chance of a slow bleed against you.
Think of these as a checklist rather than a menu: the more boxes an SFP ticks, the more confidently you can size the trade. An SFP that sweeps equal lows into a higher-timeframe discount order block during the London open, then shifts structure to the upside, is about as clean as the pattern gets. One that sweeps a random minor low with no other confluence is best left alone.
Demanding confluence is the discipline that turns the SFP from a frequent-but-mediocre signal into a selective, high-conviction edge.
How do you tell an SFP from a genuine breakout?
The hardest skill in trading SFPs is distinguishing a failed sweep from a real breakout, because in the first second they look identical: price trades beyond a level. The difference reveals itself in the follow-through, and knowing what to watch for keeps you from fading genuine trends.
A genuine breakout closes beyond the level and, ideally, retests it from the other side and continues — the level that was resistance becomes support. An SFP trades beyond the level but closes back inside, and then reverses away from the level entirely. The tell is in the reaction: after a real breakout, price accepts the new territory and builds on it; after an SFP, price rejects the new territory violently and abandons it.
This is why patience around the close is non-negotiable. Entering the instant price pokes beyond a level means you are guessing which of the two scenarios is unfolding; waiting for the candle to close removes the guess. If it closes beyond, respect the breakout — you can even trade the retest in the breakout direction. If it closes back inside, you have your SFP.
The discipline to wait one candle is the entire difference between fading a trap and fighting a trend.
SFP vs genuine breakout at a glance
| Feature | Swing Failure Pattern | Genuine breakout |
|---|---|---|
| Move beyond the level | Wick trades beyond the swing high or low | Price trades beyond the swing high or low |
| Candle close | Closes back inside the prior range | Closes beyond the level |
| Follow-through | Rejects the new territory and reverses | Accepts the new territory and builds on it |
| Retest | Price moves away from the level | Broken level is retested from the other side and holds |
| Trade idea | Fade the move back into the range | Trade the retest in the breakout direction |
| Invalidation | Price trades back beyond the sweep wick | Price closes back inside the range |
◆Wait for the candle to close: the close, not the wick, decides which of the two is unfolding.
Is an SFP the same as a stop hunt or liquidity grab?
Traders new to Smart Money Concepts often trip over terminology, because the Swing Failure Pattern overlaps heavily with several other terms. Understanding how they relate removes the confusion and sharpens your reading.
Liquidity grab
The broad concept: any move that reaches beyond a level specifically to trigger the resting orders (liquidity) there. The umbrella term for what is happening.
Stop hunt
A liquidity grab viewed from the retail trader’s perspective — price spikes to a level, triggers stop-losses, then reverses. Emphasises the victims: the stopped-out traders.
Swing Failure Pattern
The specific, visible candle formation that confirms a liquidity grab succeeded: a wick beyond a swing point and a close back inside. The SFP is the footprint the grab leaves behind.
In other words, these are three views of the same event. A liquidity grab is what institutions are doing; a stop hunt is how it feels to the traders on the wrong side; and the SFP is the chart pattern that lets you see it and act on it.
The value of the SFP as a term is that it is precise and mechanical — it gives you an exact, rules-based definition (sweep the level, close back inside) rather than a vague notion that ‘the market hunted stops.’ That precision is what makes it tradeable. When you spot an SFP, you are not just observing that a liquidity grab happened; you have a defined entry, stop, and target built into the pattern.
Treating these terms as interchangeable is fine in conversation, but in your trading it helps to remember that the SFP is the actionable, chart-visible confirmation of the broader liquidity-grab idea.
How do you align an SFP with higher-timeframe zones?
The difference between an SFP that reverses for a scalp and one that reverses for a major swing almost always comes down to higher-timeframe context. An SFP is exponentially more powerful when the level it sweeps sits inside a significant higher-timeframe zone, because then the liquidity grab and a genuine institutional area of interest coincide.
The workflow is top-down. Start on the higher timeframe — the 4-hour or daily — and mark the zones where you would expect institutions to act: order blocks, unfilled fair value gaps, and areas of premium or discount relative to the recent range. These are your areas of interest. Then drop to a lower timeframe and wait for an SFP to form at one of those zones.
A bullish SFP that sweeps a swing low sitting inside a higher-timeframe discount order block is a fundamentally different proposition from a bullish SFP floating in the middle of a range — the first has institutional backing, the second does not.
- Map the HTF zones. On the 4H or daily, mark order blocks, fair value gaps, and premium/discount extremes.
- Wait for price to reach a zone. Be patient until price trades into one of your marked areas of interest.
- Drop down for the SFP. On a lower timeframe, look for a sweep-and-reject SFP right at the zone.
- Enter with alignment. Take the SFP only when its direction agrees with the higher-timeframe zone’s implication — buy discounts, sell premiums.
This alignment does two things at once. It filters out the many low-quality SFPs that form at insignificant levels, and it gives the ones you do take a powerful tailwind, because you are entering exactly where the higher-timeframe story says institutions want to trade. It is the same multi-timeframe discipline that underlies all professional SMC trading: the higher timeframe chooses the location, and the lower timeframe delivers the trigger.
What mistakes do traders make with the Swing Failure Pattern?
- Entering on the wick, not the close. Acting before the candle closes back inside the range means you are guessing between an SFP and a breakout. Wait for the close.
- Fading every sweep. Not every level that gets swept produces an SFP. Without a genuine failure and confluence, a sweep is just a breakout in progress.
- Stops too tight or too loose. The stop belongs just beyond the sweep wick — not inside the wick (too tight) and not far beyond it (too loose). The wick extreme is the logical invalidation.
- Ignoring higher-timeframe direction. An SFP against a strong higher-timeframe trend is lower probability. The best SFPs reverse price back in the direction of the dominant draw on liquidity.
- Chasing after the reversal has already run. The edge is entering on the rejection. Chasing several candles later means a worse price and a wider stop.
- Trading SFPs on illiquid levels. A sweep of a level with few resting orders lacks the trapped-trader fuel that powers the reversal. Favour obvious, liquidity-rich levels.
◆ Test Your Knowledge
Swing Failure Pattern with Quantum Algo
An SFP only works when it sweeps real liquidity and then genuinely fails — and both are hard to judge by eye. Quantum Algo’s Smart Money Concepts tools highlight the equal highs and lows where liquidity rests and flag the structure shift that confirms a sweep has failed, so you can separate true swing failure patterns from ordinary pullbacks and time your entry on the rejection rather than the trap.
Related guides
◇ Frequently Asked Questions
A Swing Failure Pattern (SFP) is a reversal setup that forms when price sweeps beyond a prior swing high or low, taking the liquidity resting there, then fails to hold and closes back inside the range. The failure signals the breakout was a liquidity grab, setting up a reversal.
SFP stands for Swing Failure Pattern. It describes a swing high or low that is briefly broken to grab liquidity and then fails, with price closing back inside the prior range instead of continuing.
Look for price trading beyond an obvious swing high or low and then closing back inside the range on the same or next candle. The wick beyond the level shows the liquidity sweep; the close back inside confirms the failure that defines the SFP.
A breakout closes beyond the level and continues, often retesting it as new support or resistance. An SFP trades beyond the level but closes back inside and reverses away from it. The close is the deciding factor between the two.
Mark a swing high or low with resting liquidity, wait for price to sweep it and close back inside, then enter on the rejection. Place your stop just beyond the sweep wick and target the opposite pool of liquidity, managing risk per your plan.
Place the stop just beyond the extreme of the sweep wick — below the low on a bullish SFP or above the high on a bearish one. If price trades back through that wick, the pattern has failed and you should be out.
A bullish SFP forms when price sweeps below a prior swing low, grabbing the stops of longs and breakout shorts, then closes back above the low. Trapped sellers cover and price reverses upward, so you look to buy the rejection.
The strongest SFPs sweep obvious liquidity such as equal highs or lows, align with higher-timeframe zones like order blocks or fair value gaps, form during active sessions, and are followed by a shift in market structure confirming the reversal.
Yes. The Swing Failure Pattern is a Smart Money Concepts and ICT idea. It is closely related to liquidity sweeps, stop hunts, and the Power of Three, all of which describe how institutions harvest liquidity before the real move.
Trade the close. A wick beyond a level only shows the sweep; the candle must close back inside the range to confirm the failure. Entering before the close means guessing whether an SFP or a breakout is forming.
References & Related Guides
More in this topic
- Backtesting Trading Strategies — Complete Guide
- What Are the Best Indicators for Day Trading?
- What Are the Best Indicators for Scalping?
- What Are the Best Indicators for Swing Trading?
- Best TradingView Strategy — The Definitive Guide
- Breakout Probability: Complete Trading Guide
- Breakout Trading Strategy: Complete Guide
- Day Trading Strategies — The Complete Profitable Guide
- Gap Trading Strategy: Complete Guide
- Grid Trading Strategy: The Complete Guide
- Institutional Trading Strategy: Trade Like Banks
- Position Sizing: The Complete Guide
- Swing Trading Complete Guide: Hold for Days
- Pennant Pattern: Complete Trading Guide
Core reading
- BOS & CHoCH: Complete Market Structure Guide
- Order Blocks Trading: Complete Guide
- Best TradingView Indicators — Complete Guide
- Risk Management in Trading — Complete Guide
- Candlestick Patterns Guide — Engulfing, Pinbar & More
- All Premium Guides
- Quantum Algo on TradingView
- Public Track Record