Sessionscope [Quantum Algo]
The four ICT killzones as range boxes, their highs and lows projected as liquidity, every sweep classified reversal or continuation — and a statistics dashboard that tells you, on your own chart, how often each session's liquidity gets run and how often it snaps back.
The short answer
Sessionscope is a free, open-source TradingView indicator that plots the four primary ICT killzones — Asia, London Open, New York AM and London Close — as range boxes with their highs, lows and equilibrium, projects each closed session's high and low forward as buy-side and sell-side liquidity, and then does what no session tool does: it measures what happens after that liquidity is taken. Every sweep is classified as a reversal or a continuation, recoloured by outcome, and fed into a statistics dashboard that reports, for your exact symbol and timeframe, how often each killzone's liquidity gets swept, how often the sweep reverses, the session's range in ATR terms and its directional bias. It is a context and statistics tool, not a signal system — the session layer of the Smart Money workflow, quantified.
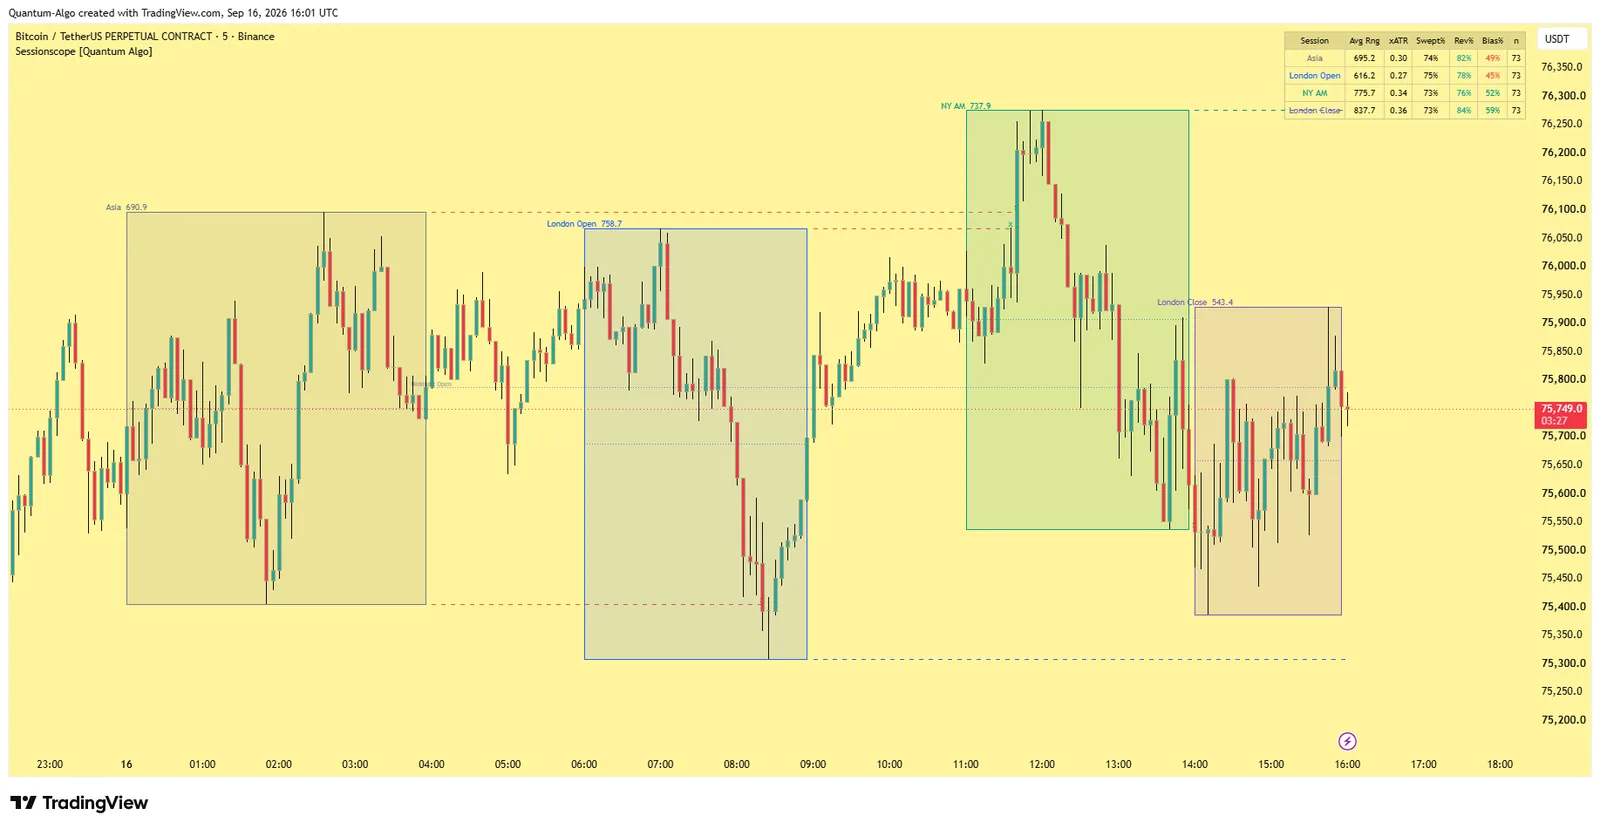
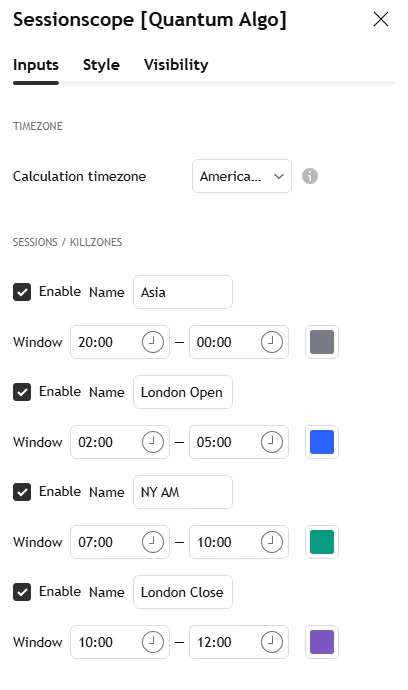
Asia 20–00, London Open 02–05, New York AM 07–10, London Close 10–12 — New York time, DST handled, all editable.
Session highs and lows are liquidity; every sweep of them is classified reversal or continuation and counted.
Swept% (how often the pool is run), Rev% (how often it snaps back), xATR, Bias%, n — per killzone, on your chart.
What it plots
Four killzone range boxes
, each with its high, low and 50% equilibrium level.
Forward-projected session liquidity
Each closed killzone's high as buy-side liquidity (BSL) and its low as sell-side liquidity (SSL), extended until the next instance of that session.
Liquidity sweep marks
, recoloured by outcome — reversal or continuation.
The New York midnight open
(00:00 ET) as a daily reference line.
A statistics dashboard
Summarising each killzone over the full chart history.
The Bitcoin 5-minute screenshot on this page shows the session boxes, projected levels and a recoloured sweep; the settings screenshot shows the Inputs tab.
The four killzones
Default windows in New York time (America/New_York):
| Killzone | Window (ET) | What usually happens |
|---|---|---|
| Asia | 20:00–00:00 | Builds the overnight range whose high and low become the day's first liquidity |
| London Open | 02:00–05:00 | Sweeps the Asian range and sets the day's first real direction |
| New York AM | 07:00–10:00 | The highest-volume window; sweeps London's range or continues it; the US data window |
| London Close | 10:00–12:00 | Profit-taking and reversals of the morning move |
Because the timezone is anchored to America/New_York rather than a fixed UTC offset, the windows follow US daylight saving automatically. All four windows, names and colours are editable — shift them, repurpose one as a New York PM or Silver Bullet window, or set the New York window to 08:30–11:00 for index futures. Our forex market hours and kill zones guides cover why these windows matter.
Session liquidity (BSL / SSL)
While a killzone is open, the box tracks its developing high and low in real time. When it closes, those extremes freeze and project forward as horizontal liquidity levels — the high as buy-side liquidity, the low as sell-side — extended until the next instance of the same session. A sweep is registered when price trades through a projected level (a wick or close beyond the high, or beyond the low); the level can be frozen at the sweep to keep the chart clean.
The sweep outcome engine
Marking a sweep is common; classifying it is the core idea of this tool:
- High sweep → REVERSAL if price closes back below the swept high within a configurable number of bars; otherwise CONTINUATION.
- Low sweep → REVERSAL if price closes back above the swept low within that window; otherwise CONTINUATION.
A reversal is the classic ICT liquidity-grab outcome — the level is run, then rejected. A continuation means the level broke and held — a genuine expansion. Each sweep mark is recoloured to its resolved outcome and feeds the Rev% statistic, which turns the qualitative liquidity-grab premise into a measured, per-session number on your instrument.
The statistics dashboard
For each enabled killzone, accumulated over the entire visible chart history:
| Metric | What it measures | How to read it |
|---|---|---|
| Avg Rng | Average high-to-low range of the session, in price | Which session moves most in absolute terms |
| xATR | That average range as a multiple of the daily ATR(14) | Which session expands most relative to typical daily volatility |
| Swept% | Share of the session's high and low levels taken before it next reopens | How often this killzone's liquidity gets run |
| Rev% | Of those sweeps, how often price reversed back inside the range | When it is run, how often it snaps back |
| Bias% | Share of sessions closing above their open | The session's directional lean |
| n | Completed sessions in the sample | How much to trust the numbers |
Swept% and Rev% answer two distinct questions — how often does this killzone's liquidity get run, and when it does, how often does it reverse — and together they are the reason to run this tool rather than a plain session-box script.
The New York midnight open
The first traded price after 00:00 America/New_York is captured each day and drawn as a horizontal reference — the level many ICT traders use as a daily equilibrium anchor. It is fixed once printed and does not move.
Settings
| Group | Inputs | Where to start |
|---|---|---|
| Timezone | America/New_York (default) | Leave it — DST is handled |
| Sessions / Killzones | Per-session enable, name, window, colour | All four on; adjust NY to 08:30–11:00 for index futures |
| Box & level visuals | Boxes, fills, high/low, equilibrium, labels, history cap | History cap 5–10 sessions |
| Session liquidity & sweeps | Projection, sweep marks, freeze-on-sweep, line style, reversal window, outcome colouring | Reversal window 6–12 bars on 5m; freeze on |
| New York midnight open | Toggle and style | on |
| Statistics dashboard | Position, size | Corner of your choice |
| Alerts | Sweep and session events | — |
How to use it
Apply on an intraday timeframe — 1m to 1h; 5m or 15m for clean session structure.
Mark the higher-timeframe bias first, then use the killzone windows to time entries.
When a killzone level is swept, read the outcome colour and that session's historical Rev% to judge whether a reversal back inside the range is the higher-probability path.
Use xATR to see which session is most active on your instrument, and Bias% for its directional lean.
Pair it with the entry tools: the sweep is the trigger; the Liquidity Sweeps indicator confirms the candle, the Order Blocks or Fair Value Gaps tools give the zone, and the OTE + Silver Bullet indicator gives the graded entry inside the window.
Three session plays
The London sweep of Asia.
The Asian range high or low is projected; London runs it; a reversal outcome with a high Rev% on your symbol is the setup — entry on the reclaim, stop beyond the sweep, target the opposite side of the Asian range.
New York continuation.
When the New York AM window sweeps London's high and the outcome resolves as continuation, the day is trending; trade pullbacks with the trend rather than fading the level.
Midnight-open bias.
Price above the midnight open in the New York window favours longs from discount; below it, shorts from premium — the equilibrium anchor the dashboard's Bias% supports or contradicts.
Recommended settings by market
Forex majors and gold, 5m–15m:
Defaults; the London Open and New York AM killzones carry the highest Swept% on most pairs.
Index futures, 5m:
Set New York to 08:30–11:00 to match the cash open and data window; the Asia box is thin.
Crypto perpetuals, 15m:
All four windows still structure the day around the US session; expect a lower Rev% at the weekend.
How it compares
Against standard session and killzone scripts: those stop at coloured boxes, session highs and lows, midpoints and a range table; Sessionscope adds the outcome layer and the per-session statistics. Against the Liquidity Sweeps indicator: that tool maps every swing as a pool and classifies the sweep candle; Sessionscope maps session pools only and classifies the outcome over the following bars — they are complementary, and we run both. Against Zeno: Zeno's signals are built on the same session liquidity; this free tool is the context and the numbers behind it.
Limitations
Boxes and the live high/low update in real time while the current session is forming — expected real-time behaviour, not lookahead. Once a session closes its levels are fixed; sweeps are detected on price crossing those fixed levels; an outcome, once resolved on a closed bar, does not change. Statistics describe this chart's history only and do not predict future behaviour.
Credits
Killzones, buy-side and sell-side liquidity, liquidity sweeps, the midnight open and premium/discount equilibrium originate with the Inner Circle Trader and the wider Smart Money community. The session detection, liquidity projection, sweep-outcome classification and statistics engine are original code by Quantum Algo, open source under TradingView's house rules.
Step-by-step: adding it to your TradingView chart
Open the script page on TradingView (link above) and click Add to favorites, then Use on chart — or on any chart open Indicators, search "Sessionscope Quantum Algo" and add it. Free on every TradingView plan.
Open the indicator's settings and set the inputs for your market and timeframe from the table above; the defaults are tuned for crypto and gold.
In the Style tab, match the colours to your chart theme; the dashboard position and text size are in Inputs.
To set alerts, right-click the chart → Add alert, choose the indicator as the condition and pick the event; set "Once per bar close" so alerts match the closed-bar logic.
Save the layout, and add the other free Quantum Algo tools to it — they are designed to sit together.
To read or reuse the code, click Source code on the script page; republishing is subject to TradingView's house rules.
Inside the code, for developers
Pine Script, open source. Worth reading if you want to modify it: pivot confirmation with ta.pivothigh / ta.pivotlow and a symmetric lookback (the source of the deliberate lag); state held in capped arrays of drawing objects with explicit create/update/retire functions; every detection and signal gated on barstate.isconfirmed; named alertcondition calls so webhooks receive a consistent payload. The Academy's Pine Script tutorials and the TradingView backtesting guide cover strategy conversion.
Using it with the other free indicators
The free tools layer on one chart: the Smart Money Concepts Engine for bias and the Confluence Score; Order Blocks with Volume, Fair Value Gaps + Inversion and Institutional Key Levels for the zone; Liquidity Sweeps, Sessionscope and Liquidation Magnet for the liquidity and the trigger; OTE + Silver Bullet for the time-qualified entry; the Institutional Volume Profile and Pressure Oscillator for whether volume agrees. The free-indicators hub lists every tool; the SMC guide is the method behind the layering.
Common mistakes with this indicator
- Trusting the developing bar — every event waits for the close.
- Trading every marker — the tool gives context and location; the entry needs structure confirmation and a stop beyond the level.
- Default lengths on the wrong timeframe — adjust the pivot inputs, as the settings table shows.
- Ignoring volume quality — indicative on CFD tick volume, real on exchanges and futures.
- Stacking ten random scripts — the free tools layer because they were built to.
Want the signal, not just the structure?
Zeno reads the same Smart Money structure across timeframes and prints the entry, stop, TP1 and TP2 on your chart — with a public record of 160 posted trades, 120 wins and 40 losses at the stated levels. QuantumBot executes it on Bybit, Binance, OKX, Bitget and Kraken.

Glossary for this indicator
Frequently asked questions
Does Sessionscope repaint?
No lookahead is used anywhere. The forming session's box updates live, which is expected; closed sessions, projected levels and resolved sweep outcomes are fixed.
What are the ICT killzone times?
Asia 20:00–00:00, London Open 02:00–05:00, New York AM 07:00–10:00, London Close 10:00–12:00, all New York time. The indicator ships with these and lets you edit every window.
What is the difference between Swept% and Rev%?
Swept% is how often a session's high or low gets taken before the session next opens; Rev% is, of those sweeps, how often price closed back inside the range within the reversal window. High Swept% with high Rev% is the profile of a killzone worth fading.
Can I add a Silver Bullet window?
Yes — repurpose one of the four editable windows, or run Sessionscope alongside the OTE + Silver Bullet indicator, which shades the three Silver Bullet hours and grades entries inside them.
Does it work on stocks?
The session logic works on anything with a session; the default windows are forex and crypto oriented. For US stocks, set one window to the cash open (09:30–11:00 ET) and one to the close.
How does it relate to Zeno?
Zeno's signals fire on sweeps of exactly these session pools; Sessionscope is the free context tool that shows the pools, the outcomes and the statistics behind them.
Which timeframe should I use?
1-minute to 1-hour; 5-minute or 15-minute for the cleanest session structure. The statistics accumulate over the full chart history regardless of what is drawn.
Can I change the killzone times?
Yes — every window, name and colour is editable. Set New York to 08:30–11:00 for index futures, or repurpose a window as a Silver Bullet hour.
What does xATR tell me?
The session's average range as a multiple of the daily ATR(14) — which killzone expands most relative to typical daily volatility on your instrument.
Why is the current session box moving?
The forming session tracks its developing high and low in real time, which is expected; once it closes the levels are fixed and only then can they be swept.
How large a sample do I need?
Read n on the dashboard; below roughly 30 completed sessions the Swept% and Rev% are indicative. On a 5-minute chart that is a few months of history.
How does it relate to Zeno?
Zeno's signals fire on sweeps of exactly these session pools; Sessionscope is the free context tool showing the pools, the outcomes and the statistics behind them.
The other free Smart Money indicators
Built to layer on one chart: the engine for bias and the score, the dedicated tools for each element.
Add Sessionscope to your chart
One click on TradingView, free on every plan, code you can read. Nothing repaints.