ICT Volume Imbalance: The Gap Between Candle Bodies, and How to Trade It
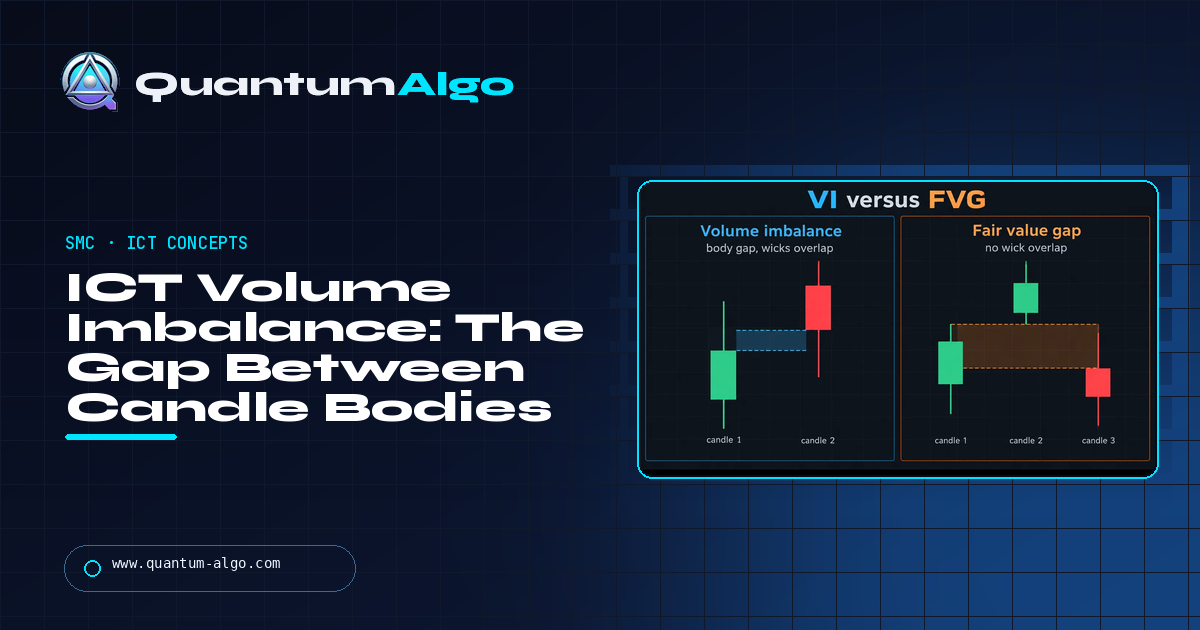
An ICT volume imbalance (VI) is a gap between the bodies of two consecutive candles — the first candle's close and the second candle's open leave a space no body printed in, even though the wicks overlap it. It is the two-candle, body-level cousin of the fair value gap, which is a three-candle gap the wicks never covered. Price tends to return and fill a VI; the working entry is its midpoint, used to refine an entry inside a displacement leg — between the fair value gap above and the order block below — never as a setup on its own. No volume data is involved despite the name.
For a year I drew fair value gaps and wondered why price so often reversed two points short of my limit. The answer was a smaller gap I was not marking: the body gap between the two candles that made the displacement, which price filled and respected before it ever reached the FVG. This page is the definition, the difference from an FVG and a liquidity void, how to mark a VI in six steps, where it sits in the PD array stack, the entry at the midpoint, a NAS100 Silver Bullet trade worked to the quarter-point, and where the whole idea stops working. The calculator checks two candles and sizes the gap against ATR.
Indicators that prove themselves in public.
One engine, four precision tools — the Gold (XAU) Scalper, the institutional Gravity Zone, the Zeno momentum Oscillator, and Zeno Stocks for equities.



What a volume imbalance is
A volume imbalance — VI in ICT's vocabulary — is a gap between the bodies of two consecutive candles. Candle 1 closes at 18,604.25; candle 2 opens at 18,609.75. Between those two prices no candle body printed, even though the wicks may have covered the range. That body gap is the imbalance: the market moved from one close to the next open without trading efficiently through the space between, and ICT's claim, which holds up well enough on liquid instruments to be worth trading, is that price tends to return to such spaces and fill them.
It is the smaller cousin of the fair value gap. An FVG is a three-candle pattern where the wick of candle 1 and the wick of candle 3 never overlap — a range no price traded through at all. A VI is a two-candle pattern where the bodies do not overlap but the wicks do — price did trade there, briefly, but no candle opened or closed there. The FVG is a gap in price; the VI is a gap in delivery. Both are inefficiencies; the FVG is the stronger claim and the VI is far more common.
What a VI is not: it is not a volume indicator, despite the name — no volume data is involved, and you can mark one on a chart with volume turned off. It is not a gap in the exchange-gap sense either; on a 24-hour market like BTCUSDT or a continuous futures session, a VI happens inside normal trading whenever a candle opens away from the prior close because the first trade of the new bar printed a few ticks away.
Volume imbalance versus fair value gap
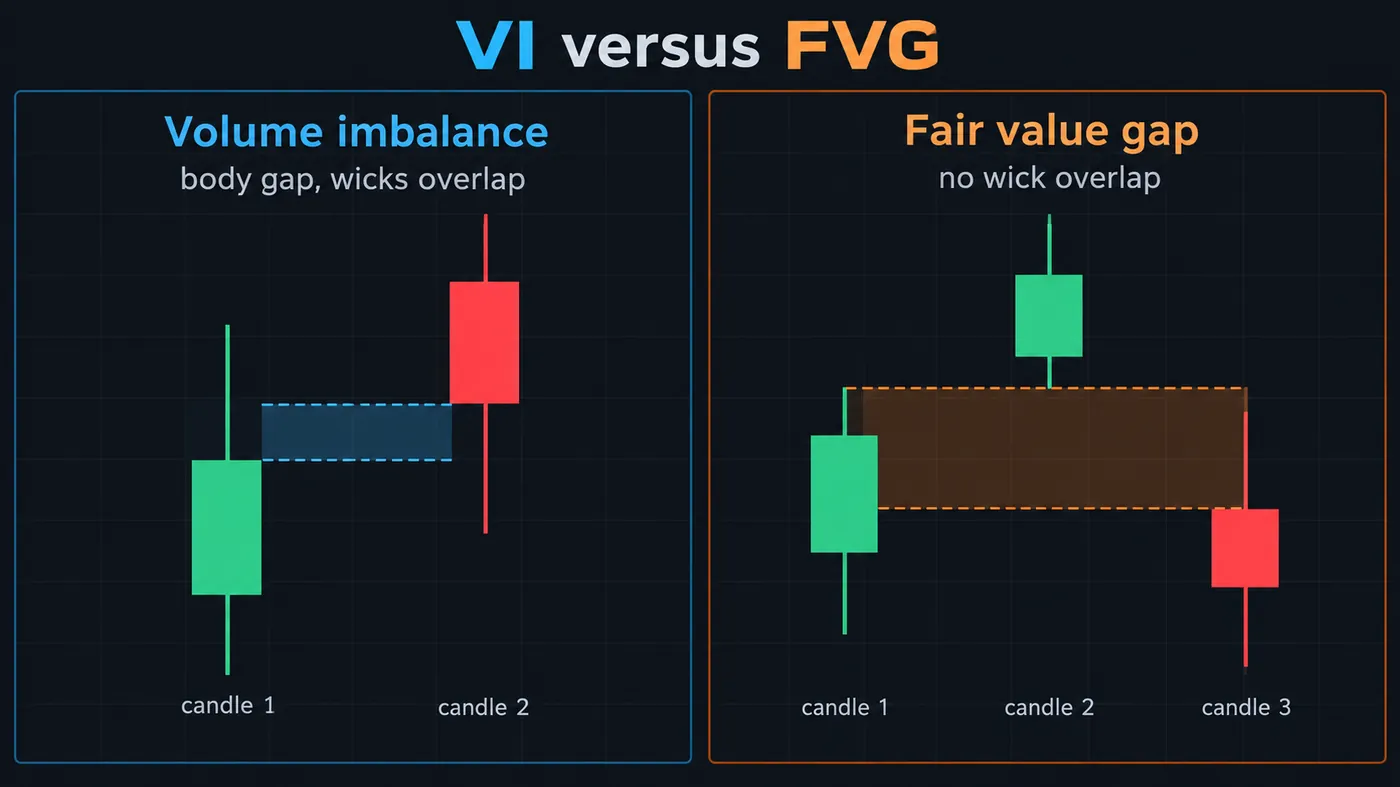
| Volume imbalance (VI) | Fair value gap (FVG) | Liquidity void | |
|---|---|---|---|
| Candles | Two consecutive | Three consecutive | Many — a whole leg |
| Definition | Gap between the bodies; wicks overlap | Gap between candle 1's wick and candle 3's wick; no overlap | A displacement leg with several FVGs and VIs stacked |
| What is missing | Opens and closes in the range — delivery | Any trade in the range — price | Efficient two-way trade across the whole leg |
| Strength as a zone | Weak on its own; strong inside a displacement leg | Moderate to strong | Strong, but the fill can take days |
| Working entry | The midpoint (consequent encroachment) | The midpoint, or the near edge in strong trends | The FVGs inside it, one at a time |
| Expected fill | Usually full on the next pullback | Often partial — to the midpoint | Partial; the leg is rarely fully retraced |
The relationship between the three is nesting. A displacement leg contains a liquidity void; inside the void are one or two FVGs; between the candles that made those FVGs are VIs. When price returns into the leg it meets the VIs first, because they are the finest-grained inefficiencies, and often reacts at one before it reaches the FVG everyone drew. That is the practical reason to mark them.
How to mark one
- Find two consecutive candles whose bodies do not overlap. The close of the first and the open of the second leave a space. Ignore the wicks for this step.
- Check the wicks. If the wicks of the two candles overlap across the space, it is a VI. If a third candle is involved and no wicks cover the space at all, you are looking at an FVG — use the FVG rules instead.
- Draw the box from close to open. Bullish VI: from candle 1's close up to candle 2's open. Bearish VI: from candle 1's close down to candle 2's open. Extend it right.
- Mark the midpoint. The consequent encroachment. On a VI this is the level that matters; the edges are noise.
- Note the context. Is the VI inside a displacement leg, after a liquidity sweep, in the direction of the higher-timeframe bias? A VI in the middle of a range is a level price will fill and ignore. A VI in a fresh displacement leg is a level price will fill and react at.
- Delete it when it is filled. Once a candle body closes through the far edge, the inefficiency is resolved. Keep the chart clean; VIs are everywhere.

Automate your trades. Let Quantum Algo trade for you.
Every signal executed on your own account — on your account, with the plan you define.
How to trade a volume imbalance
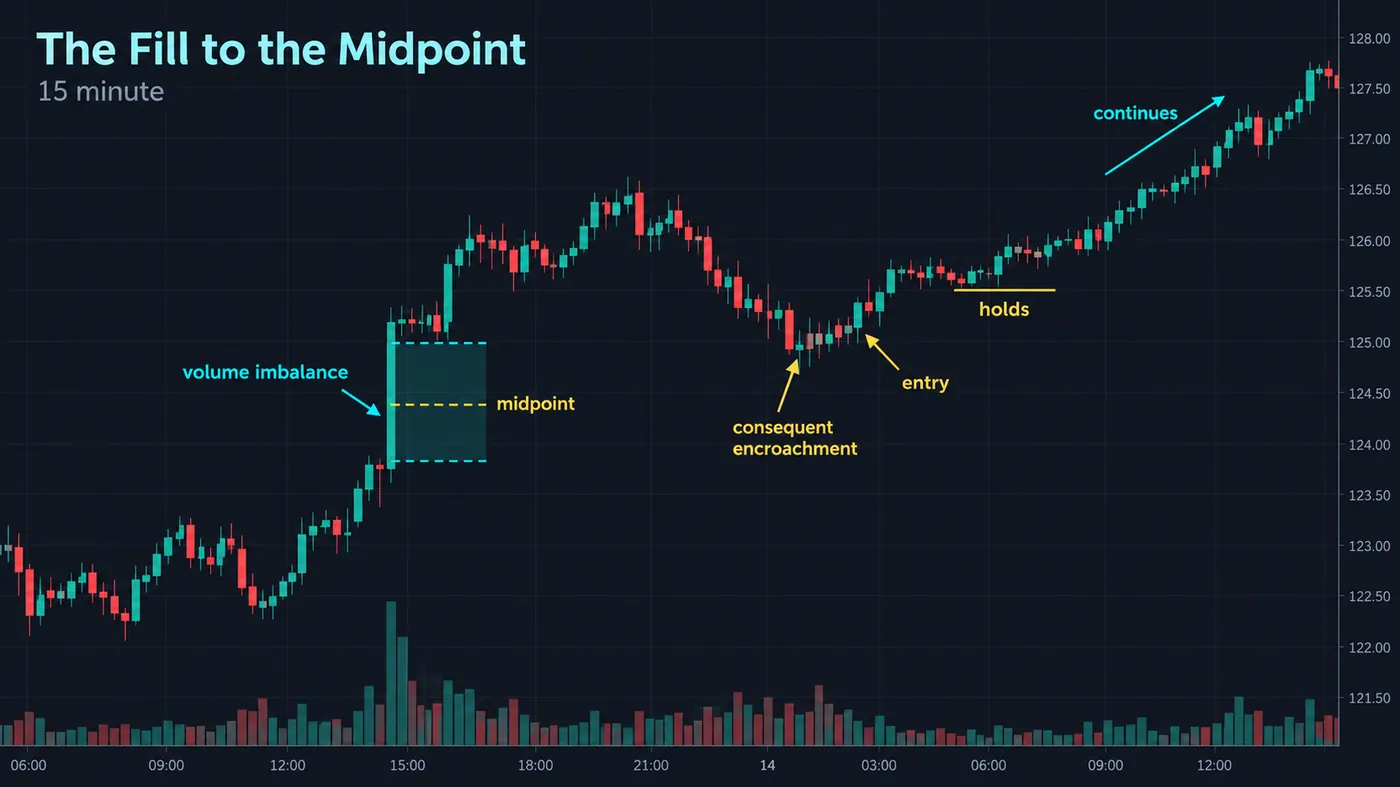
On its own, almost never. A VI is a refinement inside a trade you already have, not a reason for one. The setup is a displacement leg — a fast move that follows a liquidity sweep or a structure shift — and the question is where inside that leg to enter on the pullback. The order block at the origin is the deepest entry; the FVG in the leg is the standard one; the VI just above the order block or just below the FVG is the one that often fills first and holds.
The entry is a limit at the midpoint of the VI, or a lower-timeframe confirmation when price touches it — a 1-minute close back in the direction of the leg. The stop goes beyond the far edge of the gap, or beyond the order block below it if the VI is sitting on one. Targets are the same as for the leg: the liquidity that the displacement was pointing at.
The refinement is worth having because it is small. A VI is typically 10 to 30% of the ATR, so entering at its midpoint rather than at the FVG midpoint a few points further back tightens the stop and improves the R multiple on a trade you were taking anyway. It costs nothing but the fills where price does not come back that far — and on those, the FVG entry still catches the move.
Volume imbalance calculator
Enter the two candles and the ATR. The tool says whether the bodies actually gap, whether the wicks overlap (VI) or not (FVG), sizes the gap against ATR, and gives the midpoint to work from.
The VI in the PD array stack
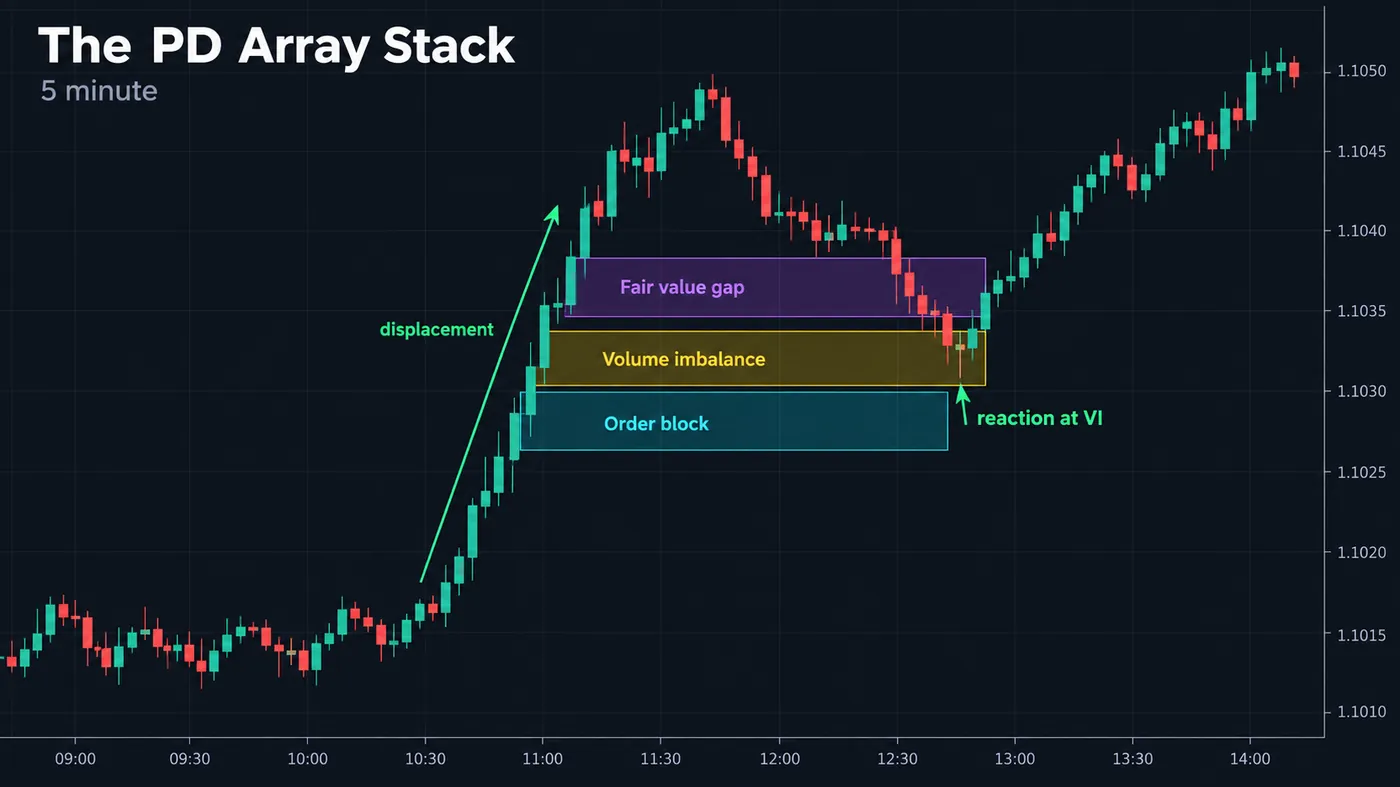
ICT calls the set of levels in a displacement leg the PD array: order block, breaker, mitigation block, fair value gap, volume imbalance, liquidity void, and the others. They are ordered by depth. On a return into a bullish leg the sequence from the top is: the FVG (shallowest), any VIs between the candles that formed it, and the order block at the origin (deepest). The VI is the middle of the stack and the reason to watch it is precisely that it is not where most traders are looking — a limit at the FVG midpoint misses the reaction at the VI two points below it, and a limit at the order block is too deep on the days the VI holds.
The practical rule I use: mark the VI, place the limit at its midpoint, and put the stop under the order block. If price reaches the VI and holds, the trade has the stop distance of an order-block trade with the entry of an FVG trade. If price runs through the VI to the order block, the stop is still where it should be and the fill is deeper than planned, which is fine.
Reference data
| Item | Value |
|---|---|
| Definition | A gap between the bodies of two consecutive candles, with wicks that overlap |
| Bullish VI | Candle 2 opens above candle 1's close |
| Bearish VI | Candle 2 opens below candle 1's close |
| Box | From candle 1's close to candle 2's open |
| Key level | The midpoint — consequent encroachment |
| Distinguishing from an FVG | FVG = three candles, no wick overlap; VI = two candles, bodies gap, wicks overlap |
| Typical size | 10–30% of ATR on the timeframe; larger inside a displacement leg |
| Where it matters | Inside a displacement leg after a sweep or structure shift, in the direction of the HTF bias |
| Where it does not | Mid-range, on noisy low-volume candles, on daily charts of 24-hour markets where opens equal prior closes |
| Stack position | Between the FVG (shallow) and the order block (deep) in a PD array |
| Resolved when | A candle body closes through the far edge |
Worked example: NAS100 5-minute, a VI inside the Silver Bullet
NAS100, the 10:00–11:00 window. At 10:05 the 09:50 macro finished running the opening-range low at 18,571 and the 10:05 candle displaced up: open 18,584.50, close 18,604.25, high 18,611.50. The 10:10 candle opened at 18,609.75 — five and a half points above the prior close — and printed a low of 18,606.00 before closing higher. Bodies: 18,604.25 to 18,609.75, a gap. Wicks: the 10:05 high of 18,611.50 overlaps the 10:10 low of 18,606.00. A bullish VI from 18,604.25 to 18,609.75, midpoint 18,607.00, 25% of a 22-point ATR. Those are the calculator's default numbers.
Above it, the 10:05 to 10:15 candles left an FVG from 18,611.50 to 18,616.25; below it, the 10:00 candle was the order block, 18,578.00 to 18,584.50. Three levels in one leg, stacked exactly as described. The limit went at the VI midpoint, 18,607.00, with the stop under the order block at 18,577.50, 29.5 points of risk. Target the buy-side above the 09:45 high at 18,644, thirty-seven points, 1.25R — modest, which is what a Silver Bullet trade usually is.
Price pulled back at 10:25, traded 18,606.25 — three-quarters of a point through the midpoint, well short of the FVG-only trader's fill at 18,613.90 and nowhere near the order block — and the 10:30 candle closed at 18,615. The target filled at 10:52, two minutes into the next macro, for 1.25R. The FVG trader who waited for the midpoint of the gap above did not get filled at all. The VI was the difference between a trade and a missed one.
Where volume imbalances fail
Mid-range. In a ranging market VIs print on every other candle and mean nothing. Price fills them because it is going through everything anyway. Without a displacement leg there is no reason to expect a reaction at one.
Noise on low timeframes. On a 1-minute chart of a thin instrument, opens away from prior closes are the spread and the tick size, not an inefficiency. Use VIs on 5-minute and above for indices and futures, 15-minute and above for crypto.
Daily charts of 24-hour markets. On BTCUSDT or EURUSD the daily open is the prior daily close by construction; there are no daily VIs. They exist on stock daily charts (the open is a real auction) and on intraday charts everywhere.
Over-marking. A chart with forty VI boxes is a chart with no information. Mark the ones inside the current displacement leg and delete the rest.
Treating it as a trade. A VI with no sweep before it, no structure shift, no HTF bias behind it is a box on a chart. Price will fill it and keep going, in whichever direction it was going.
Mistakes traders make with volume imbalances
- Confusing a VI with an FVG. Two candles, bodies gap, wicks overlap — VI. Three candles, wicks do not overlap — FVG. Different zone, different expectations.
- Entering at the edge instead of the midpoint. The consequent encroachment is the level; the edges are where the fill is either too early or too late.
- Putting the stop at the far edge of a small VI. On a 5-point gap that is a 5-point stop, which will be hit by noise. Put it under the order block or beyond the leg's origin.
- Reading the name literally. No volume is involved. It is a body gap.
- Trading VIs in ranges. Without displacement there is no reason for price to respect one.
- Leaving filled VIs on the chart. Once a body closes through, it is done.
Volume imbalances and the free indicators
The Fair Value Gaps + Inversion script draws the three-candle FVGs and tracks their inversion; VIs are two-candle body gaps, which it does not draw, and marking them by hand inside the current leg takes about a minute. The Order Blocks with Volume script gives you the origin of the leg, which is where the stop goes. The Optimal Trade Entry + Silver Bullet script frames the windows this example was traded in. The premium engine, Zeno, prints signals with a stop and targets; the VI is how I refine the entry on a Zeno signal by a few points, not something it draws.
A VI is a body gap: close of one candle, open of the next, wicks overlapping. It sits between the FVG and the order block in a displacement leg and price often reacts there first. Mark it, place the limit at the midpoint, put the stop under the order block, and only inside a leg that followed a sweep or a shift. In a range it is a box; in a leg it is the entry you would otherwise have missed by two points.
◆ Interactive check
VI or FVG?
Questions traders ask about ICT volume imbalances
A gap between the bodies of two consecutive candles: the first closes at one price and the second opens at a different one, so no candle body printed in between, even though the wicks overlap that space. ICT treats it as an inefficiency that price tends to return to and fill.
A fair value gap is a three-candle pattern where the wick of candle 1 and the wick of candle 3 never overlap — a range no price traded through. A volume imbalance is a two-candle pattern where the bodies do not overlap but the wicks do — price traded there but no candle opened or closed there. The FVG is a gap in price; the VI is a gap in delivery.
No. The name is ICT's, and it refers to an imbalance in how price was delivered, not to volume data. You can mark a VI on a chart with the volume histogram turned off.
As a refinement inside a displacement leg, not as a setup. Find the leg that followed a sweep or a structure shift, mark the VI between the candles that made it, place a limit at the VI's midpoint, put the stop under the order block at the origin of the leg, and target the liquidity the leg was pointing at.
In a bullish leg, from the top: the fair value gap (shallowest), the volume imbalances between the candles that formed the leg, and the order block at the origin (deepest). Price returning into the leg meets the VI before the order block and often reacts there.
Usually fully, on the next pullback, because they are small — typically 10 to 30% of the ATR. That is why the midpoint is the entry rather than the edges: the fill to the midpoint is the norm and the reaction, if there is one, happens there.
On intraday charts, yes; BTCUSDT and ETHUSDT 5-minute and 15-minute charts print VIs in every displacement leg. On daily charts they do not exist, because a 24-hour market's daily open is the prior daily close by construction.
A whole displacement leg with several FVGs and VIs stacked inside it — a range price moved through so fast that it left inefficiencies all the way up. Price tends to fill it in pieces, one FVG or VI at a time, rather than all at once.
No. Mark the ones inside the current displacement leg, in the direction of the higher-timeframe bias, and delete each one when a candle body closes through its far edge. A chart covered in VI boxes carries no information.
The Fair Value Gaps + Inversion script draws three-candle FVGs; VIs are two-candle body gaps and are quick to mark by hand inside the current leg. Order Blocks with Volume gives you the origin for the stop. Zeno, the premium engine, prints signals with stops and targets; the VI is a way to refine the entry on those by a few points.
References & Related Guides
Read next
- Fair Value Gaps: Complete Guide
- Displacement Trading
- Order Blocks: Complete Guide
- ICT Silver Bullet Strategy
- ICT 2022 Model
- ICT Macros
- Consequent Encroachment — glossary
- Liquidity Void — glossary
- PD Array — glossary
- Imbalance — glossary
- Fair Value Gaps + Inversion (free indicator)
- Zeno — the premium engine