ABCD Pattern: The Simplest Harmonic, Measured Properly
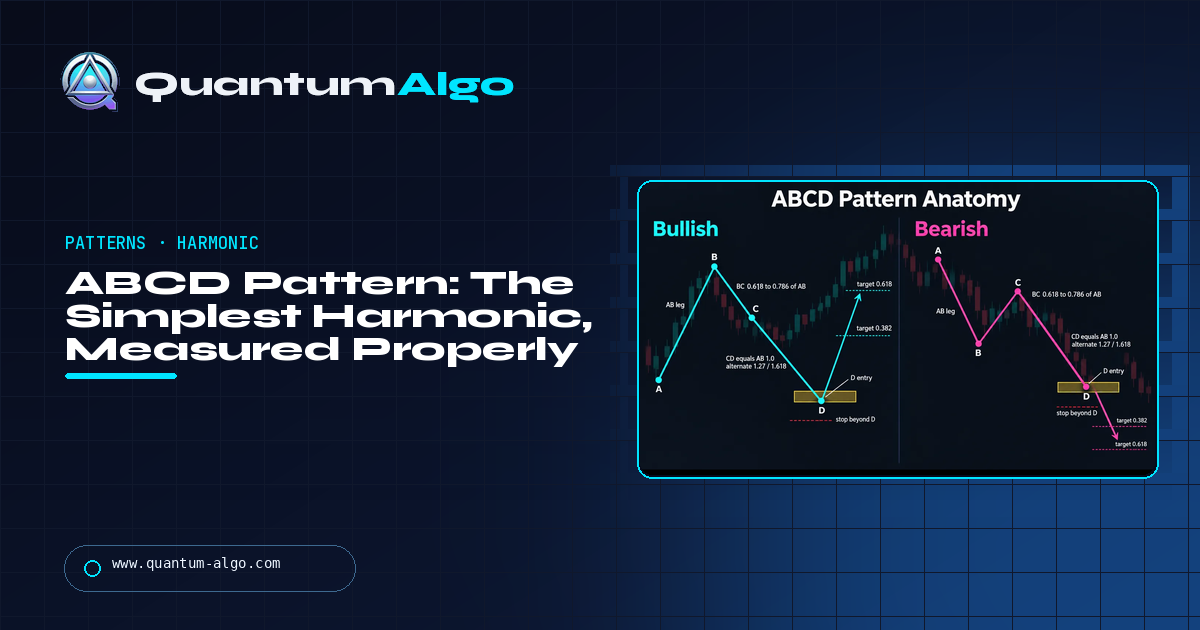
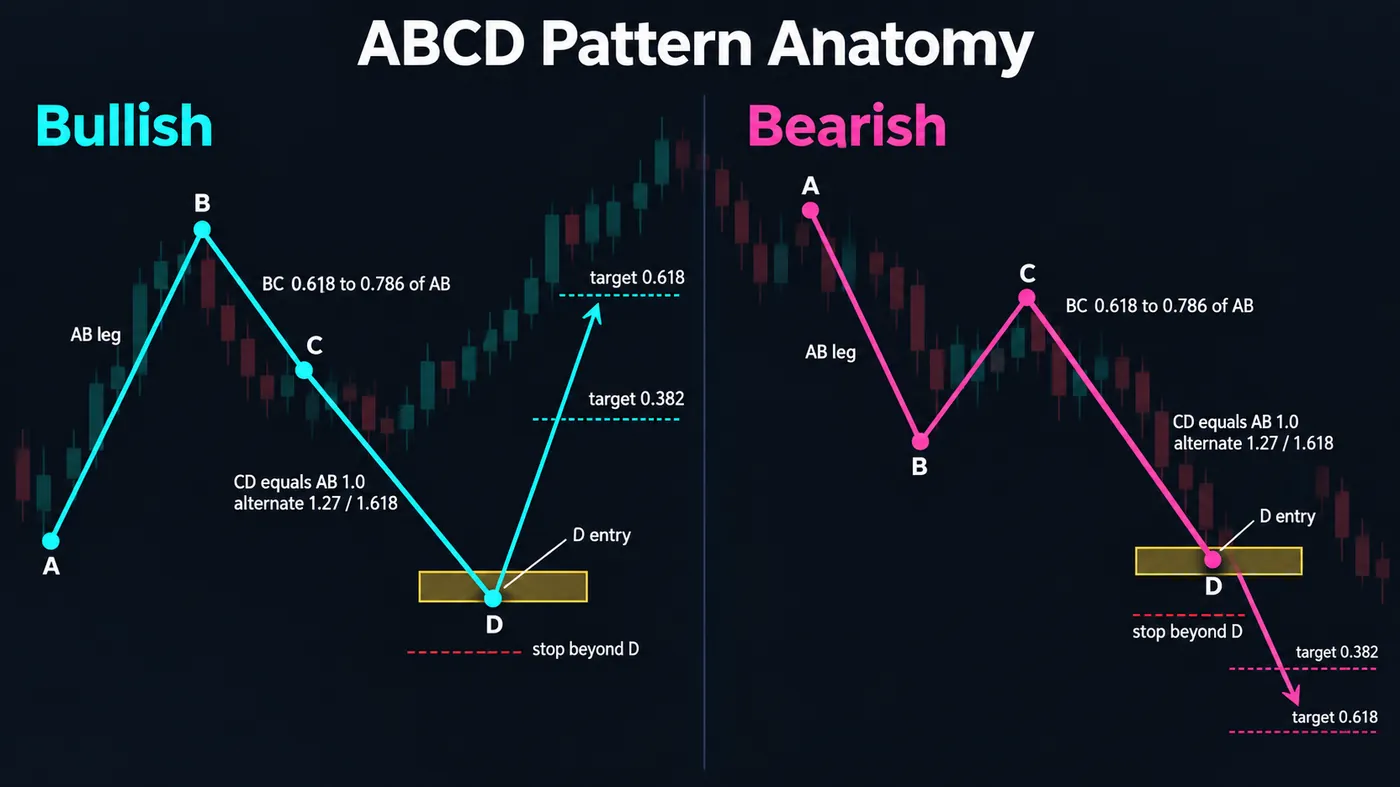
The ABCD pattern is a three-leg structure where the third leg repeats the first: price moves from A to B, retraces 0.618–0.786 of that move to C, then moves from C to D by the same distance as AB (or 1.27 or 1.618 of it when the second leg is faster). D is the completion and the entry level — buy at a bullish D, sell at a bearish D — with the stop a tenth of AB beyond D and targets at the 0.382 and 0.618 retracements of the whole AD move. It is a measured move with Fibonacci tolerances, the building block of every larger harmonic, and it gives you the level; the reaction at that level gives you the trade.
The ABCD was the first pattern I could draw on a chart before the move finished, which is exactly why it was also the first I lost money on: I put limit orders at D and watched half of them fill on the way through. This page is the three legs and the two ratios, the time symmetry that most guides skip, the entry at D with a reaction rather than a resting order, a EURUSD 4-hour completion into a daily order block worked to the pip, and the relationship to the Gartley, the measured move and Elliott corrections. The calculator projects D and the targets from three points and reads the timing.
Indicators that prove themselves in public.
One engine, four precision tools — the Gold (XAU) Scalper, the institutional Gravity Zone, the Zeno momentum Oscillator, and Zeno Stocks for equities.



What the ABCD pattern is
The ABCD is the simplest harmonic pattern: three legs where the third repeats the first. Price moves from A to B, retraces part of that move to C, then moves from C to D by the same distance as AB — in the same direction as AB — and D is where the pattern completes and the trade goes on. A bullish ABCD is a drop, a bounce, and a second drop that ends at D, where you buy; the bearish version is the mirror. The name is sometimes written AB=CD, which states the whole idea.
It comes from H.M. Gartley's Profits in the Stock Market (1935), where it appears as one of the building blocks of his larger patterns, and it was formalised with Fibonacci ratios by Larry Pesavento and then Scott Carney: BC retraces 0.618 to 0.786 of AB, and CD is 1.0 times AB, or 1.27 or 1.618 when momentum is stronger in the second leg. Every larger harmonic — the Gartley, the Bat, the Butterfly — contains an ABCD inside it, which is why learning this one first makes the rest legible.
What it is not: a prediction that D will hold. It is a measured move — a way of projecting where a second leg of a correction is likely to end so that you can be at the level with a plan before price gets there. Many ABCDs complete and go straight through D. The pattern gives you the level; whether the level holds is answered by what happens at it, and the honest version of the trade waits for that answer.
The three legs and the ratios
| Leg | What it is | Ratio | What it tells you |
|---|---|---|---|
| AB | The initial impulse — a drop (bullish pattern) or a rally (bearish) | The reference; 1.0 by definition | The size and speed of the move CD will be measured against |
| BC | The retracement of AB | 0.618 to 0.786 of AB | Shallower than 0.618 and CD tends to extend; deeper than 0.786 and C is nearly a double top or bottom and D tends to fall short |
| CD | The second impulse, in the direction of AB | 1.0 × AB (classic); 1.27 or 1.618 × AB (alternate) | Equal to AB in price and, ideally, in time. Faster than AB usually means the 1.27 or 1.618 extension |
| D | The completion point | Where CD reaches its projection | The entry level. Stronger when it coincides with an order block, a prior swing, or a fair value gap |
The ratios are a window, not a rule. Pesavento's tolerance was a few percent either side; in practice the useful test is whether BC sat somewhere between the 0.618 and 0.786 and whether CD arrived at roughly 1.0 in roughly the same number of bars as AB. When both hold, the completion zone is tight enough to trade with a small stop. When CD is racing — half the bars of AB — the 1.27 and 1.618 extensions are the levels to project instead of 1.0.
Time and price symmetry
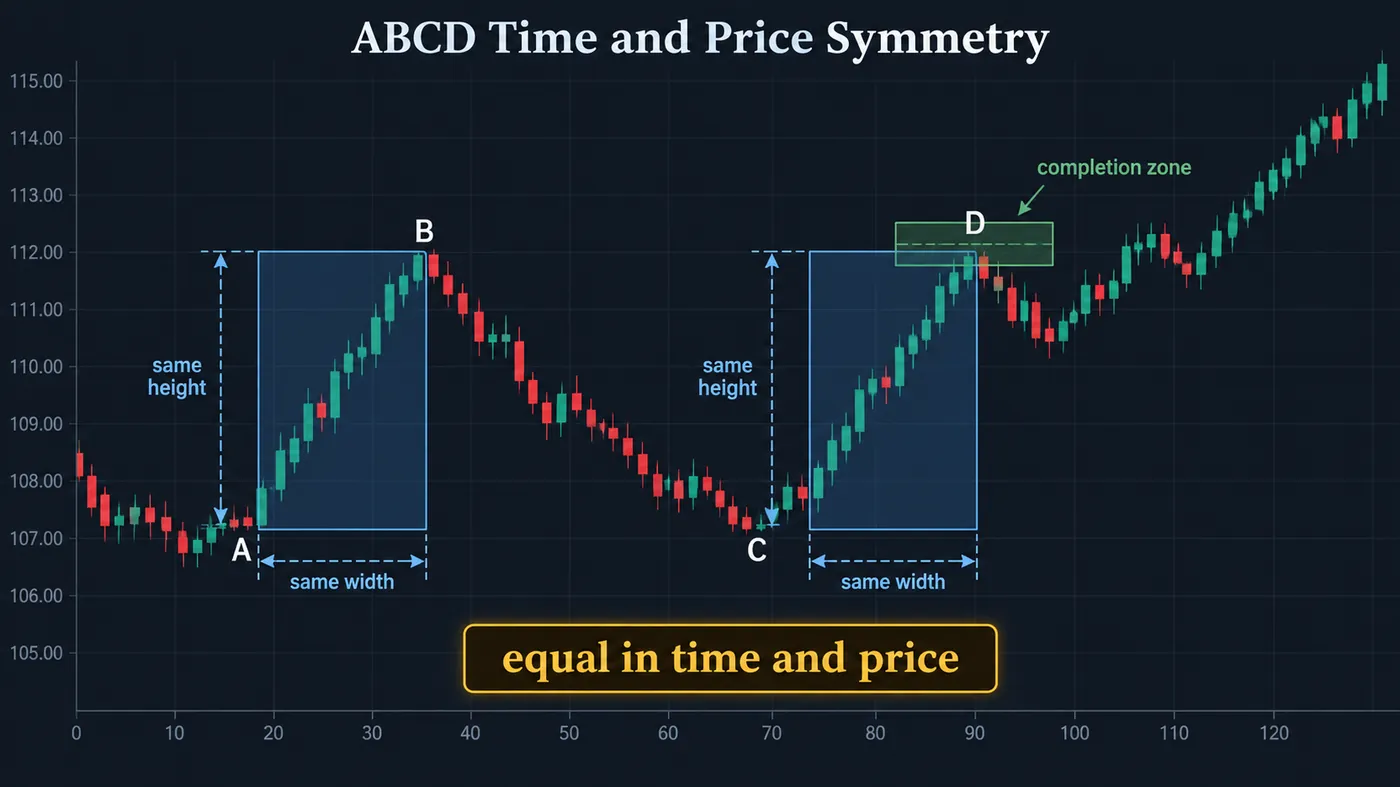
The part most descriptions leave out is time. Gartley's original observation was that the two impulse legs tend to match in duration as well as distance: if AB took nine bars, CD tends to take about nine. When CD reaches the 1.0 projection in the same number of bars, the pattern is symmetric and D is a strong level. When CD reaches the price in half the bars, momentum in the second leg is stronger than in the first and the move usually extends to 1.27 or 1.618 before stopping — the price target was right, the timing said it was not done. When CD dawdles past twice AB's bar count, the structure is losing shape and the pattern is weaker.
The practical use: count the bars of AB when B prints, and watch the bar count as CD develops. A CD leg arriving early is a reason to project the alternates; one arriving on time is a reason to trust the 1.0 level. The calculator below takes both counts.

Automate your trades. Let Quantum Algo trade for you.
Every signal executed on your own account — on your account, with the plan you define.
How to trade it
- Identify AB and wait for C. A clean impulse leg, then a retracement that stalls between 0.618 and 0.786. Until C is in, there is no projection.
- Project D. C plus AB (bullish: C minus AB) for the classic completion; C plus 1.27 × AB and 1.618 × AB for the alternates. Note how many bars AB took.
- Look for what sits at D. A projection that lands on an order block, a prior swing, a fair value gap or a session level is a completion with a reason. A projection into empty space is a number.
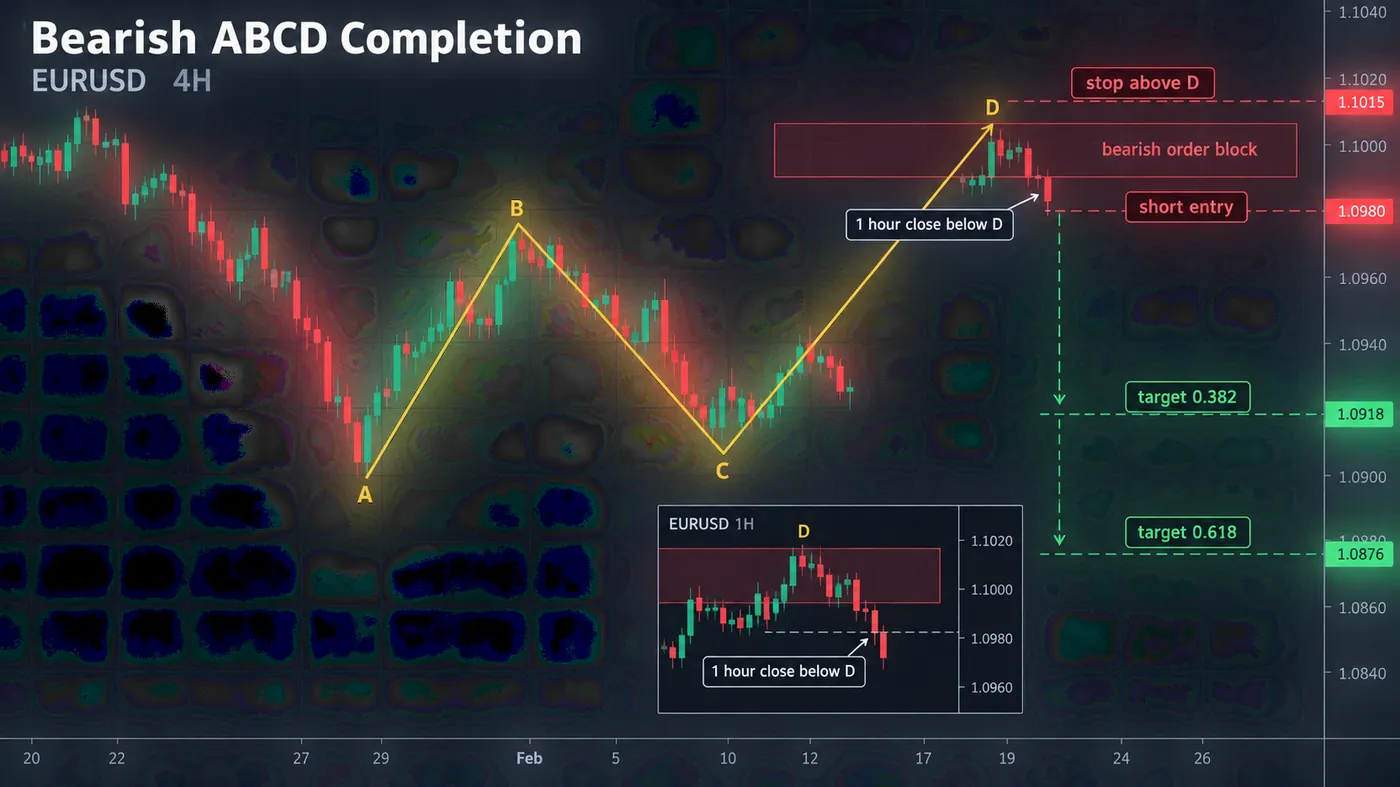
- Wait for the arrival and the reaction. Do not place a limit at D and walk away — many ABCDs go straight through. Wait for price to reach the zone and print a lower-timeframe reversal: a 1-hour close back through D on a 4-hour pattern, a swing failure at the level, or a structure shift.
- Stop beyond D. About a tenth of AB beyond the completion, or beyond the alternate projection if CD arrived fast. If price trades through the 1.618 extension, the pattern has failed and the move is a trend.
- Targets at 0.382 and 0.618 of AD. The retracement of the whole A-to-D move. First partial at 0.382, second at 0.618; the origin at A is the stretch target and is reached less often than the diagrams suggest.
ABCD calculator
Enter A, B and C and the direction. The tool checks the BC ratio against the 0.618–0.786 window, projects D at 1.0, 1.27 and 1.618, sets the stop a tenth of AB beyond D, computes the 0.382 and 0.618 targets with their R multiples, and — if you give the bar counts — says whether CD's timing argues for the classic level or the extensions.
ABCD versus the larger harmonics and the measured move
| Pattern | Points | Defining ratios | Relationship to ABCD |
|---|---|---|---|
| ABCD | A B C D | BC 0.618–0.786; CD = AB (or 1.27 / 1.618) | — |
| Gartley | X A B C D | B at 0.618 of XA; D at 0.786 of XA | An ABCD inside an XA leg; D also a 0.786 retracement of XA |
| Bat | X A B C D | B at 0.382–0.5 of XA; D at 0.886 of XA | ABCD with a deeper completion |
| Butterfly | X A B C D | B at 0.786 of XA; D at 1.27–1.618 of XA | ABCD whose D extends beyond X |
| Measured move | Three legs | Second leg equals the first | The ABCD without the BC ratio requirement; the classical-charting version |
| Elliott flat / zigzag | A B C | C often equals A | Elliott's corrective waves are ABCDs described in a different vocabulary |
The lineage matters because it explains why the ABCD works when it works: it is the same observation — corrections tend to unfold in two equal legs — that Gartley, Elliott and the classical measured-move traders all made independently. The Fibonacci window on BC is a refinement, not the source of the edge.
Reference data
| Item | Value |
|---|---|
| Points | A, B, C, D — three legs |
| BC retracement | 0.618 to 0.786 of AB |
| CD projection | 1.0 × AB (classic), 1.27 or 1.618 × AB (alternate, when CD is fast) |
| Time symmetry | CD bar count ≈ AB bar count for the classic completion |
| Entry | At D, on a lower-timeframe close back through the level |
| Stop | ~0.1 × AB beyond D, or beyond the alternate projection |
| Targets | 0.382 and 0.618 retracements of AD; A as the stretch |
| Strengthened by | D coinciding with an order block, prior swing, FVG or session level |
| Origin | H.M. Gartley (1935); ratios by Larry Pesavento; formalised by Scott Carney |
| Contained in | Gartley, Bat, Butterfly, Crab; equivalent to the measured move and Elliott corrective waves |
| Timeframes | Any; 4H patterns with 1H triggers and daily with 4H triggers are the usual pairs |
Worked example: EURUSD 4-hour, a bearish ABCD into an order block
EURUSD, 4-hour chart, in a daily downtrend. Point A was a low at 1.0778 after the London open on a Monday; the rally to B at 1.0912 took nine 4-hour bars — 134 pips. C came at 1.0812, a retracement of 74.6% of AB, inside the window. Projection: C plus 134 pips = 1.0946 for the classic completion; 1.0982 and 1.1029 for the 1.27 and 1.618 alternates. A bearish order block from the daily chart sat at 1.0938–1.0958. The 1.0 projection landed inside it.
CD took eight bars — close to AB's nine — and printed a high of 1.0951 on the Thursday, five pips into the block. The 1-hour chart put in a swing failure: a wick to 1.0951 and a close at 1.0929 below the completion level. Short at 1.0929, stop at 1.0965 (thirteen pips above D, a tenth of AB), thirty-six pips of risk. AD was 173 pips; target 1 at 0.382 of that, 1.0885 (44 pips, 1.2R); target 2 at 0.618, 1.0844 (85 pips, 2.4R).
Target 1 filled on the Friday morning, target 2 the following Tuesday. Price then bounced from 1.0838 and did not reach A. Blended 1.8R across the two exits. The pattern supplied the level to the pip; the order block supplied the reason to believe it; the 1-hour close supplied the entry; and the 0.618 target, not A, supplied the exit. Traders who held for A gave back most of the second partial.
The alternate outcome on the same setup: had CD arrived in four bars instead of eight and driven through 1.0951 without a reversal close, the 1.27 projection at 1.0982 was the next level — and the daily block's upper edge at 1.0958 having failed would have been the signal that the 1.0 level was not the one.
Where the ABCD fails
Trends. In a strong trend the "correction" that looks like AB is the trend, C is a shallow pullback, and CD runs to 1.618 and beyond. An ABCD against the higher-timeframe direction completes and continues. Take them with the daily, or take only the partials.
Limit orders at D. The single biggest source of losses. A pattern projected to the pip and traded with a resting order at that pip gets filled on the ones that go through. Wait for the reaction.
Loose ratios. A BC at 0.5 or 0.886 is not "close enough" — those are different patterns (Bat territory, double-top territory) with different completion behaviour. If the ratios do not fit, do not force the label.
Empty D. A projection into a price with nothing else at it is a measured move and nothing more. The completions that hold are the ones that land on structure.
Low timeframes and thin markets. On a 1-minute altcoin chart every three-bar wiggle is an ABCD. Use 15-minute and above on liquid instruments; 4-hour and daily is where the pattern earns its keep.
Mistakes traders make with the ABCD
- Entering at D without a reaction. The level is where you watch, not where you click.
- Projecting D before C is confirmed. C has to stall in the window first; a moving C moves D.
- Ignoring time. CD arriving in half of AB's bars is a momentum leg — project the extensions.
- Targeting A every time. The 0.382 and 0.618 of AD are the targets; A is the exception.
- Trading every fit. The pattern completes everywhere; the ones at order blocks and prior swings are the ones that pay.
- Fading the daily trend with a 15-minute ABCD. The pattern is a correction structure; a correction against a trend ends when the trend resumes.
The ABCD and the free indicators
The library does not draw harmonic patterns — the ratios are a ten-second job with the Fibonacci tool, and the value is in what sits at D. The Order Blocks with Volume script shows whether the projection lands on a defended level, the Fair Value Gaps + Inversion script whether it lands in a gap, and the Liquidity Sweeps script marks the swing failure at D that turns the level into an entry. The premium engine, Zeno, prints buy and sell signals with a stop and targets; a Zeno signal firing at a completed ABCD on an order block is the pattern with its confirmation built in.
Three legs, two ratios, one rule: D is a level to watch, not a price to buy. Project it from C once BC has stalled in the 0.618–0.786 window, note whether CD is arriving on AB's schedule, and only act when price reaches D and closes back through it on the lower timeframe. Stop a tenth of AB beyond, partial at 0.382 of AD, second at 0.618, and take it with the daily trend, not against it.
◆ Interactive check
Do you know the ratios?
Questions traders ask about the ABCD pattern
A three-leg price structure where the third leg repeats the first: A to B, a retracement to C of 0.618 to 0.786 of AB, then C to D by the same distance as AB. D is the completion, where a bullish pattern is bought and a bearish one sold. It comes from Gartley (1935) and is the building block of the larger harmonic patterns.
BC retraces between 0.618 and 0.786 of AB; CD equals AB in price (1.0), or extends to 1.27 or 1.618 of AB when the second leg is faster; CD ideally matches AB in bar count as well. Entry at D on a lower-timeframe reversal, stop about a tenth of AB beyond D, targets at the 0.382 and 0.618 retracements of the whole AD move.
Once C has stalled inside the 0.618–0.786 window, add the AB distance to C (for a bearish pattern; subtract for a bullish one) to get the 1.0 completion. Multiply AB by 1.27 and 1.618 for the alternate completions used when CD is moving faster than AB did. The calculator on this page does the arithmetic and the timing check.
At D — but on confirmation, not with a resting order at the projection. Wait for price to reach the completion zone and print a reversal on the lower timeframe: a 1-hour close back through D on a 4-hour pattern, a swing failure, or a structure shift. A limit at the exact projection gets filled on the patterns that fail.
The Gartley adds a fourth leg, XA, before the ABCD, and requires B to sit at 0.618 of XA and D at 0.786 of XA. Every Gartley contains an ABCD; not every ABCD is part of a Gartley. The Bat and Butterfly are the same idea with different XA ratios.
Essentially, yes. The classical measured move — a second leg equal to the first — is the ABCD without the Fibonacci requirement on BC. Elliott's corrective waves describe the same structure in a third vocabulary. The edge, such as it is, comes from corrections tending to unfold in two equal legs; the ratios refine where "equal" is likely to land.
On 4-hour and daily BTCUSDT and ETHUSDT charts, yes, and the CD leg extends to 1.27 or 1.618 more often than on forex because crypto corrections tend to overshoot. On low timeframes of thin altcoins every wiggle qualifies; require 15-minute and above and a level at D.
Any, with a lower timeframe for the trigger: 4-hour patterns with 1-hour confirmation and daily patterns with 4-hour confirmation are the usual pairs. Below 15 minutes the ratios fit random noise too easily.
Gartley's original observation was that the two impulse legs tend to match in duration as well as distance. A CD that reaches the price in the same number of bars as AB completes cleanly at 1.0; one that arrives in half the time has stronger momentum and usually runs to 1.27 or 1.618 first. Counting bars tells you which projection to trust.
No — the ratios take seconds with the Fibonacci tool, and the value is in what sits at D. Order Blocks with Volume and Fair Value Gaps + Inversion show whether the completion lands on a level; Liquidity Sweeps marks the swing failure at D that confirms it. Zeno, the premium engine, prints signals with stops and targets.
References & Related Guides
Read next
- Harmonic Patterns: Complete Guide
- Fibonacci Retracement
- Elliott Wave Flat Corrections
- Order Blocks: Complete Guide
- Swing Failure Pattern (SFP)
- Quasimodo Pattern (QM)
- Fair Value Gaps: Complete Guide
- Order Blocks with Volume (free indicator)
- Liquidity Sweeps (free indicator)
- Fair Value Gaps + Inversion (free indicator)
- Zeno — the premium engine