Swing Failure Pattern (SFP)
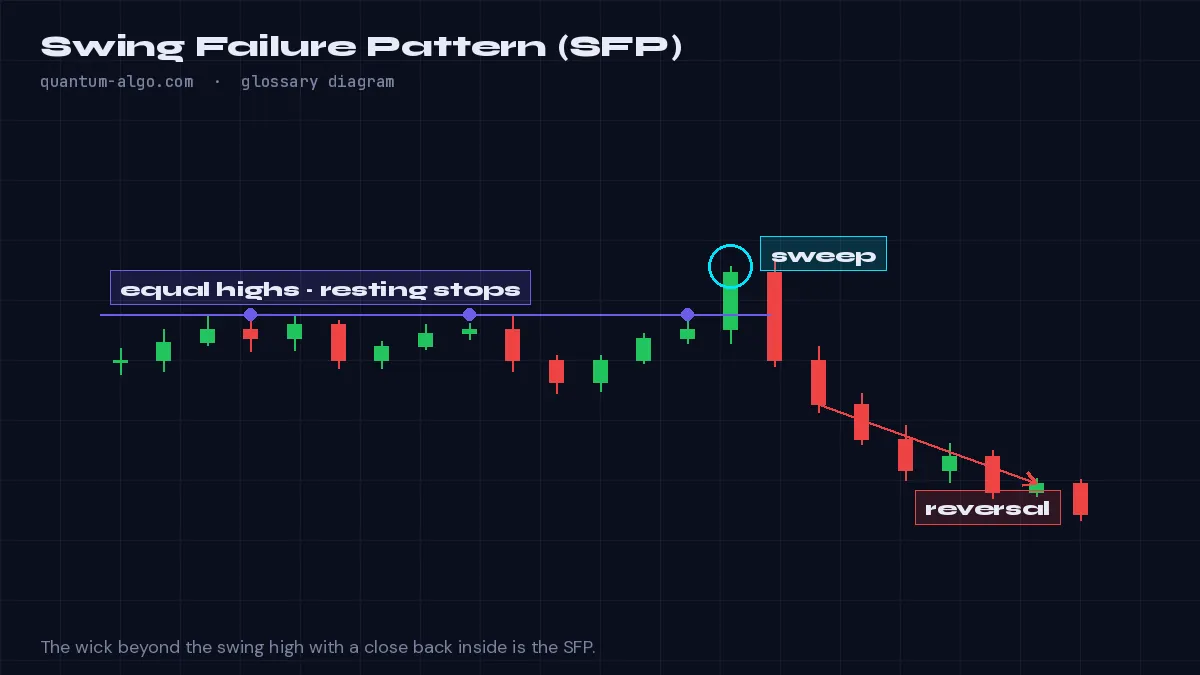
A swing failure pattern is a candle that wicks beyond a prior swing high or low and closes back inside it — a failed attempt to continue that reveals a liquidity sweep and often marks a reversal.
What it means
The swing failure pattern is the single-candle form of a liquidity sweep: price pushes through a previous swing point, cannot close beyond it, and leaves a long wick. Above a swing high the SFP is bearish; below a swing low it is bullish. The wick shows where stops were taken and where the market rejected the new price.
SFPs are popular in crypto trading because perpetual markets are liquidity-driven and stops cluster at obvious swings. The pattern is strongest when the swept level held several times before, when volume spikes on the sweep candle, and when a higher-timeframe point of interest sits at the same price.
The trade enters on the close of the SFP candle or on the next bar, with the stop beyond the wick and the target at the opposite side of the range or the next liquidity pool. A second candle closing beyond the level cancels the pattern.
How to identify it on a chart
- Find a prior swing high or low that price is approaching.
- A candle wicks through it and closes back inside — that is the SFP.
- Confirm with volume on the sweep and a lower-timeframe change of character.
Worked example
ETH prints a swing high at 3,180. Two days later a 4-hour candle spikes to 3,196 and closes at 3,162 with double the average volume — a bearish SFP; the short targets 3,050 with the stop at 3,200.
See it on the chart, read it in depth
Frequently asked questions
What is the difference between an SFP and a liquidity sweep?
An SFP is a specific candle pattern; a liquidity sweep is the market event. Every SFP is a sweep, but a sweep can take several candles and still not form a clean SFP.
How much wick is needed?
Enough to clearly trade beyond the swing point; the close must be back inside it. There is no fixed ratio, though the more of the candle beyond the level, the stronger the rejection.
Which timeframe works best?
1-hour to daily on crypto; the higher the timeframe, the more reliable, at the cost of fewer setups.
Can an indicator find SFPs?
Yes — Liquidity Sweeps detects wick-through-and-close-back patterns at confirmed swings and marks them.
Related terms
See Swing Failure Pattern (SFP) on your TradingView chart
Zeno reads Smart Money structure across timeframes and prints the entry, stop and targets — with a public record of every posted trade. The free indicators draw the concepts this page defines.