Bull Trap and Bear Trap: How to Spot Them and How to Trade the Reversal
A bull trap is a breakout above resistance that closes back below the level and reverses down, leaving the traders who bought the break holding losses; a bear trap is the mirror below support. They happen because the stops and breakout orders sitting beyond an obvious level are the only buying (or selling) behind the break, and once they are filled the move runs out of orders. The trade is the reclaim — the close back through the level — with the stop beyond the breakout wick and the first target one penetration depth on the far side.
Every trader has bought a breakout that closed back inside the range ten minutes later. The first time it feels like a conspiracy; by the tenth it is a pattern, and the traders on the other side of it were waiting for you. This page is the mechanism, the anatomy of a trap in five stages, the three tells that separate a trap from a breakout, the trade step by step, a BTCUSDT bear trap worked in points, and where fading traps goes wrong. The tool scores a break and tells you whether to fade it, wait, or treat it as real.
Indicators that prove themselves in public.
One engine, four precision tools — the Gold (XAU) Scalper, the institutional Gravity Zone, the Zeno momentum Oscillator, and Zeno Stocks for equities.



What a bull trap and a bear trap are
A bull trap is a breakout above a resistance level that fails: price closes above the level or wicks through it, buyers enter, and then price closes back below the level and falls, leaving those buyers holding a loss with their stops just below. A bear trap is the mirror — a break below support that reverses. The word "trap" is from the point of view of the trader who took the breakout; from the point of view of the trader who faded it, the same event is a liquidity sweep, a stop run, or a swing failure. Same candle, four names.
Why they happen is mechanical, not moral. Above every obvious resistance sit two groups of orders: stops from short sellers, and buy-stop entries from breakout traders. Both are buy orders. A push through the level triggers all of them, and if there is no further buying behind them, the push runs out of orders and price comes back. The larger the crowd watching the level, the larger the trap, which is why the most textbook breakouts on the most-watched levels fail most often.
What a trap does not mean: it does not mean the level was wrong, and it does not mean the market is "manipulated" in any way you can trade. It means a breakout needs follow-through to be real, and the way to tell whether it has follow-through is the close and the retest, not the first wick.
The anatomy of a trap
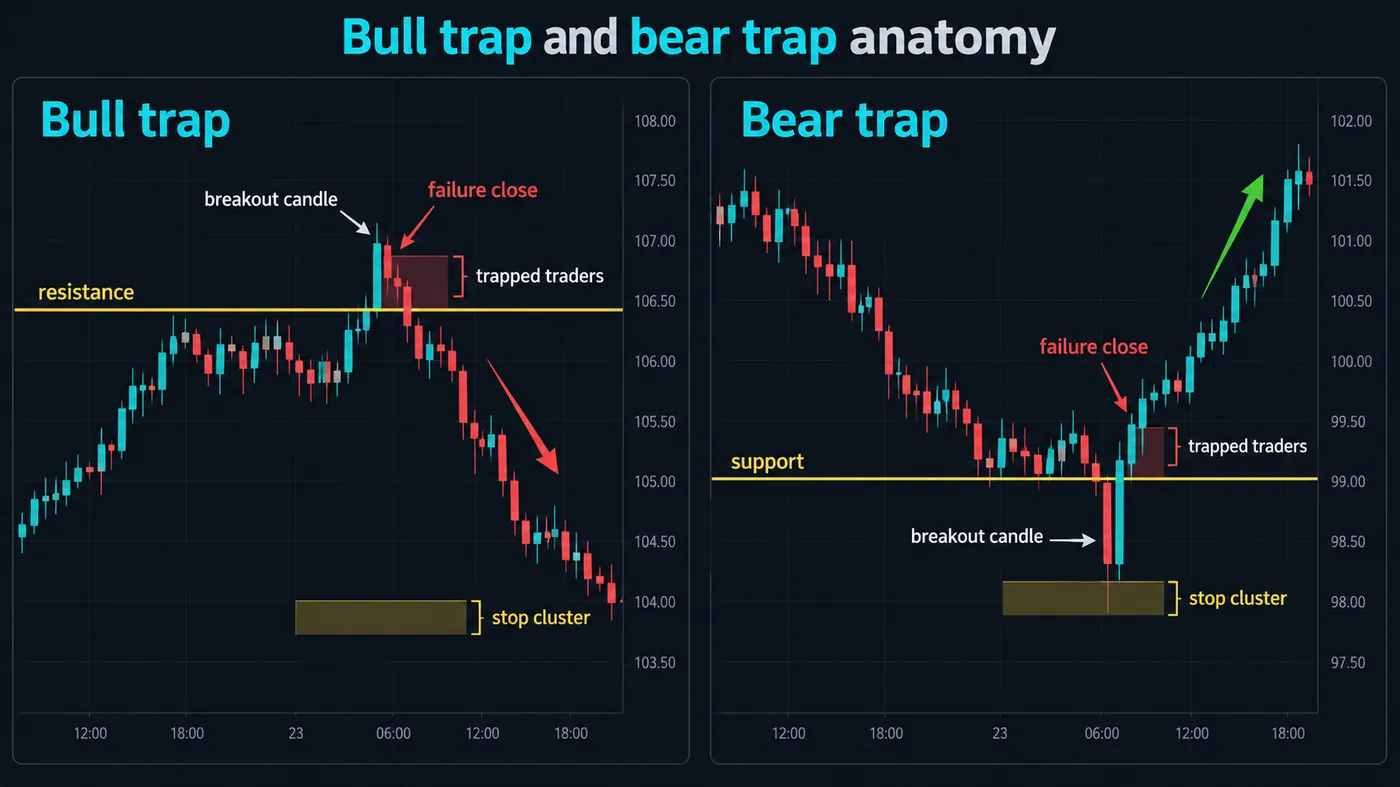
| Stage | Bull trap | Bear trap | What the trapped trader did |
|---|---|---|---|
| 1. The level | A resistance everyone can see: prior high, range top, round number | A support everyone can see: prior low, range bottom | Placed a buy stop above (or a sell stop below) it |
| 2. The break | Price trades through, often on a fast candle | Price trades through, often with a long wick | Got filled at the worst price of the move |
| 3. The failure | The candle closes back below the level, or the next one does | The candle closes back above the level | Is now underwater with a stop just beyond the extreme |
| 4. The unwind | Price falls; trapped longs stop out, adding sell pressure | Price rallies; trapped shorts cover, adding buy pressure | Provided the fuel for the move against them |
| 5. The target | The last swing low, or one penetration depth below the level | The last swing high, or one penetration depth above the level | — |
Stage 3 is the only one that matters for the trade. Until the close back through the level, it is a breakout in progress and you do not know. After it, the trap is confirmed and the trade is the reclaim.
Trap versus real breakout: the three tells
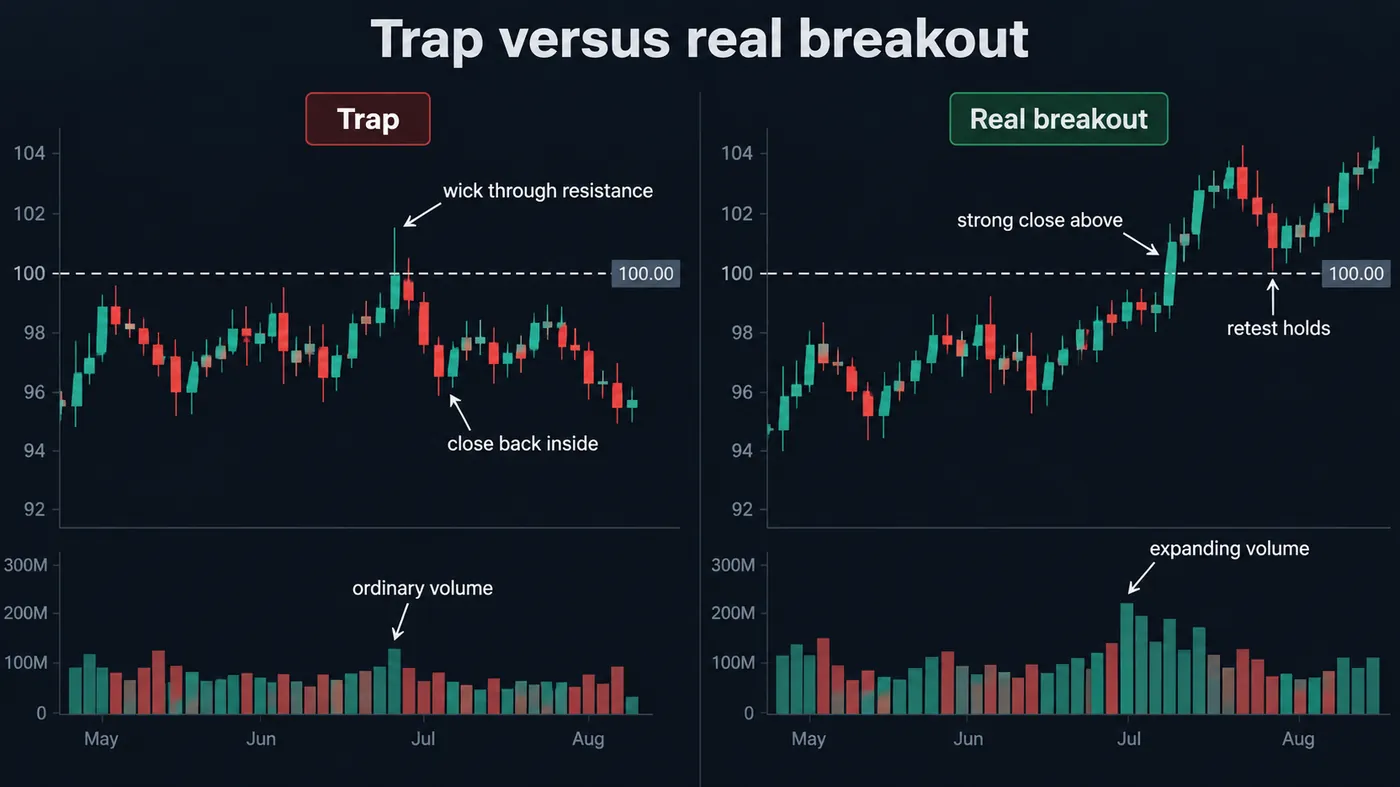
The close. A real breakout closes beyond the level on the timeframe that defined the level, and the next candle does not close back inside. A trap wicks through and closes back inside, or closes marginally beyond and reverses on the next candle. If your level is a 4-hour range high, the 5-minute close means nothing; wait for the 4-hour candle.
The volume. Real breakouts expand volume — typically 1.5 to 2 times the 20-bar average on the breakout candle — because new participants arrive. Traps happen on ordinary or low volume, because the only buying was the stops that were already there. The exception is the news-driven spike that traps everyone on high volume; on data days the volume tell is unreliable and the close is all you have.
The retest. A real breakout comes back to the level and holds it as support (or resistance) on lighter volume, then continues. A trap comes back to the level and goes straight through. The retest is the one signal that arrives after you can already trade it, which is why breakout traders enter on the retest and trap traders enter on the reclaim: both are waiting for the same information.

Automate your trades. Let Quantum Algo trade for you.
Every signal executed on your own account — on your account, with the plan you define.
How to trade a trap
- Mark the level and the crowd. A level is trappable when it is obvious — a range high tested three times, a prior day's high, a round number on BTC. If nobody is watching it there are no stops to run.
- Do not trade the break. The first candle through the level is where the trap is being set. Breakout traders enter here; you wait.
- Wait for the close back through the level. On the timeframe that defined the level. A 4-hour range high needs a 4-hour close; a 15-minute opening range needs a 15-minute close. Until then it is a breakout in progress.
- Enter on the reclaim, with the stop beyond the extreme. Short the close back below resistance (bull trap) with the stop above the breakout wick. Long the close back above support (bear trap) with the stop below the wick. The wick is the sweep; if it is exceeded, the sweep failed to fail.
- Target the other side. First target one penetration depth beyond the level on the far side — if the trap poked 420 points above, target 420 below. Then the last swing low or high. In a range, the opposite edge.
- Manage on the retest of the level. Price often comes back to the level from the other side. If it holds as resistance now, add or hold; if it closes back through, the trap has trapped you and you leave.
Trap or breakout tool
Give it the level, the breakout candle's extreme and close, the volume ratio against the 20-bar average, and how many candles have closed beyond the level since. It scores the break and returns the trade — fade, wait, or treat as a breakout — with the stop and first target.
Reference data
| Item | Value |
|---|---|
| Bull trap | A break above resistance that closes back below it and reverses down |
| Bear trap | A break below support that closes back above it and reverses up |
| Same event, other names | Liquidity sweep, stop run, stop hunt, swing failure pattern (SFP), false breakout, fakeout, Turtle Soup |
| Confirmation | A close back through the level on the timeframe that defined the level |
| Three tells | The close (inside vs beyond), the volume (ordinary vs expanded), the retest (fails vs holds) |
| Entry | The reclaim — the close back through the level |
| Stop | Beyond the breakout extreme (the wick) |
| First target | One penetration depth beyond the level on the far side; then the last swing |
| Where they cluster | Obvious levels: range edges, prior day/week highs and lows, round numbers, session opens, equal highs and lows |
| Where the tells break | News candles (high-volume traps), thin markets (random wicks), very high timeframes (one wick is a week) |
Worked example: BTCUSDT, a bear trap at range support
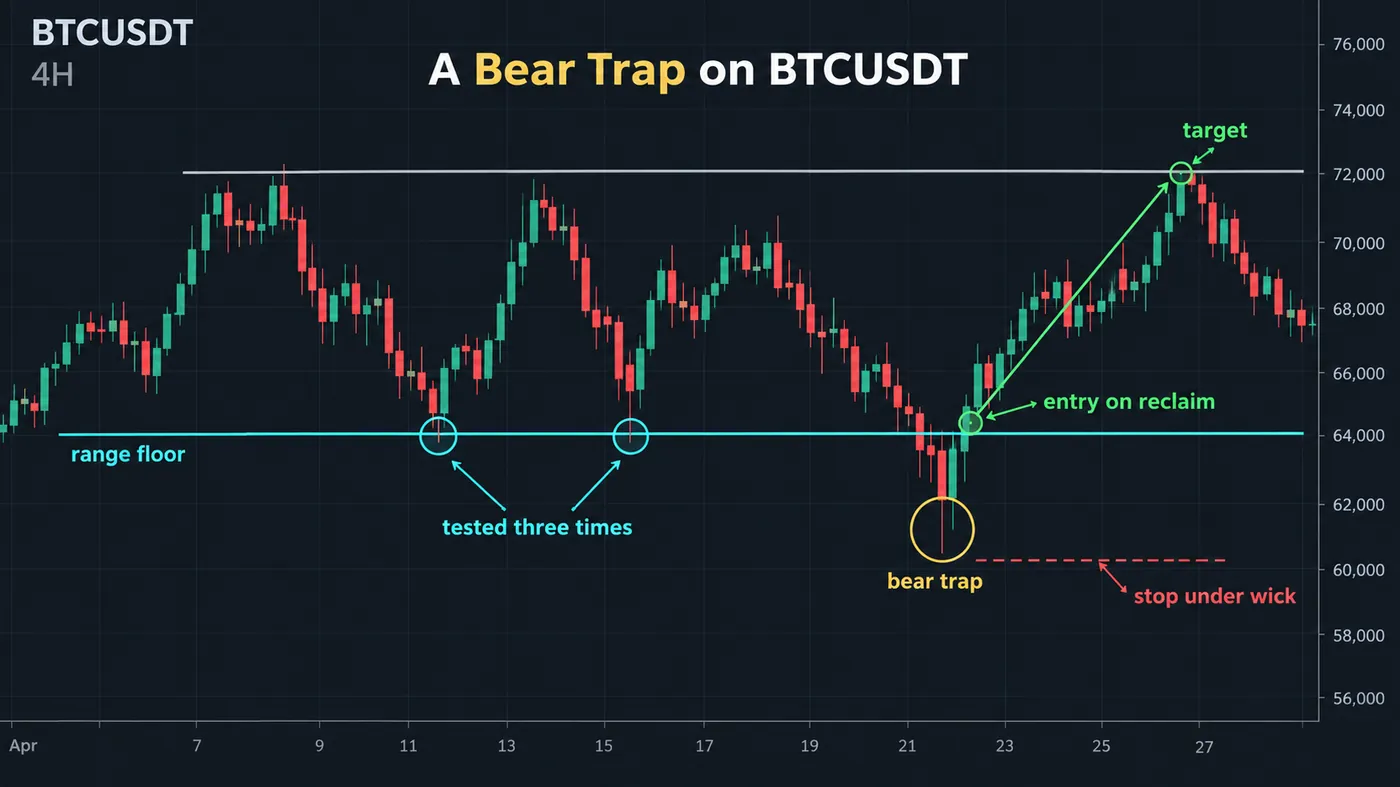
BTCUSDT perpetual, a Sunday-to-Monday range with a floor at 63,400 tested three times over four days — a level every 4-hour chart on the exchange had drawn. The Monday 09:00 New York 4-hour candle broke it: 63,110 at the low, 290 points through, on volume 0.8 times the 20-bar average. Nothing new arrived; the stops did the selling. The candle closed at 63,560, back above the floor. Bear trap confirmed at the 13:00 close.
Long at 63,560 on the close, stop at 63,050, sixty points under the wick, 510 points of risk. First target one penetration depth above the level: 63,400 + 290 = 63,690, which is inside the risk and not worth a partial on its own; the second target was the range high at 65,150, 1,590 points away, 3.1R. Between them, the 4-hour swing high at 64,380 for a first partial at 1.6R.
Price reached 64,380 at 21:00 Monday and 65,120 at 09:00 Tuesday, thirty points short of the range high, before the next 4-hour candle closed red. Partial at 1.6R, the rest closed at 65,050 for 2.9R. The trade lasted twenty hours and was decided by one thing: a 4-hour candle that closed 160 points above the level it had just broken. Everyone who sold the break sold the low of the week.
Had the 13:00 candle closed at 63,300 — below the level — there would have been no trade and no opinion. A break that holds its close is a breakout, and the fact that it looked like a trap for three hours would have been irrelevant.
Where trap trading fails
Trend days. In a strong trend every pullback through a level looks like a trap and none of them are. A bear trap fade in a market that is making lower lows every four hours gets one bounce and then a new low. Read the higher timeframe first; fade traps against the range, not against the trend.
News. A CPI print drives a break on huge volume; the reversal an hour later looks like a trap by every rule above except that the volume was real. On data days, wait for two closes rather than one, and size down.
The trap that traps you. Price closes back through the level, you enter, and it goes through the level again the other way. Two-sided sweeps are common at range edges before a genuine breakout. The stop beyond the wick is not optional.
Timeframe mismatch. Calling a 4-hour level broken because a 5-minute candle closed beyond it, or calling a trap because a 5-minute candle closed back. The level and the close belong to the same timeframe.
Thin markets. On an illiquid altcoin or a small cap after hours, a single order wicks through any level. Those are not traps, they are the absence of a market. Require normal volume for the reading to mean anything.
Mistakes traders make with traps
- Fading the break before the close. The first wick through a level is the trap being set, not confirmed. Half the traders stopped in a trap were fading it early.
- Ignoring the higher timeframe. A trap against the daily trend is a scalp, not a swing.
- Putting the stop at the level instead of beyond the wick. A second poke through the level is normal; a poke through the wick is invalidation.
- Calling every failed breakout a manipulation. It is stops running out. Understanding the mechanism keeps the trade mechanical.
- Targeting the moon. The first target is one penetration depth; the second is the last swing. Trapped traders provide fuel for a move, not a trend.
- Trading traps on levels nobody watches. No crowd, no stops, no trap.
Traps and the free indicators
The Liquidity Sweeps script labels exactly the candle this page is about: a wick beyond a swing point with a close back inside, on any timeframe, with the level it swept. Run it on the timeframe that defined your level and the traps mark themselves. The Smart Money Concepts Engine adds the structure context — a sweep followed by a change of character is a trap that has already begun to pay. The premium engine, Zeno, prints buy and sell signals with a stop and targets; a signal that prints on the reclaim candle after a sweep is one of its most common and most reliable contexts.
A breakout is real when it holds its close and its retest on the timeframe that defined the level; it is a trap when it closes back inside. Never trade the first candle through — wait for the close, enter on the reclaim, stop beyond the wick, target one penetration depth and then the last swing. Fade traps against the range, not against the trend, and distrust the volume tell on news days.
◆ Interactive check
Trap or breakout?
Questions traders ask about bull traps and bear traps
A breakout above a resistance level that fails: price trades or closes above the level, attracts buyers, then closes back below the level and falls. The buyers are trapped with their stops just below, and those stops fuel the move down.
The mirror of a bull trap: a break below support that closes back above the level and rallies, trapping the sellers who shorted the break and the longs who were stopped out on it.
Three tells. The candle closes back inside the level rather than beyond it; the breakout happened on ordinary or low volume rather than 1.5 to 2 times average; and the retest of the level fails rather than holds. The close is the one that arrives first and matters most.
Wait for the candle on the timeframe that defined the support to close back above it. Go long on that close with the stop below the breakout wick. First target one penetration depth above the level; then the last swing high or the range top.
Yes, from the other side. "Bull trap" describes the event from the breakout buyer's point of view; "liquidity sweep", "stop hunt" and "swing failure pattern" describe the same candle from the point of view of the trader fading it. The mechanics — stops beyond an obvious level get run, then price reverses — are identical.
Order placement. Beyond every obvious level sit stop orders and breakout entries, and both are orders in the same direction. A push through triggers them all; if no new participants follow, the move is made entirely of orders that were already there and it reverses when they are exhausted. Larger crowds at a level mean larger traps.
Beyond the extreme of the breakout candle — the wick — with a small buffer. Not at the level: price often pokes the level a second time before the real reversal, and a stop there is taken by noise. If price trades through the wick, the sweep has failed to fail and the reading is wrong.
Constantly. Bitcoin and Ethereum perpetuals run stops beyond range edges, prior-day highs and lows, and round numbers on a schedule that would embarrass a forex pair, partly because liquidation clusters sit exactly where the stops do. The 4-hour and daily closes are the timeframes to judge them on.
You cannot with certainty, which is why the trade waits for the close. What tilts the odds before it: a breakout on expanding volume into a market with room to run is more likely real; a break on ordinary volume at a level tested many times, with the higher timeframe pointing the other way, is more likely a trap.
The free Liquidity Sweeps script marks exactly this candle — a wick beyond a swing point with a close back inside — on any timeframe. The Smart Money Concepts Engine adds the change of character that follows a trap that is working. Zeno, the premium engine, prints signals with stops and targets and frequently fires on the reclaim candle after a sweep.
References & Related Guides
Read next
- Liquidity Sweep Trading
- Swing Failure Pattern (SFP)
- Breakout Trading Strategy
- Breakout Probability
- Candle Range Theory (CRT)
- What Is a Market Structure Shift?
- What Is ORB (Opening Range Breakout)?
- Turtle Soup — glossary
- Inducement — glossary
- Liquidity Sweeps (free indicator)
- Smart Money Concepts Engine (free indicator)
- Zeno — the premium engine