Put/Call Ratio: What It Measures, How to Read It, and When It Actually Works
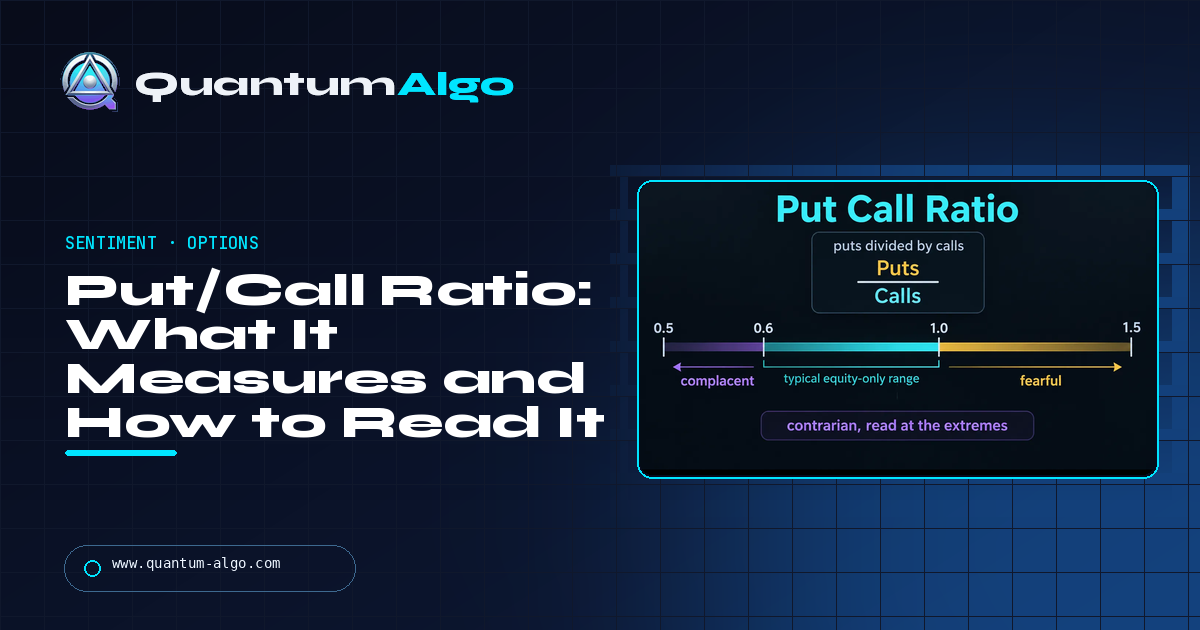
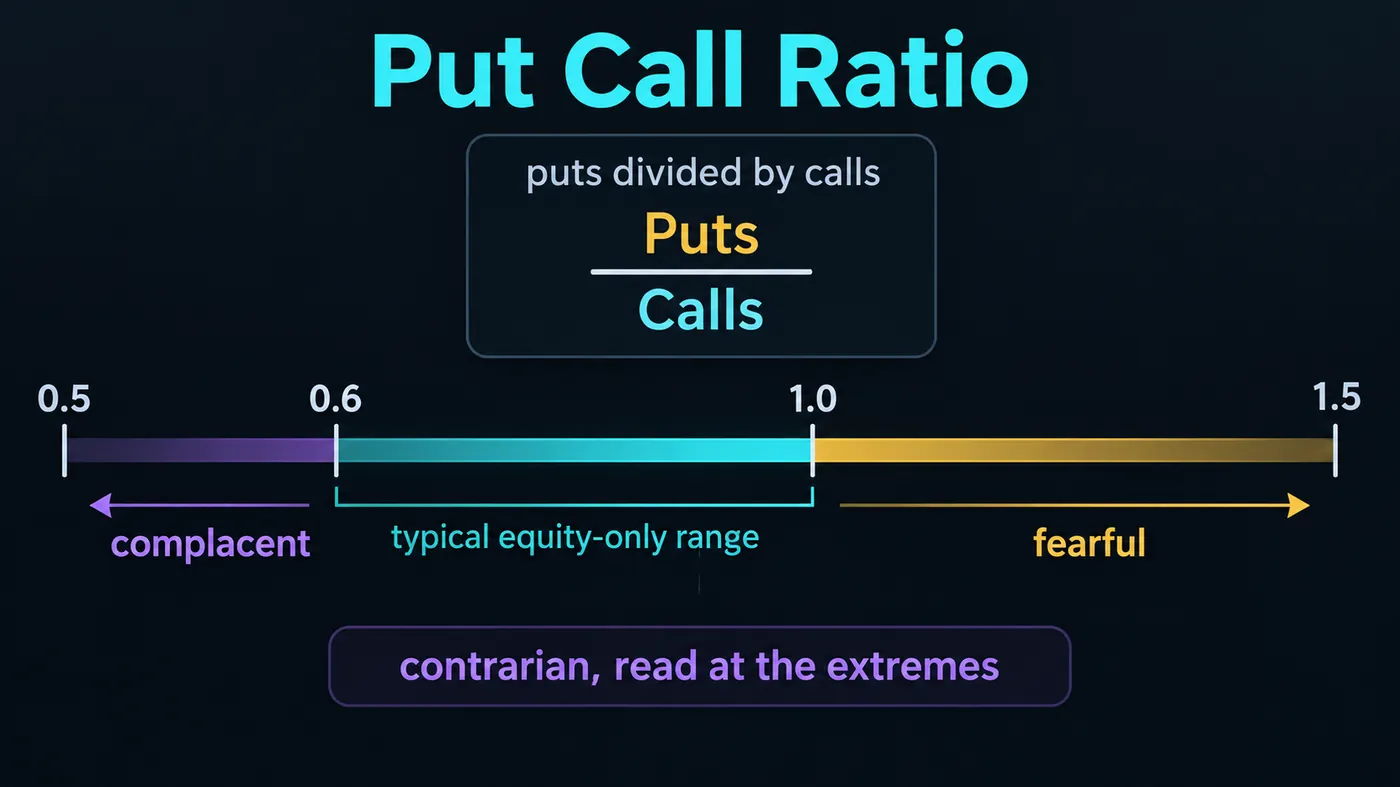
The put/call ratio is put option volume divided by call option volume over a session. Below about 0.5 on the CBOE equity-only series the crowd is buying calls and is complacent; above about 1.0 it is buying puts and is fearful. It is read as a contrarian gauge, at the extremes only, and against each series' own baseline — the index ratio sits near 1.2 because it is hedging-driven, the equity ratio near 0.7 because it is speculation-driven. A spike above the 10-day average followed by a price reversal is the usable signal; the ratio on its own is not an entry.
The put/call ratio is the one sentiment number I still check every morning, and the one most people misquote, because the headline figure blends three crowds with three different normals. This page is the formula, the three CBOE series and why their baselines differ, how to read a spike against the 10-day average, the confirmation step that turns a reading into a trade, a pullback-low example with the failure case beside it, and where the ratio has stopped working as options markets changed. The tool computes the ratio and places it in the right zone for the right series.
Indicators that prove themselves in public.
One engine, four precision tools — the Gold (XAU) Scalper, the institutional Gravity Zone, the Zeno momentum Oscillator, and Zeno Stocks for equities.



What the put/call ratio measures
The put/call ratio is put volume divided by call volume over a period, usually one trading day. Traders buy puts to bet on or hedge against a fall and calls to bet on a rise, so the ratio is a rough census of what the options crowd is doing. A reading of 0.55 means 55 puts traded for every 100 calls — the crowd is leaning bullish. A reading of 1.20 means more puts than calls — the crowd is leaning bearish or hedging heavily.
It is read as a contrarian gauge, and only at the extremes. The logic is the same as any sentiment measure: when nearly everyone has already bought calls, there are few buyers left to push the market higher, and the reverse at the other end. Martin Zweig wrote about it in the 1970s and the CBOE has published daily ratios since the 1990s. The middle of the range — most days — carries no information at all.
What the ratio does not do: it does not distinguish between opening and closing trades, between a hedge and a speculation, or between a retail trader buying ten contracts and a fund buying ten thousand. It measures volume, not open interest and not positioning. That is why the equity-only series is more useful than the total and why single-day readings are noisier than a moving average of them.
The formula and the three series
| Series | What it includes | Typical baseline | Complacent below | Fearful above | Best use |
|---|---|---|---|---|---|
| CBOE equity-only ($CPCE) | Options on individual stocks | ~0.7 | ~0.5 | ~1.0 | Retail and speculative sentiment; the cleanest contrarian series |
| CBOE total ($CPC) | Equity + index + ETF options | ~0.9 | ~0.7 | ~1.2 | Headline number; blends hedging and speculation |
| CBOE index ($CPCI) | Options on SPX, VIX and other indices | ~1.2 | ~0.9 | ~1.6 | Institutional hedging; high readings are normal here |
| Single stock | One name's options | Varies | Own history | Own history | Earnings positioning; read only against the name's own range |
| Crypto (Deribit BTC/ETH) | Options on one venue | ~0.5–0.7 | ~0.4 | ~0.9 | Thin; dominated by a few large trades and expiry days |
The baselines differ because the participants differ. Index options are bought mostly by funds hedging portfolios, so the index ratio sits above 1.0 most of the time and a reading of 1.2 is an ordinary Tuesday. Equity options are bought mostly by speculators, so the equity ratio sits around 0.7 and a reading of 1.2 is a panic. Read each series against its own history, never against the others.
How to read it
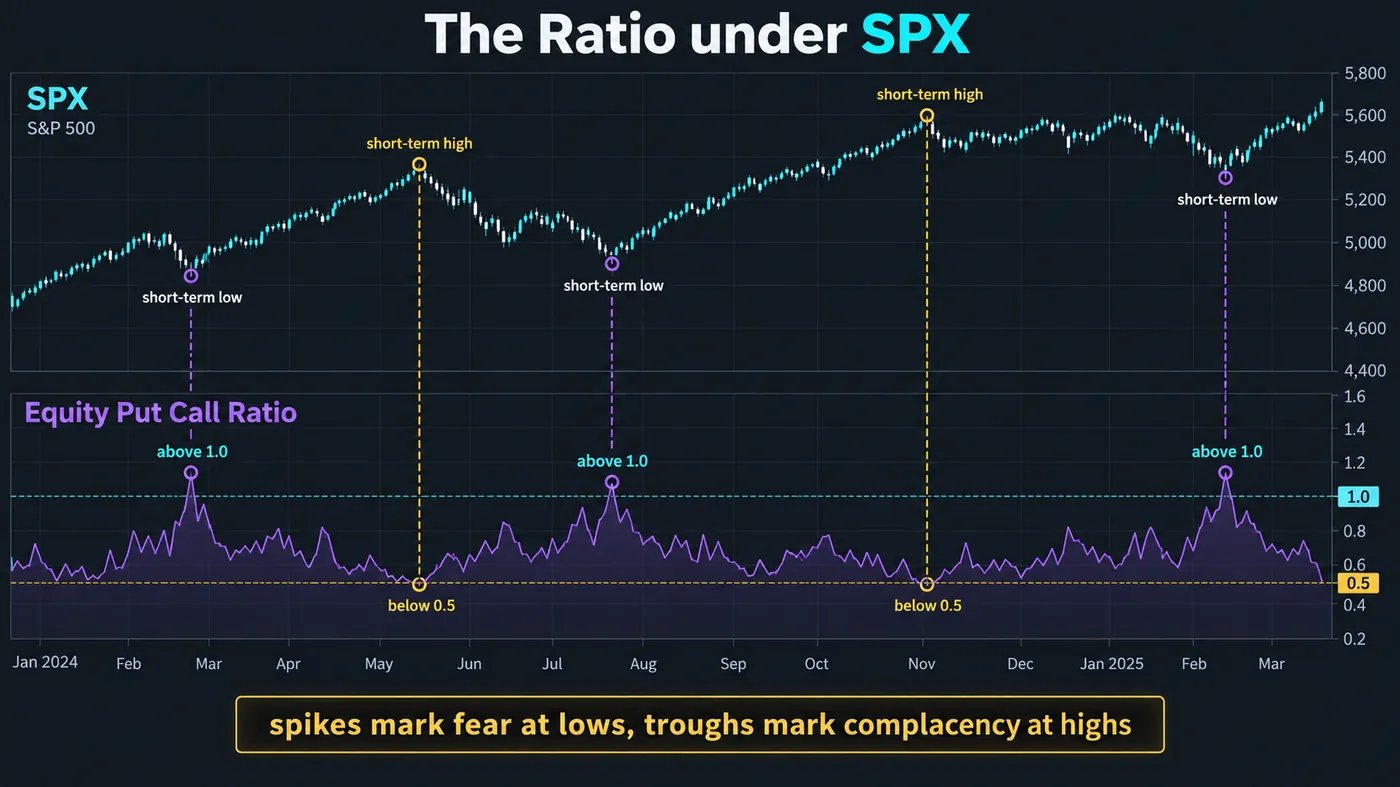
Extremes, not levels. The useful readings are the ones far from the recent average. A 10-day moving average of the equity ratio spiking above 1.0 during a sell-off has marked more short-term lows than any oscillator I know of; a 10-day average sinking below 0.55 has marked short-term tops nearly as well. The spike is the signal. The absolute level, on its own, is not.
Confirmation from price. A fearful reading tells you the crowd has bought protection; it does not tell you the fall is over. The signal is the spike followed by a reversal day — a close back above the prior day's high, a swing failure at a level, a structure shift on the hourly chart. The ratio gets you watching; the chart gets you in.
Duration. Complacency can last for months in a bull market. A low equity ratio in a strong uptrend is a reason to tighten stops, not to short. Fear rarely lasts more than a few days at the extreme, because puts are expensive to hold, which is why the fearful side of the ratio produces better timing than the complacent side.
Smoothing. Single-day readings are jerky — an expiry day, a big block, one name's earnings can swing the total ratio 20%. Most practitioners use a 5- or 10-day average and look at where today sits against it. The tool below does that arithmetic.

Automate your trades. Let Quantum Algo trade for you.
Every signal executed on your own account — on your account, with the plan you define.
Put/call ratio reader
Put in today's put and call volume for the series you are looking at and, optionally, the 10-day average of the ratio. The tool returns the ratio, the zone it sits in for that series, and how far today is from recent readings — which is the part that matters.
Total versus equity versus index
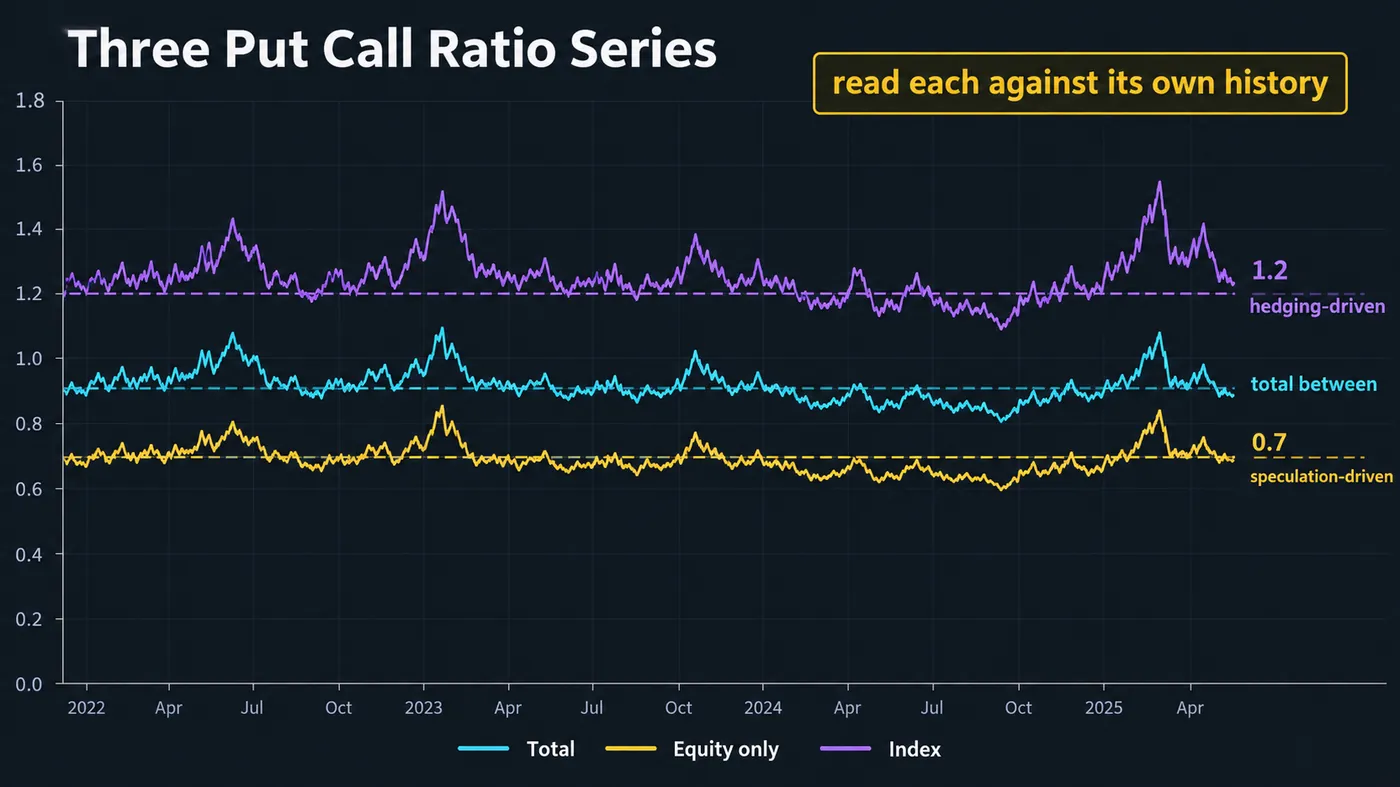
The most common mistake with the put/call ratio is quoting the total number as if it were the equity number. On a day when the equity ratio prints 0.62 (mildly complacent) the total might print 0.95 (looks cautious) because index hedging is running normally at 1.3. Neither number is wrong; they measure different crowds. For timing the stock market, the equity-only series is the one to watch, because it isolates the crowd whose behaviour is worth fading. The index series is worth watching for a different reason: a sudden collapse in index put volume — funds giving up on hedges — has preceded some of the sharper corrections, which is a complacency signal from the professional side rather than the retail one.
Reference data
| Item | Value |
|---|---|
| Formula | Put volume ÷ call volume, per session |
| Source | CBOE daily statistics (total, equity, index, VIX); Deribit for BTC and ETH options |
| TradingView symbols | USI:PCC (total), USI:PCCE (equity), USI:PCCI (index) — availability varies by plan |
| Equity-only baseline | ~0.7; complacent below ~0.5, fearful above ~1.0 |
| Total baseline | ~0.9; complacent below ~0.7, fearful above ~1.2 |
| Index baseline | ~1.2; hedging-dominated, so high readings are normal |
| Direction of the read | Contrarian: high ratio = fear = look for lows; low ratio = complacency = look for tops |
| Smoothing | 5- or 10-day moving average; compare today with it |
| Confirmation | A price reversal after the extreme — the ratio alone is not an entry |
| Related measures | VIX, VIX term structure, AAII survey, fear and greed indices, open interest put/call (positioning rather than flow) |
| Origin | Martin Zweig, 1970s; CBOE publishes daily ratios since the mid-1990s |
Worked example: an equity put/call spike at a pullback low
Take a two-week pullback in SPX — the kind that happens three or four times a year — and the equity-only put/call ratio through it. Day 1 to day 6, the ratio drifts from 0.58 to 0.71 as price falls 3%: cautious, not fearful. Day 7, a gap down on a headline: the ratio prints 1.06, the first reading above 1.0 in four months, and the 10-day average is 0.66, so the day is 60% above it. The tool would call that fearful and a spike. That is the "watch" signal.
Day 8, price opens lower, sweeps the prior week's low by 0.4%, and closes back above it — a daily swing failure with the ratio still at 0.94. That is the confirmation. Long on the day-8 close, stop under the day-8 low, target the 20-day high. The trade ran nine sessions and reached the target on day 17, while the equity ratio fell back to 0.61 by day 14 — the crowd that had bought puts at the low was buying calls again by the time the recovery was half done.
Now the failure case, same setup. Day 7 prints 1.06 and you buy the close because "fear marks lows". Day 8 gaps down another 2%; the ratio prints 1.21. Fear can get more extreme for a few days, and a spike is not a floor. The confirmation from price is what turns the reading into a trade, and it costs one day of waiting.
Where the put/call ratio fails
Trending markets. In a strong uptrend the equity ratio can sit below 0.55 for weeks while price keeps rising. Complacency is a condition, not a timing signal; it makes you cautious, it does not make you short.
Structural changes in options usage. Zero-days-to-expiry options, covered-call ETFs and systematic put-selling have changed what a "normal" ratio looks like from one year to the next. A fixed threshold learned five years ago may be wrong now; the 10-day average and percentile of recent readings age better than fixed levels.
Expiry and event days. Monthly expiry, index rebalances and big earnings days distort the single-day ratio. Skip those readings or smooth through them.
Volume is not positioning. A put bought to open and a put sold to close both count as put volume. Open-interest put/call ratios and dealer-positioning models answer the positioning question; the volume ratio answers the flow question. Do not confuse them.
Crypto. Deribit's put/call is dominated by a handful of large trades and by expiry-day flows; single readings are close to meaningless. Use the 7-day average, and treat it as one input beside funding and open interest.
Mistakes traders make with the put/call ratio
- Quoting the total ratio as if it were the equity ratio. Different crowds, different baselines.
- Trading the spike without price confirmation. Fear can get worse for days.
- Shorting complacency in an uptrend. Low readings persist; they are a reason to manage risk, not to fade.
- Using fixed thresholds from old books. Options markets change; use recent percentiles.
- Reading single-day prints. Smooth over 5 or 10 days.
- Treating volume as positioning. Opening and closing trades look identical in the ratio.
Sentiment and the free indicators
The put/call ratio is an off-chart input: it tells you the crowd is at an extreme, and the chart tells you when the extreme has turned. The free scripts cover the chart side. The Liquidity Sweeps script marks the swing failure that confirmed the worked example above; the Smart Money Concepts Engine marks the structure shift that follows; the Market Bottom Finder is built for exactly the capitulation days the ratio flags. The premium engine, Zeno, prints buy and sell signals with a stop and targets on any chart; a buy signal on a day the equity put/call ratio is above 1.0 is one I size up.
Puts over calls, read against the crowd, only at the extremes, only against the right series' own baseline. A spike in the equity ratio above the 10-day average marks fear; a price reversal the next day turns it into a trade. Complacency lasts, fear does not, so the low side is a risk-management signal and the high side is a timing one. Smooth the readings, ignore expiry days, and never quote the total number as if it were the equity one.
◆ Interactive check
Do you know which crowd you are reading?
Questions traders ask about the put/call ratio
Put option volume divided by call option volume over a trading session. It is a census of what the options crowd is doing: below 1.0 more calls traded than puts, above 1.0 more puts than calls. The CBOE publishes it daily for all options, equity options only, and index options only.
There is no "good" level, only a normal range per series. The equity-only ratio usually sits around 0.7; readings below about 0.5 show complacency and above about 1.0 show fear. The index ratio sits around 1.2 because it is dominated by hedging. What matters is how far today is from the recent average, not the level itself.
High readings mean the crowd is buying puts — fear — and are read as contrarian bullish, because short-term market lows tend to occur when protection buying peaks. The reading is a reason to watch for a reversal, not a reason to buy on its own; fear can get more extreme for several days.
The total includes everything; the equity-only series covers options on individual stocks and is dominated by speculators; the index series covers SPX, VIX and other index options and is dominated by institutional hedging. Their baselines are roughly 0.9, 0.7 and 1.2. For timing the stock market the equity-only series is the useful one.
Smooth it with a 5- or 10-day average, wait for a reading far from that average, then wait for price to confirm — a reversal day, a swing failure at a level, a structure shift. Enter on the confirmation with the stop under the reversal low. The ratio is the alert; the chart is the entry.
On the CBOE website daily, and on TradingView under the USI symbols (PCC total, PCCE equity, PCCI index), availability depending on your plan. For crypto, Deribit publishes BTC and ETH put/call ratios based on its own volume and open interest.
The volume ratio counts contracts traded today, opening and closing alike — it measures flow. The open-interest ratio counts contracts outstanding — it measures positioning. The volume ratio is the sentiment gauge; the open-interest ratio is closer to a positioning measure and moves more slowly.
Weakly. Deribit's ratio is driven by a small number of large trades and by expiry-day flows, so single readings are noisy. Use a 7-day average alongside funding rates and open interest rather than on its own.
Because complacency can persist for months in a bull market — the low side of the ratio is a condition, not a timing signal — and because the growth of zero-days-to-expiry options and systematic call selling has changed what a normal ratio looks like. Use recent percentiles rather than thresholds from older books, and treat low readings as a reason to manage risk.
No — it is an off-chart input. The free scripts cover the confirmation side: Liquidity Sweeps marks the swing failure at a fear low, the Smart Money Concepts Engine marks the structure shift after it, and the Market Bottom Finder is built for capitulation days. Zeno, the premium engine, prints signals with stops and targets on any chart.
References & Related Guides
Read next
- Crypto Fear and Greed Index
- Williams VIX Fix
- Open Interest Explained
- Options Trading for Beginners
- Best Indicator for Options Trading
- Day Trading Options
- Swing Failure Pattern (SFP)
- Mean Reversion Trading
- Crypto Market Breadth Indicator
- Market Bottom Finder (free indicator)
- Liquidity Sweeps (free indicator)
- Zeno — the premium engine