Gamma Exposure (GEX): Formula, Positive vs Negative Gamma, Zero Gamma and Walls
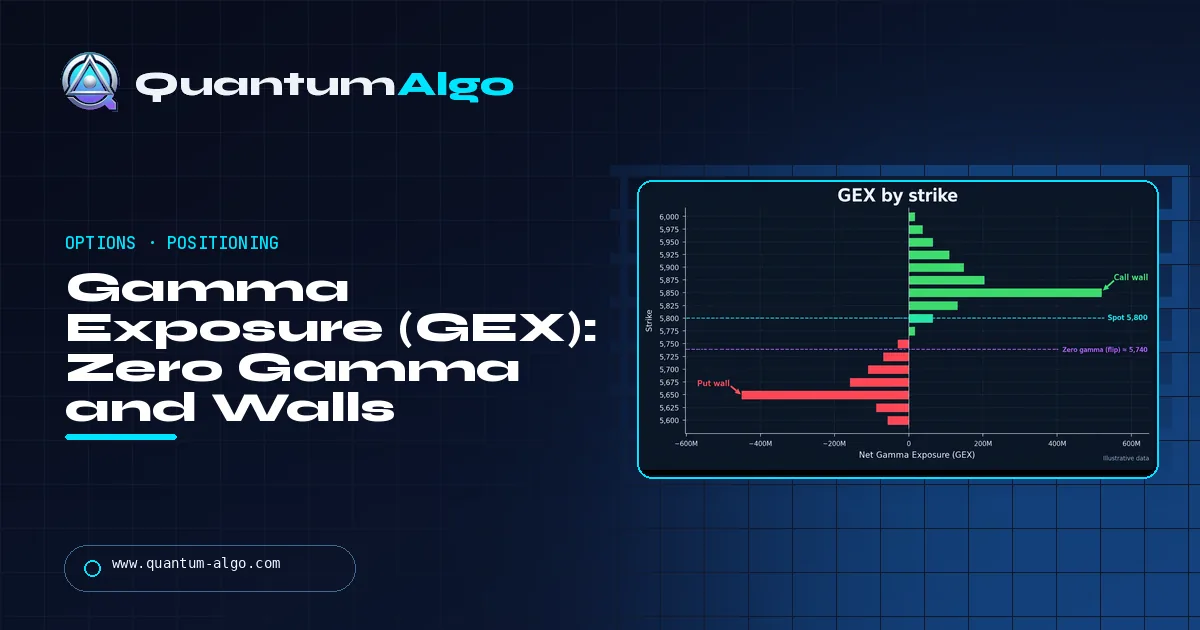
Gamma exposure (GEX) estimates how much options dealers must buy or sell to stay hedged per 1% move: Γ × open interest × 100 × spot² × 0.01, calls positive and puts negative. Positive GEX means dealers hedge against moves, which tends to dampen volatility; negative GEX means they hedge with moves, which tends to amplify it. The zero-gamma flip is the price where the total changes sign. It describes the kind of day to expect, not the direction.
On some days the S&P 500 refuses to move; on others every dip turns into a slide. Gamma exposure is the most widely used explanation of the difference: the hedging that options dealers must do as price moves. This guide explains the formula, the two gamma regimes, the zero-gamma flip and the call and put walls — and the assumptions behind every GEX number you see.
Indicators that prove themselves in public.
One engine, four precision tools — the Gold (XAU) Scalper, the institutional Gravity Zone, the Zeno momentum Oscillator, and Zeno Stocks for equities.



What is gamma exposure (GEX)?
Gamma exposure (GEX) estimates how much stock or futures options market makers would have to buy or sell to stay delta-hedged as the underlying moves. It is usually quoted in dollars per 1% move: a GEX of +$5 billion on the S&P 500 means dealers would sell about $5 billion as the index rises 1% and buy about $5 billion as it falls 1% — trading against the move. Negative GEX means the opposite: hedging that chases the move.
The idea was popularised by SqueezeMetrics in its white paper "Gamma Exposure (GEX)", first dated 2016 and revised in 2017, which linked the sign of GEX to how volatile the S&P 500 was the next day. Since then GEX, the zero-gamma "flip" level and call and put walls have become standard in index and 0DTE options commentary. This guide covers the formula, the two regimes, the flip, the walls — and the assumptions that limit all of it.
How is gamma exposure calculated?
For each strike, multiply the option's gamma by its open interest and the contract multiplier (100 for US equity and index options), then convert to dollars per 1% move by multiplying by spot² × 0.01. Calls are counted as positive and puts as negative:
| Piece | Formula |
|---|---|
| Call GEX per strike | Γ × call OI × 100 × S² × 0.01 |
| Put GEX per strike | − Γ × put OI × 100 × S² × 0.01 |
| Net GEX per strike | Call GEX + Put GEX |
| Total GEX | Sum of net GEX across all strikes and expiries |
The sign convention carries the key assumption: dealers are long the calls investors sell and short the puts investors buy. That is how SqueezeMetrics framed it — investors write calls and buy puts, market makers take the other side and hedge exactly to delta. If the real positioning differs, the sign of GEX at that strike is wrong. Gamma itself comes from an options model (usually Black-Scholes) using each option's implied volatility and time to expiry, which is why near-dated, at-the-money options dominate the total.
What do positive and negative gamma mean?
| Positive gamma | Negative gamma | |
|---|---|---|
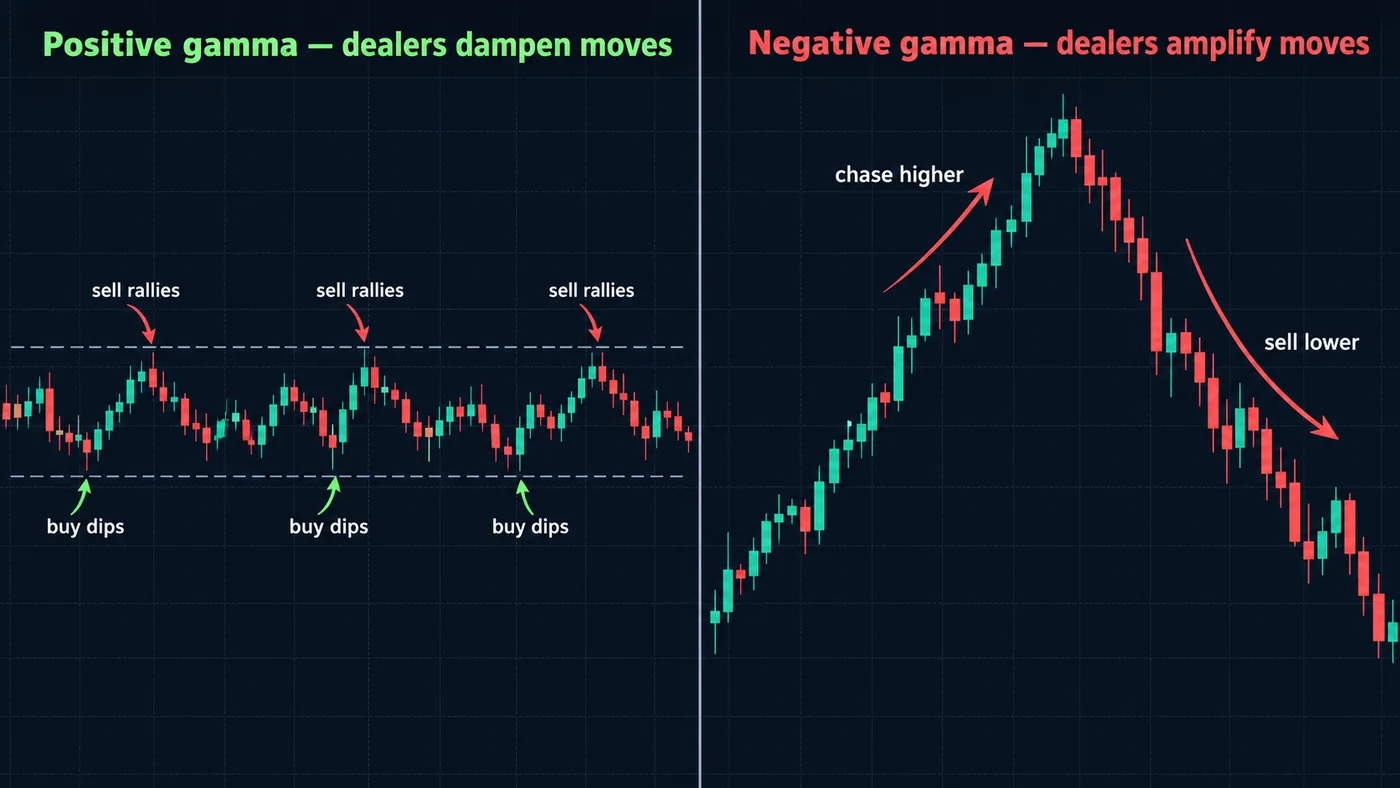
| Dealer hedging | Sell into rallies, buy into dips | Sell into declines, buy into rallies |
| Effect on moves | Tends to dampen them | Tends to amplify them |
| Realized volatility | Usually lower | Usually higher |
| Typical price action | Ranges, mean reversion, pinning near big strikes | Trend days, gaps, sharp extensions |
| Where spot sits | Above the zero-gamma flip | Below the flip |
The mechanism is simple. A dealer who is long gamma gets longer as price rises and shorter as it falls, so staying delta-neutral means selling strength and buying weakness — liquidity that leans against the move. A dealer who is short gamma has to do the reverse, adding to the move. SqueezeMetrics found that daily S&P 500 volatility was markedly lower when GEX was high and rose sharply as GEX fell below zero. That is the practical use of GEX: not where price goes, but what kind of day to expect.

Automate your trades. Let Quantum Algo trade for you.
Every signal executed on your own account — on your account, with the plan you define.
What is the zero gamma (gamma flip) level?
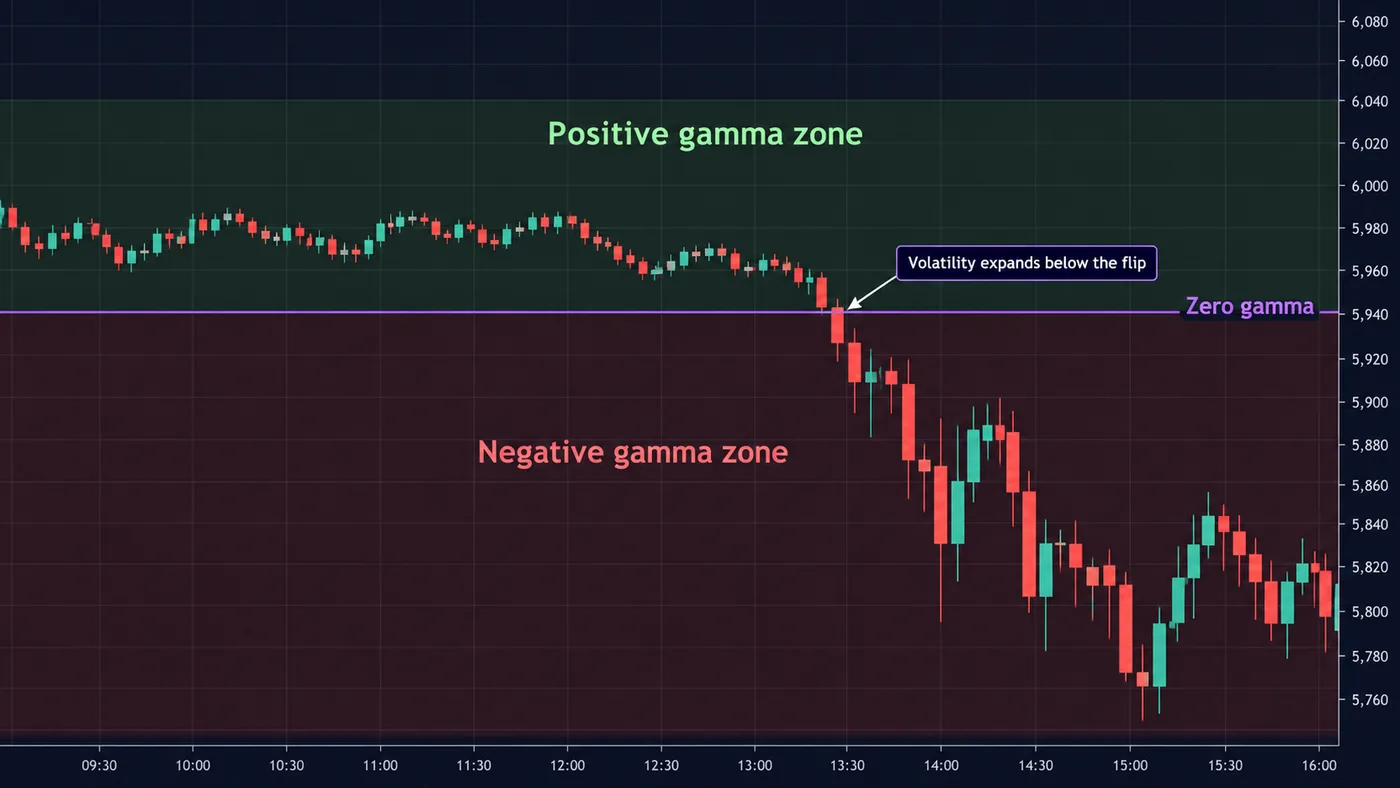
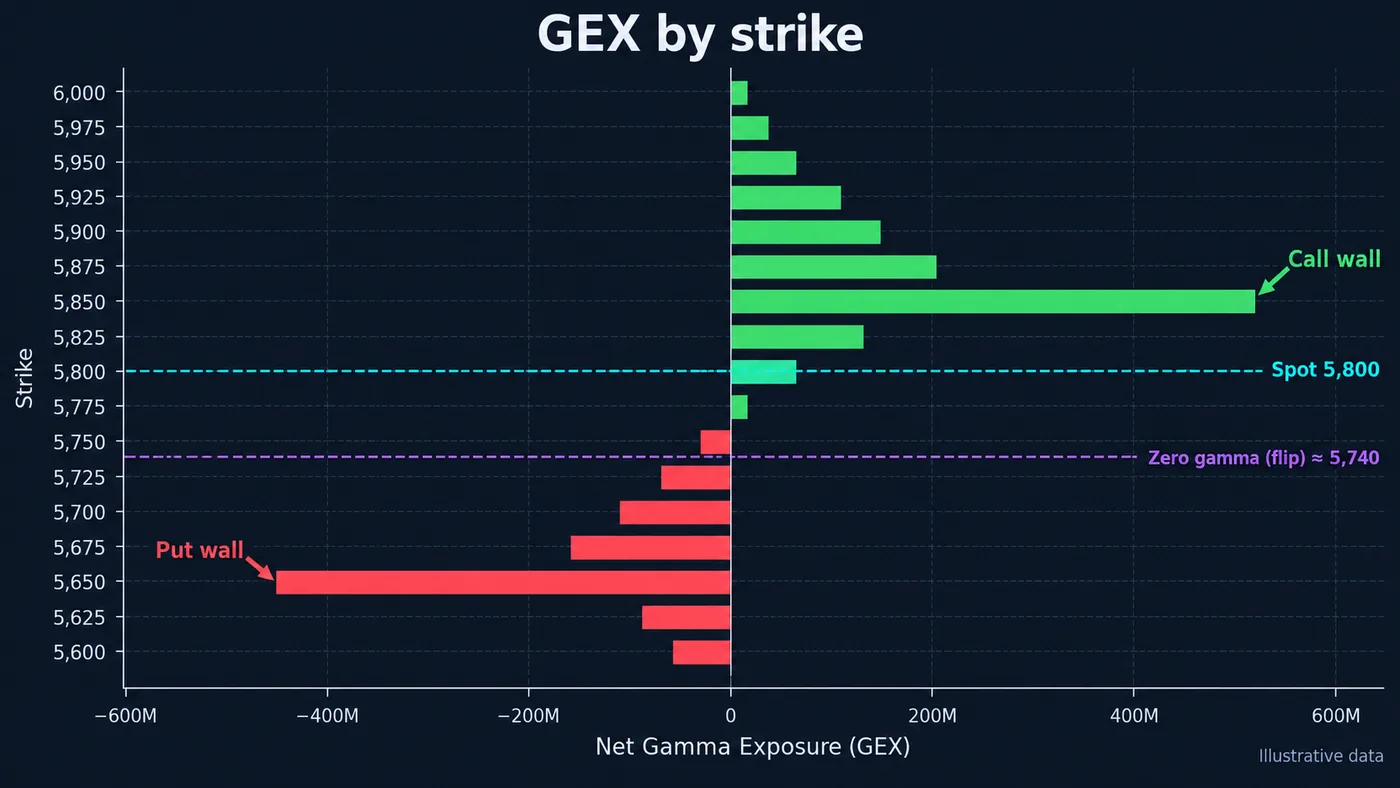
The zero-gamma level, or gamma flip, is the underlying price at which total GEX changes sign. It is found by recalculating every option's gamma at a range of hypothetical spot prices and finding where the total crosses zero — not by looking for the strike where net GEX is zero. Above the flip the market is in positive gamma; below it, negative.
Treat the flip as a regime line, not as support or resistance. Price can trade through it many times; what changes is the character of the tape. Traders use it to switch playbooks: fade extremes and expect ranges above it; respect breakouts and size down for wider swings below it. The flip moves every day as open interest, implied volatility and time to expiry change.
What are the call wall and the put wall?
The call wall is the strike with the largest call gamma, usually above spot; the put wall is the strike with the largest put gamma, usually below. Because hedging flows are heaviest around them, they often act as resistance and support in positive-gamma conditions and bound the expected range for the day or week. They are related to the open-interest walls in option chain analysis but weighted by gamma, so near-the-money, near-expiry strikes count more than large but distant ones.
Like any level from positioning, walls move. A call wall that rolls higher as price rises is being chased; a put wall that rolls lower in a decline is being given up. Read the change from day to day, not just the number. Max pain is a different measure — the strike where option buyers would lose the most at expiry — and is often near, but not the same as, the largest gamma strike.
- Get the chain. Strikes, open interest and implied volatility for the expiries that matter — for indices, the nearest weeklies and the monthly.
- Compute gamma per option. Black-Scholes gamma from spot, strike, IV and time to expiry.
- Convert to GEX. Γ × OI × 100 × S² × 0.01; calls positive, puts negative.
- Find walls and total. Largest call and put GEX strikes; sum for the total.
- Find the flip. Recalculate the total across a grid of spot prices and find the sign change.
How do traders use GEX?
| Situation | Typical reading | How traders adjust |
|---|---|---|
| Large positive GEX, spot well above flip | Range, pinning near large strikes | Fade extremes toward the walls; smaller targets |
| Spot near the flip | Regime can change quickly | Reduce size; wait for acceptance above or below |
| Negative GEX, spot below flip | Trend days and sharp moves more likely | Respect breakouts; wider stops, smaller size |
| Big expiry (monthly, quarterly) | Gamma rolls off; walls disappear | Expect a change in behaviour after expiry |
| Put wall test in negative gamma | Support can fail fast | Wait for absorption, not just the level |
GEX works best as context for another method: it tells you whether to expect ranges or trends, while your levels and entries come from structure, liquidity and order flow. The put-call ratio and open interest guides cover the related positioning data.
GEX calculator
Enter one expiry's strikes with call and put open interest, the spot price, implied volatility and days to expiry. The calculator computes Black-Scholes gamma for every strike, net GEX in dollars per 1% move, the call and put walls and the zero-gamma flip by recalculating the total across spot prices within ±15%. It uses one IV for all strikes and the standard dealer assumption, so treat it as a teaching model, not a live feed. The sample data is illustrative and shaped like an index weekly.
What are the limits of gamma exposure?
- Dealer positioning is assumed, not known. Investors also sell puts and buy calls; when they do, the sign at that strike is wrong and GEX overstates real hedging.
- Open interest is a day old. It updates once a day, while 0DTE options open and close within the session and never show in overnight OI.
- Gamma is only one Greek. Changes in implied volatility (vanna) and time (charm) also move dealer hedges, especially into expiry.
- Index-heavy. GEX is most meaningful for the S&P 500, Nasdaq-100 and the largest single stocks; in thin options markets the flows are too small to matter.
- Not directional. Positive GEX does not mean bullish; it means moves tend to be dampened. Use it for the kind of day, not the direction.
What mistakes do traders make with GEX?
- Treating the zero-gamma level as support or resistance instead of a regime line.
- Trading GEX alone, without a price level and a trigger.
- Ignoring expiry: walls and the flip can disappear when large expiries roll off.
- Comparing GEX from different providers as if they used the same assumptions and data.
- Using last week's levels: GEX changes every day with OI, IV and time.
Reference data
| Item | Value |
|---|---|
| Unit | Dollars of hedging per 1% move in the underlying |
| Contract multiplier | 100 for US equity and index options |
| Sign convention | Calls positive, puts negative (dealers long calls, short puts) |
| Popularised by | SqueezeMetrics, "Gamma Exposure (GEX)" white paper (2016, revised 2017) |
| Positive GEX | Hedging against the move; volatility tends to be dampened |
| Negative GEX | Hedging with the move; volatility tends to expand |
| Zero gamma | Spot price where total GEX changes sign |
How does GEX fit with Quantum Algo's indicators?
GEX tells you which regime the index is in; it does not give entries. Pair it with levels you can see on the chart. The free Quantum Algo indicators mark liquidity, structure and key levels on TradingView, and Zeno, the premium engine, prints its own buy and sell signals with an entry, a stop and two targets on indices and futures — every call is on the public track record. In positive gamma, signals near the walls and back toward the middle of the range tend to fit the tape; in negative gamma, breakouts in the direction of the move do.
Gamma exposure estimates dealer hedging per 1% move from options gamma and open interest. Positive GEX tends to dampen volatility, negative GEX to amplify it, and the zero-gamma flip separates the two. Use it to judge the kind of day to expect, combine it with price levels for entries, and remember that it rests on an assumption about dealer positioning.
◆ Interactive check
Do you understand gamma exposure?
Questions traders ask about gamma exposure
An estimate of how much options dealers must buy or sell in the underlying to stay delta-hedged for each 1% move, calculated from gamma and open interest at every strike.
For each strike: gamma × open interest × 100 × spot² × 0.01, with calls positive and puts negative. Sum across strikes and expiries for the total.
Dealers are net long gamma, so they sell into rallies and buy into dips. That tends to dampen moves and lower realized volatility.
Dealers are net short gamma, so they sell into declines and buy into rallies. That tends to amplify moves and raise realized volatility.
The underlying price where total GEX changes sign, found by recalculating GEX across hypothetical spot prices. It separates the positive and negative gamma regimes.
The strikes with the largest call gamma and the largest put gamma. They often act as resistance and support and bound the expected range, especially in positive gamma.
Neither. GEX describes volatility conditions, not direction: positive GEX means moves tend to be absorbed, negative GEX that they tend to extend.
SqueezeMetrics popularised GEX in its white paper "Gamma Exposure (GEX)", dated 2016 and revised in 2017.
For the largest, most actively traded options names it can. In thin options markets the hedging flows are too small relative to stock volume to matter.
They use different assumptions about dealer positioning, different expiries and different ways of computing the flip, and some adjust for intraday 0DTE flows.
References & Related Guides
Read next
- Option Chain Analysis
- Max Pain
- Put-Call Ratio
- Open Interest Explained
- Options Trading for Beginners
- Day Trading Options
- Best Indicator for S&P 500
- SPY vs QQQ
- Liquidity Trading
- Order Flow Trading
- Free TradingView indicators
- Zeno — the premium engine