Max Pain in Options: How It Is Calculated, Why Price Can Pin to It and Where the Theory Fails
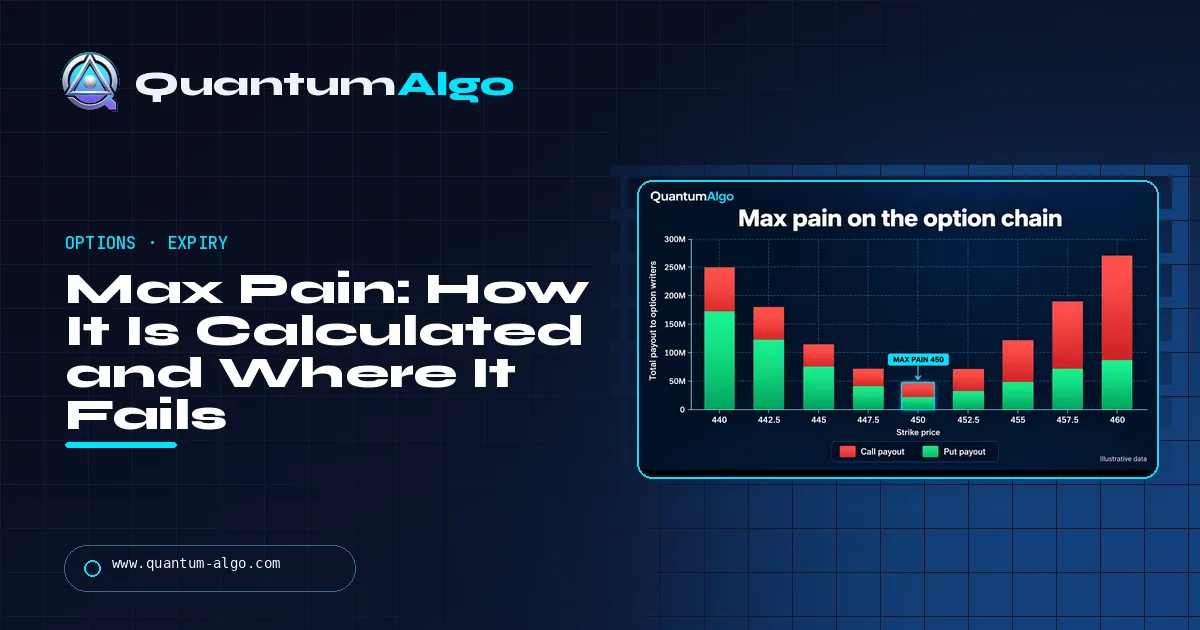
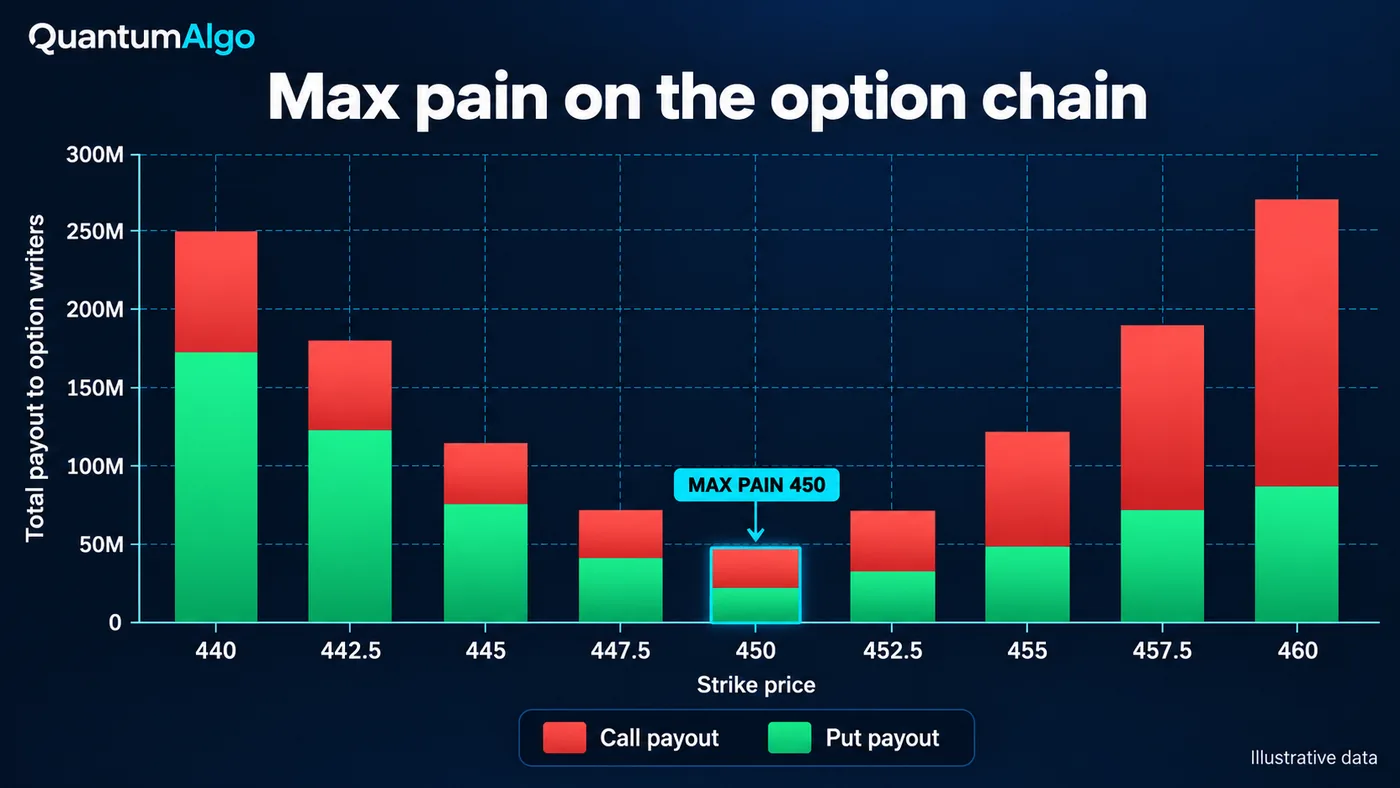
Max pain is the strike at which all open options for one expiry would pay their holders the least if price settled there. To find it, test each strike: add what the calls below and puts above would be worth, weighted by open interest, and take the lowest total. Research finds weak pinning near expiry, mainly in single stocks.
Every expiry week someone posts a max pain number as if it were a price target. It is not — but it is not useless either. Max pain is a precise calculation from open interest, it points at the strike where option writers lose least, and there is real academic evidence that stock prices cluster at strikes on expiration day. The trouble is that the effect is small, conditional and weakest in the index products most people trade. This guide covers what max pain is, the calculation step by step with a worked table, why price can pin, what the research actually found, when the number matters and when it is noise, how SPY, single stocks and Nifty differ, the limitations, how it compares with the put-call ratio and gamma exposure, and a calculator you can paste an option chain into.
Indicators that prove themselves in public.
One engine, four precision tools — the Gold (XAU) Scalper, the institutional Gravity Zone, the Zeno momentum Oscillator, and Zeno Stocks for equities.



What is max pain in options?
Max pain — also called maximum pain or the max pain price — is the strike at which the open options for one expiration date would be worth the least to their holders if the underlying settled exactly there. Option buyers would lose the most money at that price and option writers would pay out the least, hence the name. It is calculated from open interest alone, so every options market that publishes open interest by strike has a max pain number for every expiry: single stocks, the SPY and QQQ ETFs, the S&P 500 index, and in India the Nifty 50, Bank Nifty and individual F&O stocks.
The idea is a practitioner concept with no single named originator. Its claim is that, as expiration approaches, the underlying tends to drift toward the max pain strike. The usual story is that option writers — often pictured as market makers — benefit when options expire worthless and have the means to nudge price there. The more defensible version, covered below, is about hedging flows rather than intent, and the research supports a weaker effect than the folklore. Max pain is a useful map of where open interest is concentrated; it is not a price target.
How is max pain calculated?
- Pick one expiry. Max pain is per expiration date. Weekly and monthly expiries on the same underlying have different max pain values.
- List every strike with its call and put open interest. Open interest is the number of contracts still open, published once a day after the session.
- Treat each strike as a possible settlement price P. For each P, work out what every option would be worth at expiration.
- Add the call value. For every call strike K below P: call OI × (P − K). Calls at or above P are worth nothing.
- Add the put value. For every put strike K above P: put OI × (K − P). Puts at or below P are worth nothing.
- Pick the lowest total. The strike with the smallest combined payout is max pain.
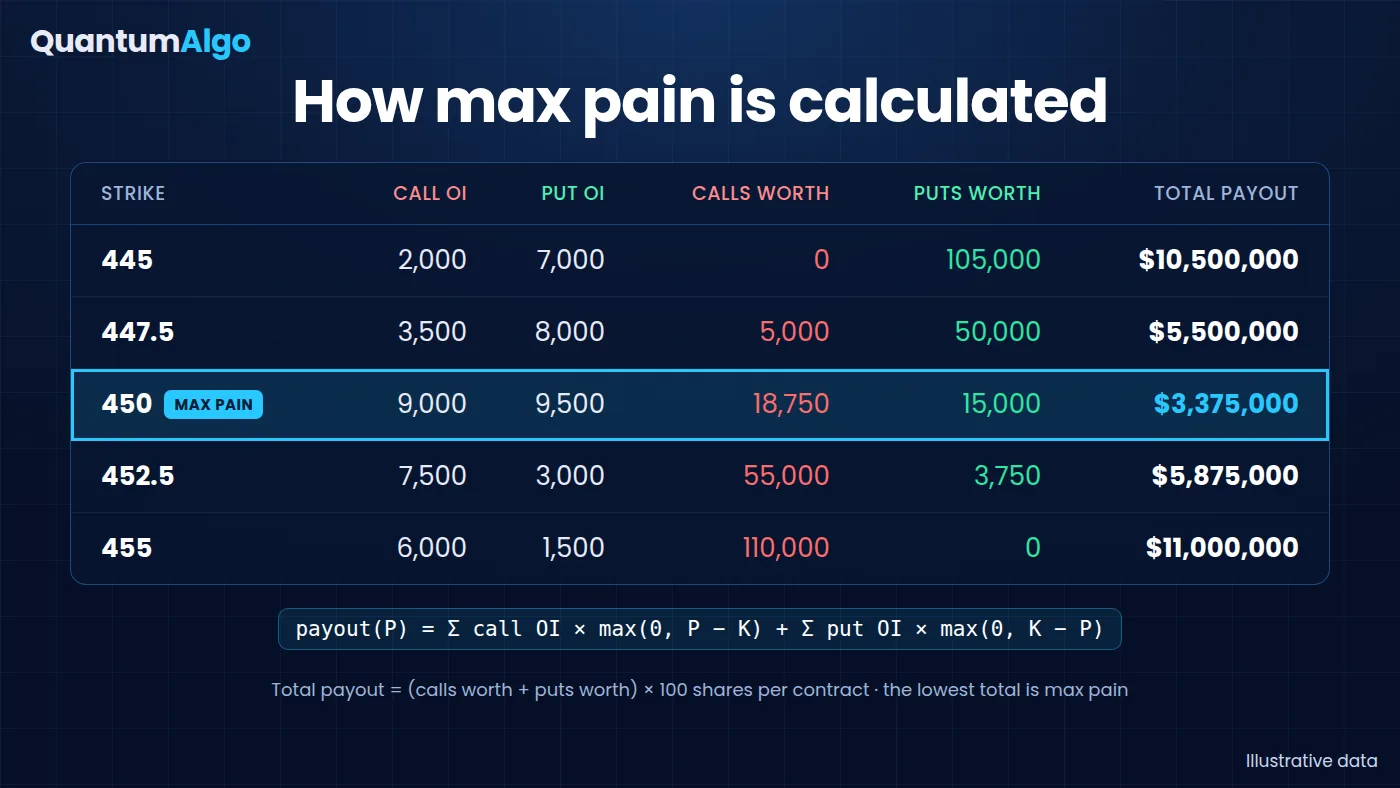
As a formula: payout(P) = Σ call OI × max(0, P − K) + Σ put OI × max(0, K − P), and max pain is the P that minimises it. US equity options cover 100 shares, so the dollar payout is the total × 100, but the multiplier is the same at every strike — it changes the size of the number, not which strike wins. The worked table below uses five strikes to show the arithmetic:
| Strike | Call OI | Put OI | Calls worth at this price | Puts worth at this price | Total (× 100 = $) |
|---|---|---|---|---|---|
| 445 | 2,000 | 7,000 | 0 | 105,000 | 105,000 ($10.5M) |
| 447.5 | 3,500 | 8,000 | 5,000 | 50,000 | 55,000 ($5.5M) |
| 450 | 9,000 | 9,500 | 18,750 | 15,000 | 33,750 ($3.375M) — max pain |
| 452.5 | 7,500 | 3,000 | 55,000 | 3,750 | 58,750 ($5.875M) |
| 455 | 6,000 | 1,500 | 110,000 | 0 | 110,000 ($11.0M) |
Two practical details matter. First, open interest is reported with a lag: the Options Clearing Corporation publishes it the morning after each session and it does not change intraday, so the max pain you see during the day is based on yesterday's positions. Second, options bought and sold within the same session — including much of today's same-day-expiry (0DTE) volume — never appear in open interest at all.
Why would price gravitate toward max pain?
The popular explanation is intent: writers who are short a lot of options at a strike push price toward it so the options expire worthless. Ni, Pearson and Poteshman did find some evidence of manipulation by firm proprietary traders around expiration, but intent cannot be seen in public data, and the explanation researchers lean on most is mechanical. Market makers hedge their option positions with the underlying. When they are net long options (long gamma) near a heavily traded strike, their hedging sells into rises and buys into dips — exactly the behaviour that holds price near the strike into expiration. Avellaneda and Lipkin modelled this "pinning" in 2003 and showed it needs unusually large open interest and dealers who are net long that strike.
The same mechanism runs in reverse. When dealers are net short options (short gamma), hedging buys into rises and sells into dips, which pushes price away from the strike and amplifies moves. Public open interest does not say which side dealers are on, which is the core problem with max pain as a forecast: the number is identical in both cases, but the behaviour it implies is opposite.
What does the research say about pinning?
| Study | What it tested | Finding |
|---|---|---|
| Ni, Pearson & Poteshman (2005), Journal of Financial Economics | US stocks with listed options, 1996–2002 | Closing prices cluster at strikes on expiration dates; returns altered by at least 16.5 basis points per expiry, about $9 billion of market value. Stronger when hedgers are net long options. |
| Avellaneda & Lipkin (2003), Quantitative Finance | A model of delta-hedging by long-gamma market makers | Pinning is possible when open interest is unusually large; pinning probabilities of roughly 10–30% under their assumptions. |
| Golez & Jackwerth (2012), Journal of Financial Economics | S&P 500 futures around futures-option and index-option expiries, 1992–2009 | Futures are pulled toward strikes when the serial options on S&P 500 futures expire, and pushed away just before quarterly index-option expiries. |
| Zhang, Chen & Cai (working paper) | 93 US stocks, monthly vs weekly expiries, 2010–2012 | Pinning on about 10% of monthly expiries vs 6.9% of weekly expiries; weekly pinning weaker. |
| Filippou, Garcia-Ares & Zapatero, SSRN working paper ("No Max Pain, No Max Gain") | Sorting stocks by distance to max pain, 1996–2021 | Predictable returns into expiration, which the authors attribute largely to reversals in stocks that had recently fallen hard rather than to a pull toward max pain itself. |
Read together, the evidence says three things. Pinning is real but small and conditional — it shows up as clustering around strikes, not as a reliable pull from far away. It is strongest where options are a big part of trading relative to the stock, which means smaller and less liquid names. And the evidence is thinnest and most mixed exactly where most traders look for it: index products and the largest ETFs, where deep, two-sided liquidity dilutes any single strike — Golez and Jackwerth did find pinning in S&P 500 futures, but only around particular expiries. A Cboe analysis of S&P 500 same-day options in 2023 found net market-maker gamma was a fraction of a percent of futures liquidity because customer buying and selling largely offset — little room for a pin.

Automate your trades. Let Quantum Algo trade for you.
Every signal executed on your own account — on your account, with the plan you define.
When is max pain useful, and when is it noise?
| More meaningful | Less meaningful |
|---|---|
| The last one or two sessions before expiry | Days or weeks before expiry — open interest is still changing |
| Open interest heavily concentrated at one or two strikes | A flat payout curve where the next strike costs less than about 10% more |
| Single stocks and smaller underlyings with active options | The S&P 500, SPY, QQQ and other very deep markets |
| Quiet weeks with no scheduled catalyst | Earnings, CPI, central-bank decisions or index events on expiry day |
| Price already trading near the max pain strike | Price far from max pain with momentum behind it |
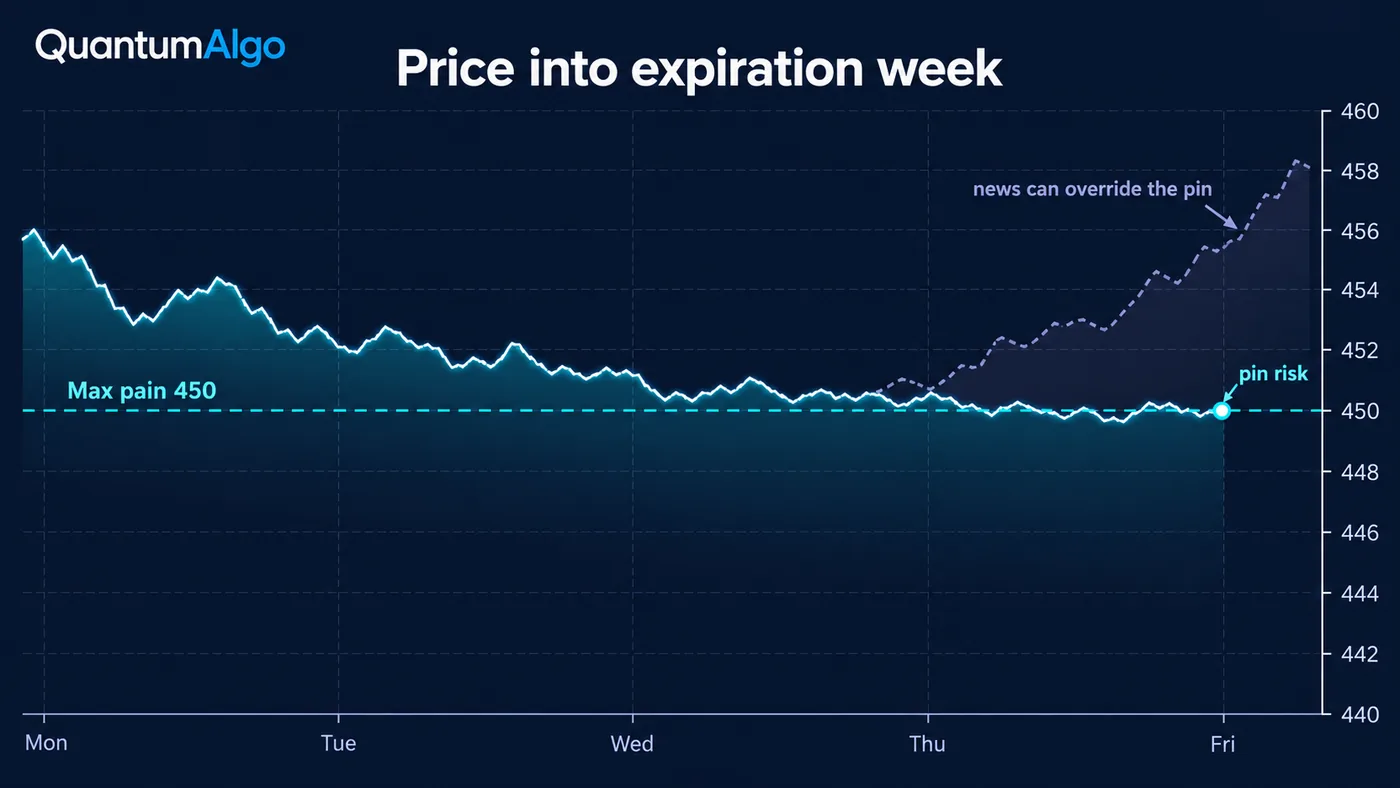
A useful mental model: max pain describes where the expiring options are, not where price must go. When the curve has a deep, narrow bottom, price is near it, the week is quiet and dealers are likely long gamma, the strike can act like a soft magnet in the final session. When any of those conditions is missing, it is just a number.
How do traders use max pain?
- Check it in expiry week, not before. Look on the morning of the last two or three sessions, after the overnight open-interest update.
- Read the shape, not just the strike. A deep, narrow bottom matters more than a flat one. Note where the largest call and put open interest sit — they often act as walls.
- Compare it with price. A strike within about 1% of price is a candidate pin; one several percent away is unlikely to be reached on the back of pinning alone.
- Check the calendar. A scheduled catalyst on expiry day overrides the pull.
- Use it as context for options, not a signal for direction. Option sellers use it to choose strikes; directional traders use it as one input on whether a breakout is likely to stall into the close.
- Confirm with price and structure. Let the chart decide. A break of structure away from max pain outranks the theory.
How does max pain work for SPY, single stocks and Nifty?
| Market | Expiries | Notes |
|---|---|---|
| US single stocks | Monthly on the third Friday; weeklies on many large names | Where the pinning research finds the clearest effects, especially near heavy open-interest strikes |
| SPY and QQQ | Every weekday (Tuesday and Thursday expiries added in November 2022) | Very deep, two-sided markets; max pain is a weak signal |
| S&P 500 index (SPX) | Every weekday; cash-settled | Same-day options dominate volume and never appear in open interest |
| Nifty 50 | Weekly on Tuesday (since 1 September 2025); monthly on the last Tuesday | Max pain is widely watched on expiry day; check the chain the morning of expiry |
| Bank Nifty and other NSE indices | Monthly only — exchanges may list one weekly benchmark each since November 2024 | Monthly max pain; less useful early in the month |
| NSE single-stock F&O | Monthly | Large open interest at round strikes can produce visible clustering |
Most traders read max pain from a chain tool rather than calculating it: Barchart, OptionCharts and maximum-pain.com for US underlyings, and NSE option-chain tools such as Sensibull or NiftyTrader for the Indian indices. They all update once a day from the overnight open interest. For reading the chain itself — open interest changes, the put-call ratio and where the big walls sit — see the put-call ratio guide and open interest explained.
Max pain calculator
Paste one strike per line with its call and put open interest for a single expiry, optionally add the current price and the contract multiplier. The calculator finds max pain, the three cheapest strikes, how far price is from max pain, the put-call ratio by open interest, and whether the payout curve is flat near the bottom.
Reference data
| Item | Value |
|---|---|
| Also called | Maximum pain, max pain price, option pain |
| Definition | The strike at which open calls and puts for one expiry would have the lowest total value at expiration |
| Formula | Minimise Σ call OI × max(0, P − K) + Σ put OI × max(0, K − P) over candidate prices P |
| Data needed | Open interest by strike for one expiry |
| Data timing | Open interest is published once a day, the morning after the session; it does not change intraday |
| Strongest evidence | Clustering of closes at strikes on expiration dates in US stocks (Ni, Pearson & Poteshman 2005) |
| Evidence thinnest | Index options and the deepest ETFs (SPX, SPY, QQQ) — mixed results |
| US expiries | Monthly third Friday; SPX, SPY and QQQ have expiries every weekday |
| Nifty expiries | Weekly and monthly on Tuesday (from 1 September 2025) |
| Checked | October 2026 |
Worked example: reading max pain into a Friday expiry
An illustrative stock trading at 452 on the Tuesday of a monthly expiry week, with the five strikes from the table above. Max pain is 450: the payout there is $3.4 million, against $5.5 million at 447.5 and $5.9 million at 452.5. The curve has a clear bottom — the next-cheapest strike costs more than 60% more — and the two biggest open-interest strikes are 450 on both sides. The put-call ratio by open interest is 1.04, so neither side dominates.
On Wednesday price drifts to 451. On Thursday morning the open interest update shows 450 calls and puts both increasing, and there is no earnings date or macro release on Friday. That is the textbook set-up for a pin: a deep curve, price within half a percent, heavy open interest at the strike and no catalyst. A trader who is long from 446 might take profit into 450–452 rather than hold for a breakout through 455, and an options seller might prefer strikes outside the 447.5–452.5 range. What the trader does not do is short the stock because it is "above max pain". If a broad market sell-off hits on Friday, the hedging that would have pinned price can flip and speed the move instead.
What are the limitations of max pain?
- Open interest does not show who is long or short. Customers can be the option writers and dealers the buyers, which reverses the hedging logic.
- It is a snapshot of yesterday. Open interest updates overnight, and same-day trades never appear in it.
- Many curves are flat. When several strikes produce nearly the same payout, "max pain" is a range, not a price.
- The evidence is thinnest in the markets people watch most — SPX, SPY and QQQ — where liquidity is deep and two-sided.
- Catalysts override it. Earnings, macro data and market-wide moves on expiry day dominate any pin.
- Folklore overstates it. The often-repeated claim that 90% of options expire worthless is wrong; CBOE data cited by the options author Lawrence McMillan puts the share at about 30%, with most options closed or exercised before or at expiry.
- It changes every day. A max pain read on Monday can be several strikes away by Thursday.
How does max pain compare with the put-call ratio and gamma exposure?
| Measure | What it uses | What it tells you | Main blind spot |
|---|---|---|---|
| Max pain | Open interest by strike for one expiry | The strike where expiring options pay least | Ignores who holds which side |
| Put-call ratio (OI) | Total put OI ÷ total call OI | Positioning and sentiment, often read contrarian at extremes | A single number with no strike detail |
| Gamma exposure (GEX) | Open interest × each option's gamma, with an assumed dealer side | Whether dealer hedging is likely to damp or amplify moves | Relies on a convention for which side dealers hold |
| Pin risk | Price near a strike at expiry | Uncertainty for writers about whether they will be assigned | A risk concept, not a forecast |
The three measures answer different questions, and the useful reads combine them: max pain says where the expiring options are concentrated, the put-call ratio says which side is crowded, and gamma exposure says whether hedging is likely to hold price in place or push it. For a broader options toolkit see the best indicators for options trading and the options trading for beginners guide.
How does max pain fit with structure and the free indicators?
Max pain is information about options positioning, so it works best as context for a chart, not as the chart itself. The Institutional Key Levels script plots the previous day's and week's highs and lows that often coincide with heavy open-interest strikes, the Liquidity Sweeps script shows when price runs those levels and snaps back, and the Smart Money Concepts Engine prints the break of structure that tells you a pin has failed. Zeno, the premium engine, prints buy and sell signals with a stop and targets; in expiry week, a target that sits beyond a deep max pain strike is the one most likely to stall. For the mechanics of the chain, start with open interest and the put-call ratio.
Max pain is the strike where expiring options pay least, calculated from open interest. Pinning toward strikes is documented — mainly in single stocks, in the final sessions, when open interest is concentrated and dealers are long gamma — but it is small, and the evidence for index products is mixed. Read the shape of the payout curve, check the calendar, treat it as context for expiry week, and let price and structure make the decision.
◆ Interactive check
Can you read max pain correctly?
Questions traders ask about max pain
Max pain is the strike price at which the open options for one expiration date would be worth the least to their holders if the underlying settled there — the price that causes option buyers the most loss and writers the least payout.
For each strike treated as a possible settlement price, add call open interest × (price − strike) for every call below it and put open interest × (strike − price) for every put above it. The strike with the lowest total is max pain.
Partly. Academic studies find that stock prices cluster at option strikes on expiration dates, mainly in single stocks and when dealers are net long options. The effect is small, and the evidence for index products such as SPX, SPY and QQQ is mixed, so max pain is context rather than a forecast.
The credible mechanism is hedging: market makers who are net long options near a heavily traded strike sell into rises and buy into dips, which holds price near the strike into expiration. When they are net short options, hedging pushes price away instead.
In the last two or three sessions before expiration, after the overnight open-interest update. Earlier in the cycle open interest is still changing and the number moves around.
It is widely watched on expiry day. Nifty weekly and monthly options expire on Tuesday (since 1 September 2025); Bank Nifty has monthly expiries only. Use it with the option chain, open-interest changes and price structure.
No. Max pain is a strike calculated from open interest at every strike; the put-call ratio is a single number comparing total put and call open interest or volume. They answer different questions and work best together.
Sites update at different times, use different expiries, and some include or exclude strikes with little open interest. Check that the expiry date and update time match before comparing.
No. At best it marks a strike that can act as a soft magnet in the final session under the right conditions. News, macro data and market-wide moves override it.
Max pain is options-positioning context; Quantum Algo's free indicators handle the price side — key levels, liquidity sweeps and structure — and Zeno prints buy and sell signals with a stop and targets. In expiry week, max pain helps judge which targets may stall.
References & Related Guides
Read next
- Put-Call Ratio
- Open Interest Explained
- Options Trading for Beginners
- Best Indicators for Options Trading
- Day Trading Options
- Options Prop Firms
- UT Bot Settings for Nifty & Bank Nifty
- CPR Indicator
- COT Report
- Support and Resistance
- Institutional Key Levels (free indicator)
- Zeno — the premium engine
Primary sources
- Ni, Pearson & Poteshman — Stock price clustering on option expiration dates (JFE, 2005)
- Avellaneda & Lipkin — A market-induced mechanism for stock pinning (Quantitative Finance, 2003)
- Golez & Jackwerth — Pinning in the S&P 500 futures (JFE, 2012)
- Filippou, Garcia-Ares & Zapatero — max pain working paper (SSRN)
- Cboe — Evaluating the market impact of SPX 0DTE options
- OptionCharts — Max pain methodology