Option Chain Analysis: How to Read an Option Chain, Open Interest, PCR and Walls
Option chain analysis reads the table of all calls and puts for one expiry to see where traders are positioned. The largest call open interest above price marks resistance (the call wall), the largest put open interest below marks support (the put wall), and price combined with change in OI shows long buildup, short buildup, short covering or long unwinding. PCR, max pain and implied volatility add context; price action confirms.
Every option chain is a public record of where traders have put their money: which strikes they wrote, which they bought, and how that changed today. Read only for prices, it is a quote screen. Read for open interest, it is a map of support and resistance by positioning. This guide covers every column, the four readings of price and open interest, call and put walls, the put-call ratio, max pain and implied volatility — with a worked Nifty example and a reader you can paste a chain into.
Indicators that prove themselves in public.
One engine, four precision tools — the Gold (XAU) Scalper, the institutional Gravity Zone, the Zeno momentum Oscillator, and Zeno Stocks for equities.



What is an option chain?
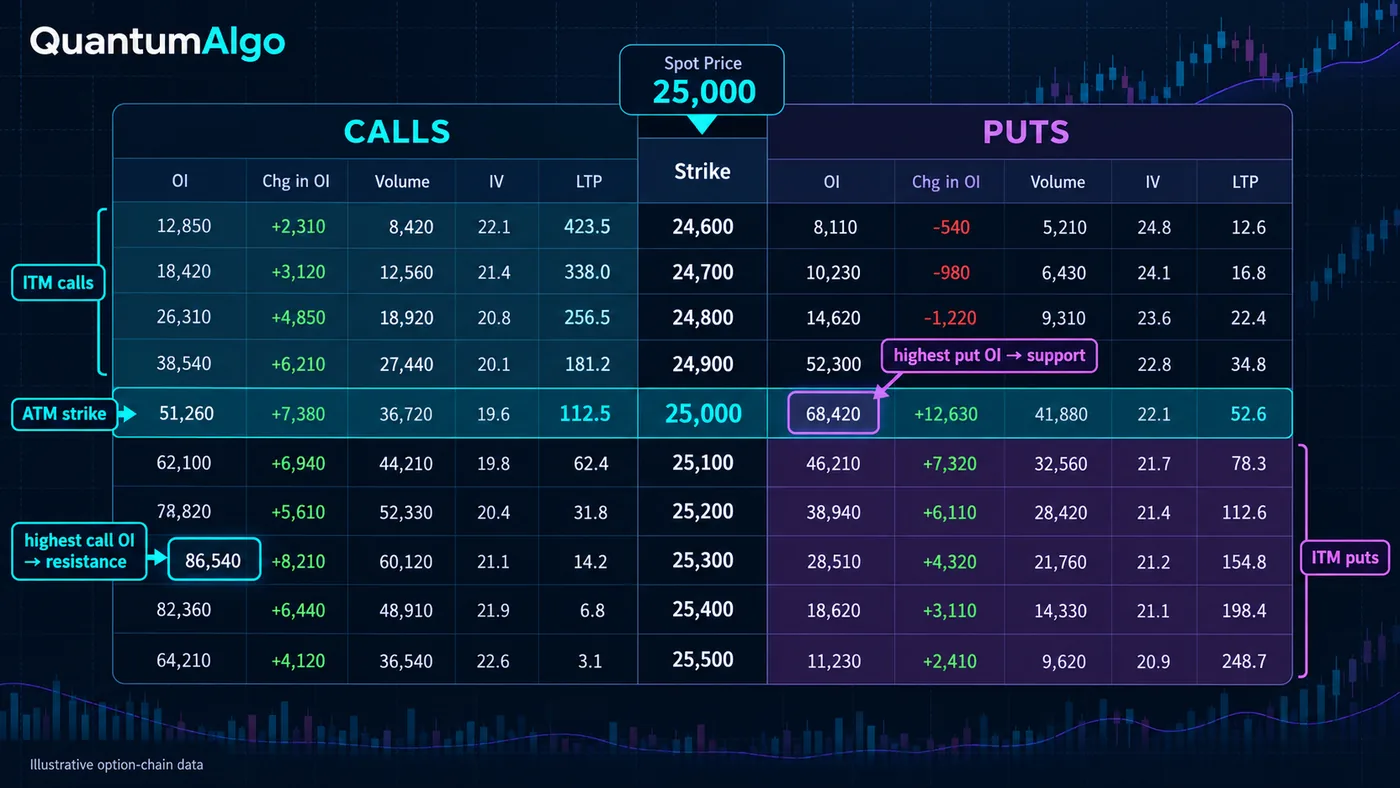
An option chain — also called an option matrix — is the table that lists every option contract available on one underlying for one expiration date: the calls on one side, the puts on the other and the strike prices in between. Each row is a strike; each side shows that strike's price, volume, open interest and usually implied volatility. Brokers, exchanges and data sites all publish one, and the layout is almost universal: calls on the left, puts on the right.
Option chain analysis is the practice of reading that table for more than prices. Because every row shows how many contracts are open and how many changed hands today, the chain is a record of where traders have positioned — which strikes option writers are short, where new positions are being added and where they are being closed. Traders in India read the NSE chain for Nifty and Bank Nifty every session; traders in the US read the SPY and SPX chains the same way. This guide covers the columns, the four price-and-OI readings, the put-call ratio, call and put walls, max pain and implied volatility — and the limits of each.
What do the columns in an option chain mean?
| Column | What it shows | How to use it |
|---|---|---|
| Strike | The price at which the option can be exercised | The row label; ATM is the strike nearest the current price |
| LTP / Last | The last traded premium | Compare with bid/ask — a stale last price misleads |
| Bid / Ask | Best price to sell / buy now | A wide spread means poor liquidity at that strike |
| Volume | Contracts traded today | Where today's activity is |
| OI (open interest) | Contracts still open — not yet closed, exercised or expired | Where positions have built up over time |
| Change in OI | How much OI rose or fell versus the previous session | Where positions are being added or closed today |
| IV | Implied volatility backed out of the premium | How expensive options are at that strike |
| Greeks (on some chains) | Delta, gamma, theta, vega | Sensitivity of the premium; delta ≈ probability proxy |
Two columns do most of the work in chain analysis: open interest and change in OI. Open interest counts contracts that are still open; every new contract needs a buyer and a writer, so a large OI at a strike means many writers are exposed there. The open interest guide covers the mechanics in depth; here the focus is reading it across strikes.
In-the-money (ITM) strikes are usually shaded: calls with strikes below the current price and puts with strikes above it. At-the-money (ATM) is the strike closest to the price, and out-of-the-money (OTM) strikes are the rest. Most OI and volume sits near the money and a few strikes out of it, which is where the analysis happens.
How do you read open interest by strike?
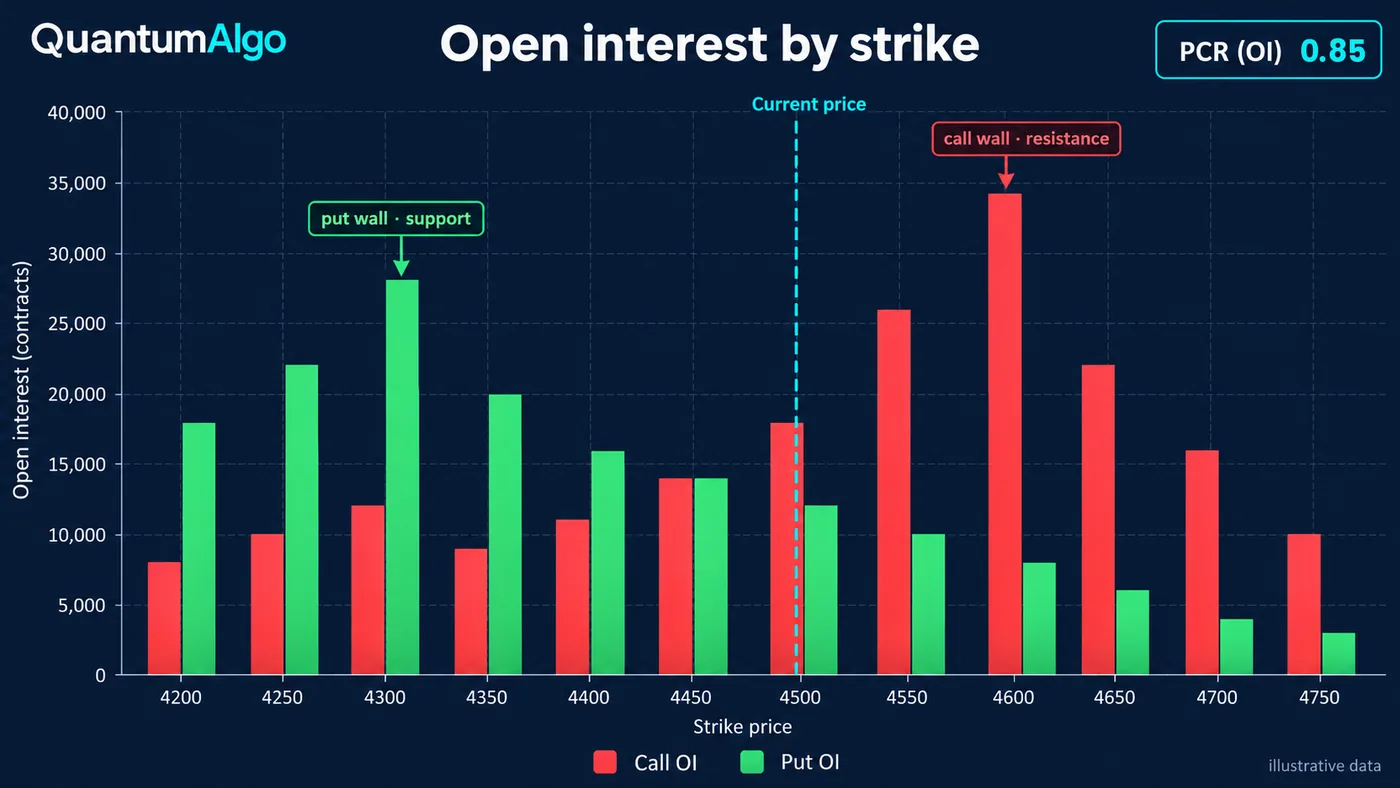
Plot call OI and put OI for every strike and the chain becomes a map. The strike with the largest call OI above the price is often called the call wall or resistance strike; the strike with the largest put OI below the price is the put wall or support strike. The logic: option writers are short those strikes, so they have the most to lose if price moves through them and — directly or through hedging — tend to defend them.
Treat walls as zones where positioning is heavy, not as lines price must respect. Three things change them during a session: price moving toward a wall (writers roll or close), new writing at a nearer strike (the wall moves) and expiry approaching (OI at far strikes becomes irrelevant). A wall that shifts lower day after day while price falls is telling you the support is being given up — read the shift, not just the level.
- Find the ATM strike. The strike nearest the futures or spot price is the centre of the table.
- Locate the largest call OI above it. That strike is the call wall — resistance by positioning.
- Locate the largest put OI below it. That strike is the put wall — support by positioning.
- Check the second-largest strikes. If they sit close to the walls, the zone is wider; if they are far away, the wall is concentrated.
- Watch the walls move. Compare with the previous session. Walls that move with price show positioning following the trend.
What do price and change in OI tell you together?
| Price | Open interest | Reading | What it means |
|---|---|---|---|
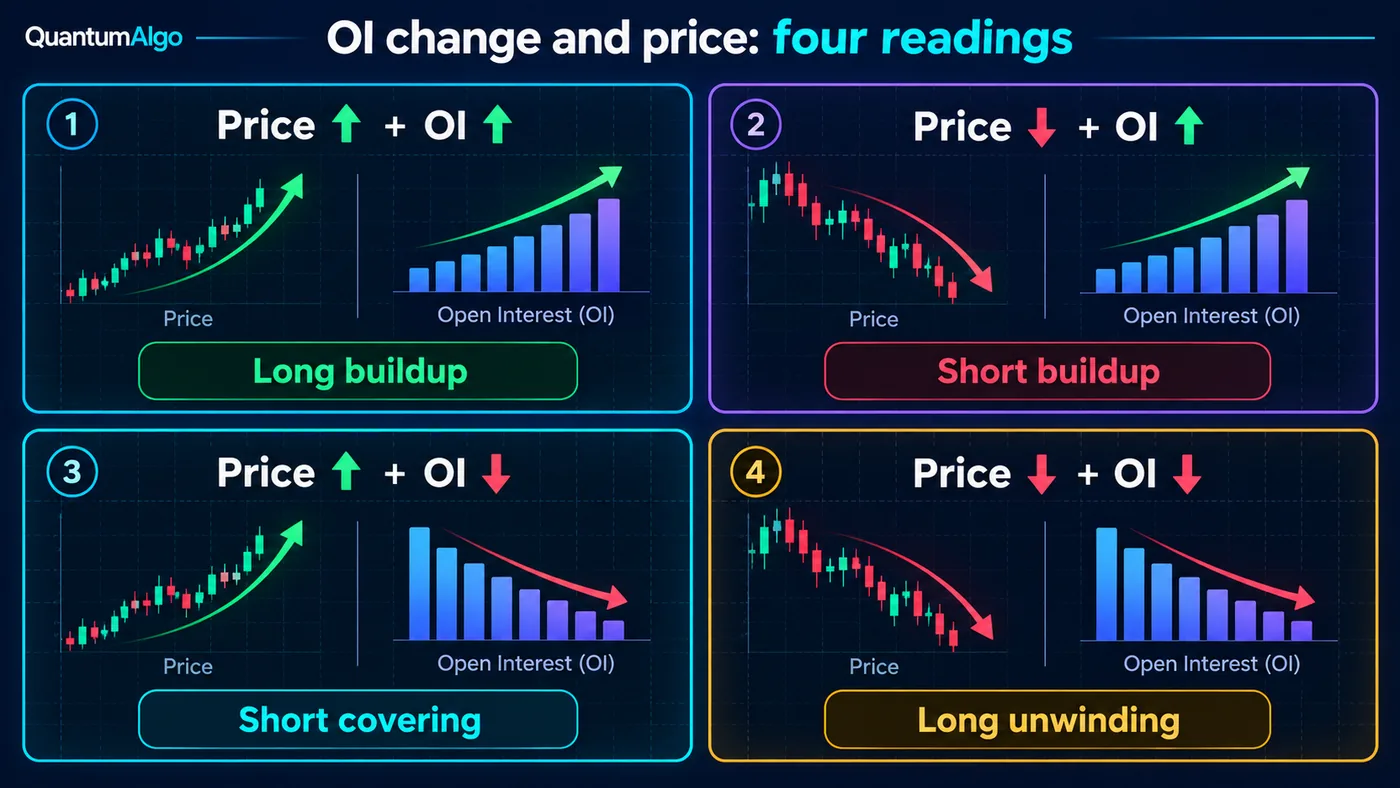
| Up | Up | Long buildup | New long positions are driving the move |
| Down | Up | Short buildup | New short positions are driving the move |
| Up | Down | Short covering | Shorts are closing — the rise may lack fresh buying |
| Down | Down | Long unwinding | Longs are closing — the fall may lack fresh selling |
This table is the core of OI analysis in futures and works for options strike by strike. Rising OI means new contracts are being created; falling OI means existing ones are being closed. Combined with price direction, it tells you whether a move is backed by new money or by people leaving. Moves driven by new positions tend to be more durable than moves driven by covering, which can reverse once the covering is done.
For options the reading has one extra layer: a call writer and a call buyer both add to OI. Rising call OI at a strike above the price with falling premiums usually means writing — traders selling calls because they expect price to stay below. Rising call OI with rising premiums usually means buying. Reading premium and OI together separates the two.

Automate your trades. Let Quantum Algo trade for you.
Every signal executed on your own account — on your account, with the plan you define.
What is the put-call ratio in an option chain?
The put-call ratio (PCR) divides puts by calls — either total put OI by total call OI (OI PCR) or put volume by call volume (volume PCR). An OI PCR above 1 means more puts than calls are open; below 1, more calls. In India the OI PCR for Nifty is the version most traders quote; in the US Cboe publishes daily total, index and equity put-call ratios.
PCR is read two ways, and they point in opposite directions. As a positioning measure, a high PCR means many puts have been written, which traders read as support underneath. As a contrarian sentiment measure, a very high PCR means fear, which tends to mark lows; a very low PCR means complacency. Which reading applies depends on whether puts are being written or bought — the same change-in-OI and premium check as above. The put-call ratio guide covers both readings and their thresholds; in chain analysis, compare today's PCR with its own recent range rather than with a fixed number.
What are max pain and implied volatility on the chain?
Max pain is the strike at which the open options for one expiry would be worth the least to their holders at settlement — the strike where writers pay out the least. It is calculated from the same OI columns: for each strike, add up what every call below it and every put above it would be worth, and pick the lowest total. Some traders expect price to drift toward max pain into expiry; the evidence is weak and the pull, where it exists, is easily overridden by news. The max pain guide walks through the calculation and the research.
Implied volatility (IV) shows how expensive each strike is. Two patterns matter on a chain. Skew: on equity indices, out-of-the-money puts carry higher IV than equally distant calls, a pattern that has persisted since the 1987 crash because traders pay up for crash protection. IV changes: a strike whose IV rises while OI rises is being bought; one whose IV falls while OI rises is being written. Before events — results, central bank meetings, budgets — IV across the chain rises and then collapses after the event, which is why buying options into an event is often a losing trade even when the direction is right.
How do you do option chain analysis step by step?
- Pick the right expiry. The nearest weekly or monthly expiry carries the most OI and the most relevant positioning. On NSE, Nifty has weekly expiries on Tuesdays; Bank Nifty options are monthly only.
- Note the ATM strike and the price. Use the futures price for indices — the chain is priced off it.
- Mark the call wall and the put wall. Largest call OI above, largest put OI below.
- Read today's change in OI. Where were the most calls and puts written today? Fresh writing near the price matters more than old OI far away.
- Check PCR against its own range. Is it rising or falling, and is it high or low for this underlying?
- Check IV. Is the chain getting more or less expensive, and is the skew steepening?
- Confirm with price. The chain shows positioning; price structure shows whether that positioning is holding. Wait for a reaction at the wall before acting.
Option chain reader
Paste one expiry's strikes with call and put open interest — and, if you have them, today's change in OI — plus the current price. The reader returns the ATM strike, the call and put walls, the OI put-call ratio, max pain and the strikes where the most calls and puts were written today. The sample data is illustrative and shaped like a Nifty weekly chain.
Reference data
| Item | Value |
|---|---|
| Open interest | Contracts open: not closed, exercised or expired |
| US OI reporting | OCC reports open interest after end-of-day clearing — you see it the next session |
| OI PCR | Total put OI ÷ total call OI |
| Volume PCR | Total put volume ÷ total call volume |
| Long buildup / short buildup | Price ↑ OI ↑ / price ↓ OI ↑ |
| Short covering / long unwinding | Price ↑ OI ↓ / price ↓ OI ↓ |
| Nifty lot size (NSE, from 2026) | 65 (was 75) |
| Bank Nifty lot size (NSE, from 2026) | 30 (was 35) |
| Nifty expiry | Weekly on Tuesday; monthly on the last Tuesday |
| Bank Nifty options | Monthly only since November 2024 |
| SPX 0DTE share of SPX volume (2025) | About 59% (Cboe) |
| Index IV skew | OTM puts trade at higher IV than equidistant OTM calls |
Worked example: reading a Nifty weekly chain
Suppose Nifty futures trade at 25,040 on the Monday before a Tuesday expiry. The chain shows the largest call OI at 25,000 (1.65 lakh contracts) and 25,200 (1.58 lakh), and the largest put OI at 25,000 (1.41 lakh) and 24,800 (1.32 lakh). Today's change in OI shows heavy call writing at 25,100 (+31,000) and 25,200 (+26,000) and put writing at 24,700 (+21,000) and 24,800 (+18,000). The OI PCR is about 0.77 and max pain sits at 25,000.
The reading: writers expect the index to stay roughly between 24,800 and 25,200 into expiry, and today they added calls just above the price and puts well below it — a slightly bearish tilt to the positioning. A trader would treat 25,100–25,200 as resistance (the call wall above price is 25,200) and 24,800–25,000 as support (the put wall below price is 25,000), and would not act on the levels alone: a break above 25,200 with call OI falling there (writers covering) would invalidate the range, while a rejection from 25,100–25,200 with call OI still rising would confirm it. That is the reader's sample data — paste your own chain to repeat the exercise.
What mistakes do traders make with option chain analysis?
- Reading OI as direction. OI says positions are open, not which side wins. Every contract has a buyer and a writer.
- Ignoring who is writing. Rising OI with falling premium is writing; with rising premium it is buying. Without the premium check the reading can flip.
- Treating walls as fixed. Walls move as writers roll. Yesterday's call wall is not today's.
- Using far-out strikes. Deep OTM OI is often hedges or lottery tickets. Focus near the money.
- Over-trusting intraday OI. In the US, OI updates once a day. On NSE intraday OI is shown, but many traders — including Zerodha's Nithin Kamath — caution against trading off its every tick.
- Fixed PCR thresholds. A PCR of 1.3 can be normal for one underlying and extreme for another. Compare with its own history.
- Forgetting the calendar. OI near expiry, around events and at monthly rollovers behaves differently from mid-cycle OI.
How does option chain analysis fit with price structure?
The chain tells you where positioning is; price tells you whether it is holding. The most useful combination is to mark the call and put walls as zones on the chart and then watch how price behaves at them — a sweep of the zone followed by a reclaim, a clean break with OI falling at the wall, or a stall. Structure tools do that part: support and resistance, market structure shifts and liquidity sweeps show whether the level that the chain identifies is being respected.
On TradingView the free Quantum Algo indicators mark liquidity, structure and key levels, and Zeno — the premium engine — prints its own buy and sell signals with an entry, a stop and two targets on the underlying. Options traders typically use the chain for the levels and the expiry context, and a signal on the underlying chart for timing. The best indicator for options trading guide covers that workflow, and the public track record lists every call.
An option chain shows where traders are positioned for one expiry. Mark the call wall and the put wall, read today's change in OI against price to see who is opening and who is closing, compare PCR with its own range and watch IV for cost. None of it predicts direction on its own: the chain gives the levels, price structure gives the confirmation.
◆ Interactive check
Can you read an option chain?
Questions traders ask about option chain analysis
Reading the table of all calls and puts for one underlying and expiry — especially open interest, change in OI, volume and implied volatility — to see where traders are positioned and where support and resistance by positioning sit.
Find the at-the-money strike, mark the strike with the largest call open interest above price (resistance) and the largest put open interest below price (support), read today's change in OI to see where positions were added, check the put-call ratio and implied volatility, then confirm with price action.
Open interest and change in OI. Open interest shows where positions have built up; change in OI shows where they were added or closed today. Volume and premium tell you whether the new OI is buying or writing.
The call wall is the strike with the largest call open interest above the price; the put wall is the strike with the largest put open interest below it. Option writers are most exposed there, so the strikes act as resistance and support by positioning — zones, not guarantees.
Price and open interest both rising: new long positions are driving the move. Short buildup is price falling with OI rising; short covering is price rising with OI falling; long unwinding is price falling with OI falling.
There is no universal number. Compare an underlying's PCR with its own recent range. A high OI PCR can mean heavy put writing (support) or fear (a contrarian bottom signal), depending on whether puts are being written or bought.
Yes — it is one of the most widely used tools for Indian index options. Nifty has weekly expiries on Tuesdays and Bank Nifty options are monthly only, so focus on the nearest expiry with meaningful open interest.
In the US, OCC reports open interest once a day after clearing. NSE shows intraday OI on its chain, but many traders caution against trading every tick of it — the end-of-day picture is more reliable.
The strike at which the open options for one expiry would be worth the least at settlement. Some traders expect price to drift toward it into expiry; the evidence is weak and news easily overrides it.
No. It shows where traders are positioned, not what price will do. Use it for levels and context, and price structure or a signal on the underlying for timing.
References & Related Guides
Read next
- Open Interest Explained
- Put-Call Ratio
- Max Pain
- Options Trading for Beginners
- Day Trading Options
- Best Indicator for Options Trading
- CPR Indicator
- Gann Square of 9
- UT Bot Settings for Nifty & Bank Nifty
- Support and Resistance
- Free TradingView indicators
- Zeno — the premium engine
Primary sources
- Zerodha Varsity — Open Interest
- Zerodha Z-Connect — Open interest, max pain and put-call ratio
- Options Industry Council — General FAQ (open interest reporting)
- Cboe — Daily market statistics (put/call ratios)
- NSE circular FAOP70616 — revision of index derivatives lot sizes (Oct 2025)
- Cboe — trading volume for December and full-year 2025
- Options Industry Council — Understanding volatility and options skew