Multi-Oscillator Divergence Scanner [Quantum Algo]
Seven independent oscillators scanned at every confirmed swing, a divergence printed only when several agree, graded by how many, drawn on the candles and mirrored on a consensus pane — with the exact engines named on every label and a reaction zone that tells you when the signal has failed.
The short answer
The Multi-Oscillator Divergence Scanner is a free, open-source TradingView indicator that scans up to seven classic oscillators simultaneously — RSI, MACD, Stochastic, CCI, On Balance Volume, Money Flow Index and Momentum — and displays the result on two synchronised canvases: divergence lines, graded labels and reaction zones on the price chart, and a Composite Oscillator built from every enabled engine in a pane below, with the same divergence lines mirrored onto the composite. You see both slopes of every divergence — price disagreeing with momentum — in one glance. The problem it solves is selective divergence trading: any single oscillator produces frequent divergences and most fail; requiring several mathematically independent engines to diverge at the same confirmed swing filters the noise to setups where the disagreement is broad, not incidental.
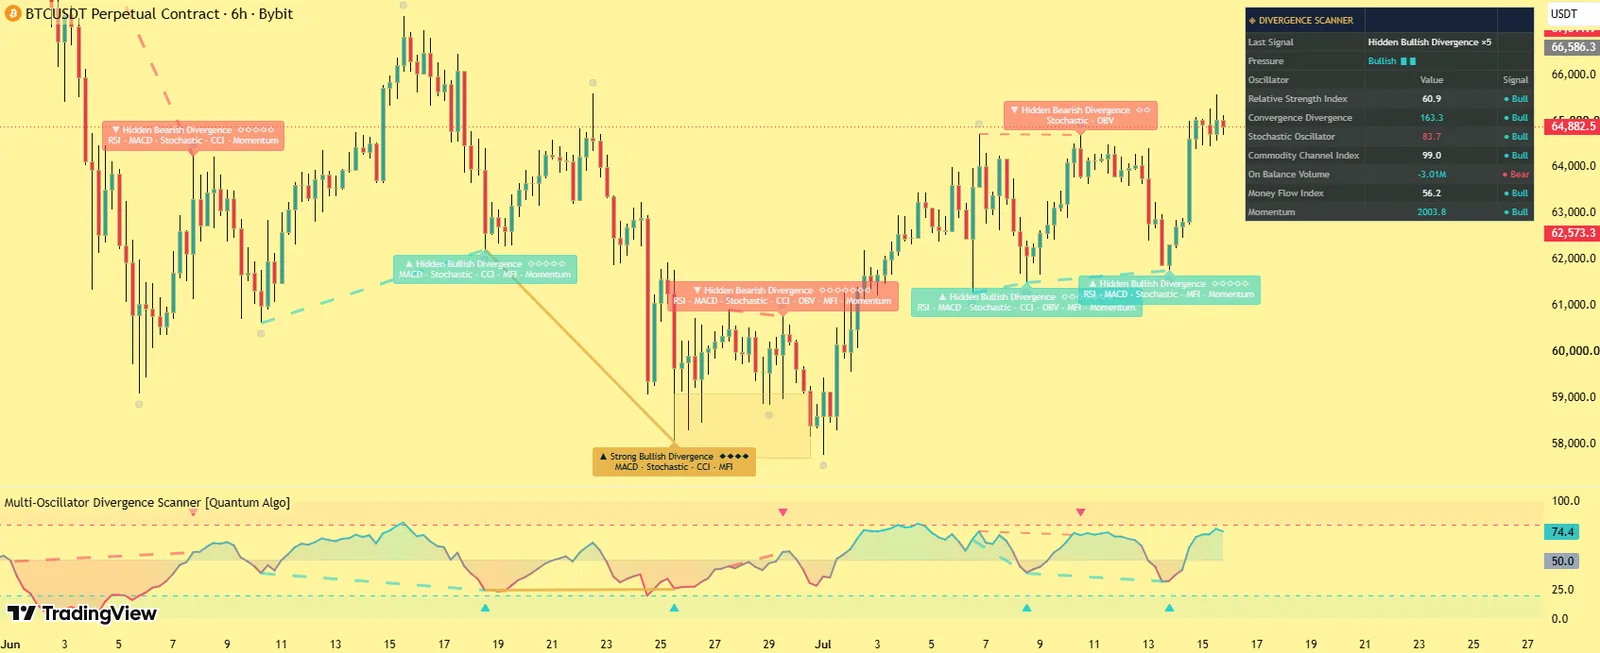
Divergence lines on price and on the Composite Oscillator, graded labels listing the engines, reaction zones and a dashboard with per-engine state.
True multi-engine confluence with full transparency — the label says which oscillators diverged.
No — evaluated on confirmed pivots at bar close.
What a divergence is
A divergence occurs when price prints a new extreme but an oscillator refuses to confirm it. Regular bullish: price lower low, oscillator higher low — a reversal condition. Regular bearish: price higher high, oscillator lower high. Hidden divergences are the continuation counterparts: price higher low with oscillator lower low (hidden bullish), price lower high with oscillator higher high (hidden bearish). The scanner detects all four on confirmed swing pivots. Our divergence guide covers the reading; this page is the scanner.
The Composite Oscillator
The consensus reading of every engine you enable: bounded oscillators (RSI, Stochastic, MFI) contribute their native 0–100 values; unbounded engines (MACD histogram, OBV, Momentum) are range-normalised over a configurable lookback; CCI is rescaled onto the same axis. The average plots as a single gradient line with overbought and oversold guides, a midline fill, and the divergence lines drawn directly on it — aggregate momentum from the same engines that vote on every signal, not a separate calculation.
What it draws
Divergence lines on price
Connecting the two confirmed pivots, thickening with confluence; Strong signals in the accent colour.
Graded labels
With a diamond meter (one per contributing oscillator) and the list of engines that diverged — for example RSI · OBV · MFI.
Reaction zones
ATR-sized boxes around the pivot that grey out the moment price invalidates them.
The Composite Oscillator pane
With mirrored divergence lines, triangle marks and tinted extreme bands.
The dashboard
Last signal, a live divergence pressure meter, and one row per engine with its live value and last divergence side.
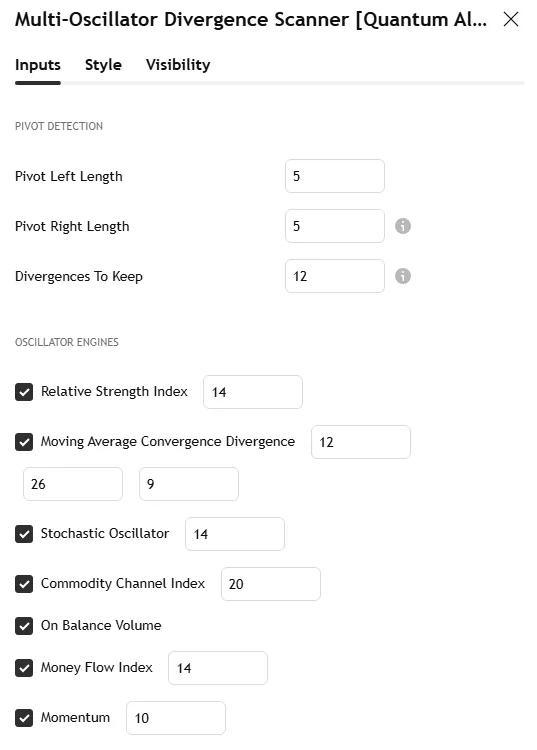
The Bitcoin 6-hour screenshot on this page shows a graded divergence on price with its reaction zone and the composite pane; the settings screenshot shows the Inputs tab.
Why it is different
True multi-engine confluence.
All seven engines are evaluated independently at every confirmed pivot; a signal exists only when the minimum confluence count is reached.
Dual-canvas mirroring.
Every qualified divergence is drawn twice, connected at the same two pivots — the visual proof that defines a divergence.
Full transparency on every label.
Strength as a diamond meter and the exact oscillators that diverged; nothing is a black box.
Reaction zones with a life cycle.
Live zones and dead ones are always distinguished.
A divergence pressure gauge.
A decaying model of bullish and bearish divergence weight over time — which side has been stacking disagreement.
How it works
Pivot scanning. Swing highs and lows confirmed with a symmetric lookback; all checks on closed bars at pivot confirmation.
Confluence evaluation. Each enabled oscillator's value at the pivot compared against its value at the previous same-side pivot; the four types tested independently per oscillator.
Grading. Signals meeting the minimum confluence print with diamonds; those reaching the Strong threshold upgrade in colour and thickness on both canvases.
Composite rendering and reaction zones as described; zones grey out on an invalidating close.
Chart hygiene. Divergences kept are capped on both canvases; older drawings deleted automatically.
Settings
| Group | Input | What it does | Where to start |
|---|---|---|---|
| Pivots | Left / right length | Swing size | 5 / 5 intraday; 8 / 8 on 4H+ |
| Engines | Toggles and lengths for RSI, MACD, Stochastic, CCI, OBV, MFI, Momentum | Which oscillators vote | default mix |
| Composite | Normalisation lookback, OB/OS levels, pane marks, mirrored lines | The consensus pane | 100; 70 / 30; on |
| Divergences | Regular and hidden toggles | Types detected | on / on |
| Minimum confluence | Engines that must agree | 2 | |
| Strong threshold | Upgrade to accent | 4 | |
| Reaction zones | Height (ATR ratio), extension | Size and length of the box | 0.5; 20 bars |
| Hygiene | Divergences to keep | Drawings cap | 12 |
| Dashboard | Text size, position, live values, colours | Themeable | — |
Alerts
Five named conditions: Bullish Divergence, Bearish Divergence (a regular divergence met the minimum), Hidden Bullish Divergence, Hidden Bearish Divergence, and Strong Divergence.
How to use it
Start at minimum confluence 2 and Strong 4. Raise to 3 for a strict, low-frequency reversal tool; lower to 1 to study single-oscillator behaviour.
Read the pane and the chart together. Price sloping one way, the composite the other, connected at the same pivots.
Regular divergences are reversal-oriented — exhaustion evidence at swing extremes, strongest with the composite inside an extreme band.
Hidden divergences are continuation-oriented — trend re-entry evidence on pullbacks; do not read them as reversals.
Use the reaction zone as the decision area. A live zone holding on retest supports the signal; a greyed zone means it failed.
Three ways to trade it
The sweep divergence.
A Strong regular bearish divergence whose second pivot is a swept high from Liquidity Sweeps — exhaustion at the raid; short the change of character with the stop above the zone.
The hidden continuation.
Hidden bullish divergence on a pullback into an order block in an uptrend — the trend re-entry with structure; stop below the block.
The zone retest.
A live reaction zone holding on the second touch, with the composite still in its extreme band — the confirmation entry, target the opposite Institutional Key Level.
Recommended settings by market
Crypto, 1H–6H:
Default engines; pivot 5–8; OBV and MFI reliable on exchange volume.
Forex and gold:
Disable OBV and MFI (tick volume) or lower their weight in your reading; minimum confluence 3 of the remaining five.
Stocks and indices, 15m–daily:
Default; volume engines at their best.
How it compares
Against single-oscillator divergence scripts: one engine and every divergence versus seven independent engines, graded confluence and a composite. Against the TDI: the TDI is one momentum pane; the scanner votes across seven. Against MACD Matrix: the matrix reads one engine deeply across timeframes; the scanner reads seven engines at one pivot. Against Zeno: Zeno prints the entry from structure; a Strong divergence at the same level is the momentum confirmation.
Limitations
Divergence can persist or fail during strong trends; regular divergences against a powerful trend are the weakest application. Volume engines are less meaningful on symbols with unreliable volume. Pivot confirmation introduces intentional delay.
Credits
RSI by J. Welles Wilder Jr. (1978); MACD by Gerald Appel; the Stochastic Oscillator popularised by George C. Lane; CCI by Donald Lambert (1980); On Balance Volume by Joseph Granville (1963); the Money Flow Index by Gene Quong and Avrum Soudack. Drawing divergence lines on an oscillator is shared prior art. The multi-engine confluence scanner, the consensus Composite Oscillator, dual-canvas mirroring, transparency labelling, strength grading, the reaction-zone life cycle, the pressure model and all code are original work by Quantum Algo, published open source.
Step-by-step: adding it to your TradingView chart
Open the script page on TradingView (link above) and click Add to favorites, then Use on chart — or on any chart open Indicators, search "Multi-Oscillator Divergence Scanner Quantum Algo" and add it. Free on every TradingView plan.
Open the indicator's settings and set the inputs for your market and timeframe from the table above; the defaults are tuned for crypto on 1-hour to 6-hour charts.
In the Style tab, match the colours to your chart theme; the dashboard position and text size are in Inputs.
To set alerts, right-click the chart → Add alert, choose the indicator as the condition and pick the event; set "Once per bar close" so alerts match the closed-bar logic.
Save the layout, and add the other free Quantum Algo tools to it — they are designed to sit together.
To read or reuse the code, click Source code on the script page; republishing is subject to TradingView's house rules.
Inside the code, for developers
Pine Script, open source. Worth reading if you want to modify it: every detection and signal gated on barstate.isconfirmed; state held in capped arrays of drawing objects with explicit create, update and retire functions; where statistics are kept, first-in-first-out arrays with shrinkage and a Wilson bound computed inline; named alertcondition calls so webhooks receive a consistent payload. The Academy's Pine Script tutorials and the TradingView backtesting guide cover strategy conversion.
Using it with the other free indicators
The free tools layer on one chart: the Smart Money Concepts Engine for bias and the Confluence Score; Order Blocks with Volume, Fair Value Gaps + Inversion and Institutional Key Levels for the zone; Liquidity Sweeps, Sessionscope and Liquidation Magnet for the liquidity and the trigger; OTE + Silver Bullet for the time-qualified entry; the Institutional Volume Profile and Pressure Oscillator for whether volume agrees; the trend and volatility family — the Adaptive Trend Sentinel, SuperTrend Engine, Golden Cross Engine, Anchored VWAP Engine, Trendline Architect, Keltner Rings and Volatility Storm Tracker — for regime, direction and room; and the momentum and statistics family — MACD Matrix, the Multi-Oscillator Divergence Scanner, the Event Probability Engine, the Market Bottom Finder, the Neural Confluence Engine, the Adaptive Lorentzian Classification and the Directional Strength Index — for momentum, probability and strength. The free-indicators hub lists every tool; the SMC guide is the method behind the layering.
Common mistakes with this indicator
- Trusting the developing bar — every event waits for the close.
- Trading every marker — the tool gives momentum and context; the entry needs a structure level and a stop beyond it.
- Default lengths on the wrong timeframe — adjust the inputs, as the settings table shows.
- Reading the statistics as promises — they describe this chart's history, shrunk toward neutral on purpose.
- Stacking ten random scripts — the free tools layer because they were built to.
Want the signal, not just the structure?
Zeno reads Smart Money structure across timeframes and prints the entry, stop, TP1 and TP2 on your chart — with a public record of 160 posted trades, 120 wins and 40 losses at the stated levels. QuantumBot executes it on Bybit, Binance, OKX, Bitget and Kraken.

Glossary for this indicator
Frequently asked questions
Does the Divergence Scanner repaint?
No. Divergences are evaluated only on confirmed pivots at bar close; the trade-off is confirmation lag equal to the right-side pivot length.
Why do some obvious divergences not print?
Either the confluence minimum was not reached, the oscillator involved is disabled, or the swing did not confirm as a pivot under the current lengths.
Which oscillators should I enable?
The default set mixes momentum and volume perspectives — independent evidence, not seven copies of the same maths.
Is a Strong signal a guaranteed reversal?
No. Strength counts agreement between engines; it is a transparency measure, not a probability of profit.
Why does a pane line start slightly off the composite's peak?
Divergence is measured at price structure points; the line connects the composite's values at the two confirmed price pivots, which is the correct comparison.
How does it relate to Zeno?
Zeno prints entries from structure; the scanner says whether momentum disagrees with price at that level — a Strong divergence on a Zeno signal bar is the strongest version of both.
Which divergence indicator is the most reliable?
None on its own; reliability comes from requiring independent evidence. Seven engines voting at one confirmed pivot, graded by agreement, is the closest thing to a reliable divergence read.
What is the difference between regular and hidden divergence?
Regular signals reversal — price extreme not confirmed by momentum; hidden signals continuation — a pullback not confirmed by momentum. The scanner detects both and labels them.
Can I get a divergence alert?
Yes — Bullish, Bearish, Hidden Bullish, Hidden Bearish and Strong Divergence are named alert conditions.
Why is there a pane at all?
Because a divergence is two slopes; the Composite Oscillator gives you the momentum slope next to the price slope, connected at the same pivots.
Does it work on forex?
Yes; disable the volume engines on tick-volume symbols and require 3 of the remaining 5 for the same selectivity.
What is the reaction zone for?
The decision area around the pivot: live while it holds, greyed the moment price invalidates it — so a failed divergence never lingers on the chart as a signal.
The momentum and statistics family
Momentum, probability and strength — the reads that sit under the Smart Money layer and beside the trend tools.
Add Multi-Oscillator Divergence Scanner to your chart
One click on TradingView, free on every plan, code you can read. Nothing repaints.