Directional Strength Index [Quantum Algo]
The ADX family rebuilt so you can read it at a glance: buying and selling pressure as two clean lines, an adaptive strength reading with zones, a histogram of the spread that shows momentum building or dying, crosses that print only when strength and momentum agree, and a dashboard that says the state in words.
The short answer
The Directional Strength Index is a free, open-source TradingView indicator that answers two questions before a trade: how strong is the current trend, and which direction is the pressure pushing? Most trend tools answer one — moving averages give direction but not strength; oscillators give momentum but not commitment. The DSI combines smoothed buying-pressure and selling-pressure lines, an adaptive trend-strength reading, a momentum histogram of the spread between buyers and sellers, cross signals with confidence filtering, and a live status dashboard, in one clean panel below the chart. It is the ADX family rebuilt so you can read it at a glance instead of decoding three intertwined lines.
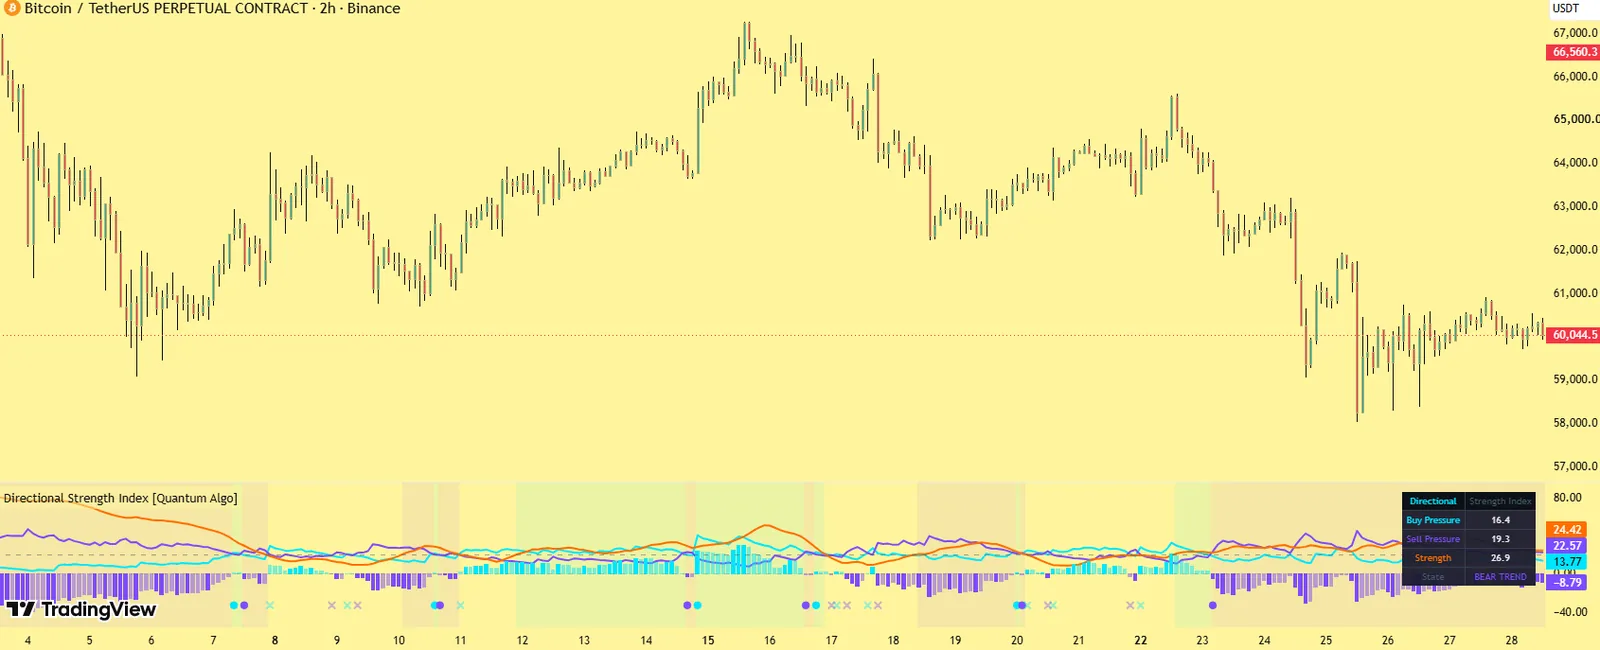
Cyan buying and violet selling pressure, an amber strength line with zones, the momentum histogram, filtered cross signals and a status dashboard.
The histogram, the adaptive thresholds and the confidence filter — the range crosses stay silent.
No — everything on closed bars.
What the ADX family measures
Wilder's Directional Movement system compares each bar's upward and downward movement: +DI tracks buying pressure, −DI selling pressure, and the ADX averages their difference into a strength reading with no direction of its own. Above 25 is conventionally a trend, below 20 a range. Our ADX guide covers the classic version; this page is the rebuilt panel.
What it draws
The buying-pressure line (cyan)
And the selling-pressure line (violet) — smoothed directional pressure.
The trend-strength line (amber)
An adaptive ADX-style strength reading with threshold zones.
The momentum histogram
The spread between buying and selling pressure as coloured bars; growing bars mean momentum building, fading bars mean it dying.
Cross signals
Where the pressure lines cross, printed only when the confidence filter passes.
The status dashboard
Trend state, strength, dominant side, histogram direction and the last signal.
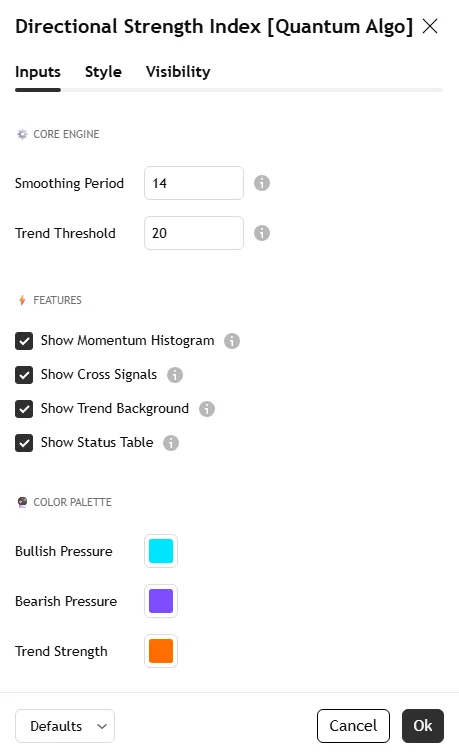
The Bitcoin 2-hour screenshot on this page shows the three lines, the histogram and a filtered cross; the settings screenshot shows the Inputs tab.
Why it is different from standard ADX indicators
Momentum histogram.
The spread between buyers and sellers as bars you can read at a glance, brighter as momentum grows.
Confidence-filtered crosses.
A pressure cross prints a signal only when strength and momentum agree — the weak crosses inside ranges stay silent.
Adaptive strength.
The strength reading and its thresholds adapt to the symbol's recent behaviour rather than a fixed 25.
A status dashboard.
Trend, strength, side and momentum in words, so you do not study three lines to find the state.
Themeable panel
With the Quantum Algo cyan/violet/amber language, matching the rest of the library.
How it works
Directional movement is computed from each bar's range against the previous bar; upward and downward components are smoothed into the buying and selling pressure lines.
The strength line averages the normalised difference between them over its smoothing length.
The histogram plots buying minus selling pressure, coloured by sign and shaded by change.
A cross of the pressure lines becomes a signal only when the strength reading is above its threshold and the histogram is growing in the cross's direction.
Everything is evaluated on closed bars; the dashboard updates each bar.
Settings
| Group | Input | What it does | Where to start |
|---|---|---|---|
| Engine | DI length | Directional smoothing | 14 |
| Strength smoothing | The ADX-style average | 14 | |
| Strength thresholds | Range / developing / strong zones | adaptive; 20 / 25 | |
| Signals | Confidence filter | Require strength and momentum agreement | on |
| Cooldown | Bars between signals | 5 | |
| Visuals | Histogram, threshold zones, colours | Appearance | on |
| Dashboard | Position, text size | Themeable | — |
Alerts
Named conditions for bullish and bearish pressure crosses (confidence-filtered), strength crossing its trend threshold, and momentum reversal; create them from the indicator's alert list.
How to use it
Read the dashboard first. Trend, strength and side in words; the lines are the detail.
Trend entries only when strength is above its threshold and the dominant pressure line is the one you are trading with.
Use the histogram as the exit cue. Fading bars while price is still moving is the momentum warning.
Ignore crosses in the range zone — the filter silences most, and the ones that pass still need a structure level.
Pair with a direction tool — the Adaptive Trend Sentinel for the regime, the DSI for strength and pressure.
Three ways to trade it
The strength breakout.
Strength crossing above its threshold with the buying line dominant and the histogram growing, on a close through an Institutional Key Level — the trend-start entry, stop below the level.
The pressure cross at structure.
A filtered bullish cross on the return to a demand block — the pressure flip confirms the block; stop below it.
The exhaustion exit.
Strength still high, histogram fading three bars in a row — take profit at the next Zeno target rather than waiting for the cross.
Recommended settings by market
Crypto, 1H–4H:
DI 14, smoothing 14, adaptive thresholds — the defaults.
Forex and gold, 15m–1H:
DI 10, smoothing 10 for the session moves.
Indices, 5m–15m:
DI 8, cooldown 8; the open produces weak crosses the filter should remove.
How it compares
Against the built-in ADX/DMI: same lineage, but the histogram, the adaptive strength, the confidence-filtered crosses and the dashboard replace line-reading with a state you can act on. Against the Choppiness Index: CHOP says whether to trade; the DSI says how strongly and which side is pushing. Against the Adaptive Trend Sentinel: the Sentinel gives the regime boundary; the DSI gives its strength. Against Zeno: Zeno prints the entry; the DSI says whether the trend behind it has commitment.
Limitations
Directional movement is a lagging measure, and strength readings rise after the move has started. Ranges produce whipsaw crosses that the filter reduces but cannot remove entirely. The panel reads strength and pressure, not location — structure supplies that.
Credits
The Directional Movement Index and ADX are by J. Welles Wilder Jr. (1978). The momentum histogram, adaptive strength thresholds, confidence-filtered cross logic, the status dashboard and all code are original work by Quantum Algo, published open source.
Step-by-step: adding it to your TradingView chart
Open the script page on TradingView (link above) and click Add to favorites, then Use on chart — or on any chart open Indicators, search "Directional Strength Index Quantum Algo" and add it. Free on every TradingView plan.
Open the indicator's settings and set the inputs for your market and timeframe from the table above; the defaults are tuned for crypto and forex on 1-hour to 4-hour charts.
In the Style tab, match the colours to your chart theme; the dashboard position and text size are in Inputs.
To set alerts, right-click the chart → Add alert, choose the indicator as the condition and pick the event; set "Once per bar close" so alerts match the closed-bar logic.
Save the layout, and add the other free Quantum Algo tools to it — they are designed to sit together.
To read or reuse the code, click Source code on the script page; republishing is subject to TradingView's house rules.
Inside the code, for developers
Pine Script, open source. Worth reading if you want to modify it: every detection and signal gated on barstate.isconfirmed; state held in capped arrays of drawing objects with explicit create, update and retire functions; where statistics are kept, first-in-first-out arrays with shrinkage and a Wilson bound computed inline; named alertcondition calls so webhooks receive a consistent payload. The Academy's Pine Script tutorials and the TradingView backtesting guide cover strategy conversion.
Using it with the other free indicators
The free tools layer on one chart: the Smart Money Concepts Engine for bias and the Confluence Score; Order Blocks with Volume, Fair Value Gaps + Inversion and Institutional Key Levels for the zone; Liquidity Sweeps, Sessionscope and Liquidation Magnet for the liquidity and the trigger; OTE + Silver Bullet for the time-qualified entry; the Institutional Volume Profile and Pressure Oscillator for whether volume agrees; the trend and volatility family — the Adaptive Trend Sentinel, SuperTrend Engine, Golden Cross Engine, Anchored VWAP Engine, Trendline Architect, Keltner Rings and Volatility Storm Tracker — for regime, direction and room; and the momentum and statistics family — MACD Matrix, the Multi-Oscillator Divergence Scanner, the Event Probability Engine, the Market Bottom Finder, the Neural Confluence Engine, the Adaptive Lorentzian Classification and the Directional Strength Index — for momentum, probability and strength. The free-indicators hub lists every tool; the SMC guide is the method behind the layering.
Common mistakes with this indicator
- Trusting the developing bar — every event waits for the close.
- Trading every marker — the tool gives momentum and context; the entry needs a structure level and a stop beyond it.
- Default lengths on the wrong timeframe — adjust the inputs, as the settings table shows.
- Reading the statistics as promises — they describe this chart's history, shrunk toward neutral on purpose.
- Stacking ten random scripts — the free tools layer because they were built to.
Want the signal, not just the structure?
Zeno reads Smart Money structure across timeframes and prints the entry, stop, TP1 and TP2 on your chart — with a public record of 160 posted trades, 120 wins and 40 losses at the stated levels. QuantumBot executes it on Bybit, Binance, OKX, Bitget and Kraken.

Glossary for this indicator
Frequently asked questions
Does the Directional Strength Index repaint?
No. Pressure lines, strength, histogram and signals are computed from closed bars; a printed cross does not move.
How is it different from ADX?
Same directional-movement lineage, rebuilt: a momentum histogram of the buyer/seller spread, adaptive strength thresholds, crosses that print only when strength and momentum agree, and a dashboard that states the trend in words.
What does the amber line mean?
Trend strength — how committed the move is, with no direction of its own; direction comes from which pressure line is on top.
Why did a cross not print a signal?
The confidence filter: strength was below its threshold or the histogram was not growing in the cross's direction. Disable the filter for the raw feed.
Which timeframe is best?
1H–4H on crypto and forex; the histogram is cleanest there. Intraday index charts need a shorter DI length and a longer cooldown.
How does it relate to Zeno?
Zeno prints structure entries with stop and targets; the DSI says whether the trend behind them has strength and which side is pushing.
What is the best trend strength indicator?
ADX is the standard, and this is ADX read at a glance: histogram, adaptive zones, filtered crosses and a dashboard in words — with the maths unchanged and open.
What ADX value means a strong trend?
Conventionally above 25; the DSI adapts the zones to the symbol's recent behaviour, so the threshold is relative rather than a fixed number.
Can I get an alert on an ADX cross?
Yes — named conditions for the filtered bullish and bearish pressure crosses, strength crossing its threshold and momentum reversal.
Which timeframe is best?
1H–4H on crypto and forex; shorter DI lengths and a longer cooldown on intraday index charts.
Does it give direction?
Direction comes from which pressure line is on top; the amber strength line has no direction of its own — the dashboard combines both into one state.
Should I disable the confidence filter?
Only to study the raw cross feed; with it on, most range crosses stay silent, which is the point.
The momentum and statistics family
Momentum, probability and strength — the reads that sit under the Smart Money layer and beside the trend tools.
Add Directional Strength Index to your chart
One click on TradingView, free on every plan, code you can read. Nothing repaints.