Market Bottom Finder [Quantum Algo]
A capitulation detector that grades its own homework: an adaptive fear gauge, a pressure integral that charges through sustained panic, exhausted momentum, climactic volume and a deep rejecting wick as independent witnesses — a gold marker at five, every marker recoloured later by what price actually did.
The short answer
The Market Bottom Finder is a free, open-source TradingView capitulation detector. It watches for the moment panic selling exhausts itself — the fear spike, the final violent flush, the volume climax, the long rejection wick — and marks that bar as a graded bottom candidate on the chart. Built on the Williams Vix Fix, the classic synthetic fear gauge, it adds four independent witnesses: an accumulated-stretch pressure integral, momentum-exhaustion analysis, a volume climax filter and oscillator divergence. The more witnesses agree, the higher the grade; a five-witness alignment prints a gold Capitulation marker. What makes it different is accountability: every marker settles — recoloured a fixed number of bars later by what actually happened — so the chart always shows the tool's genuine hit rate, failures included.
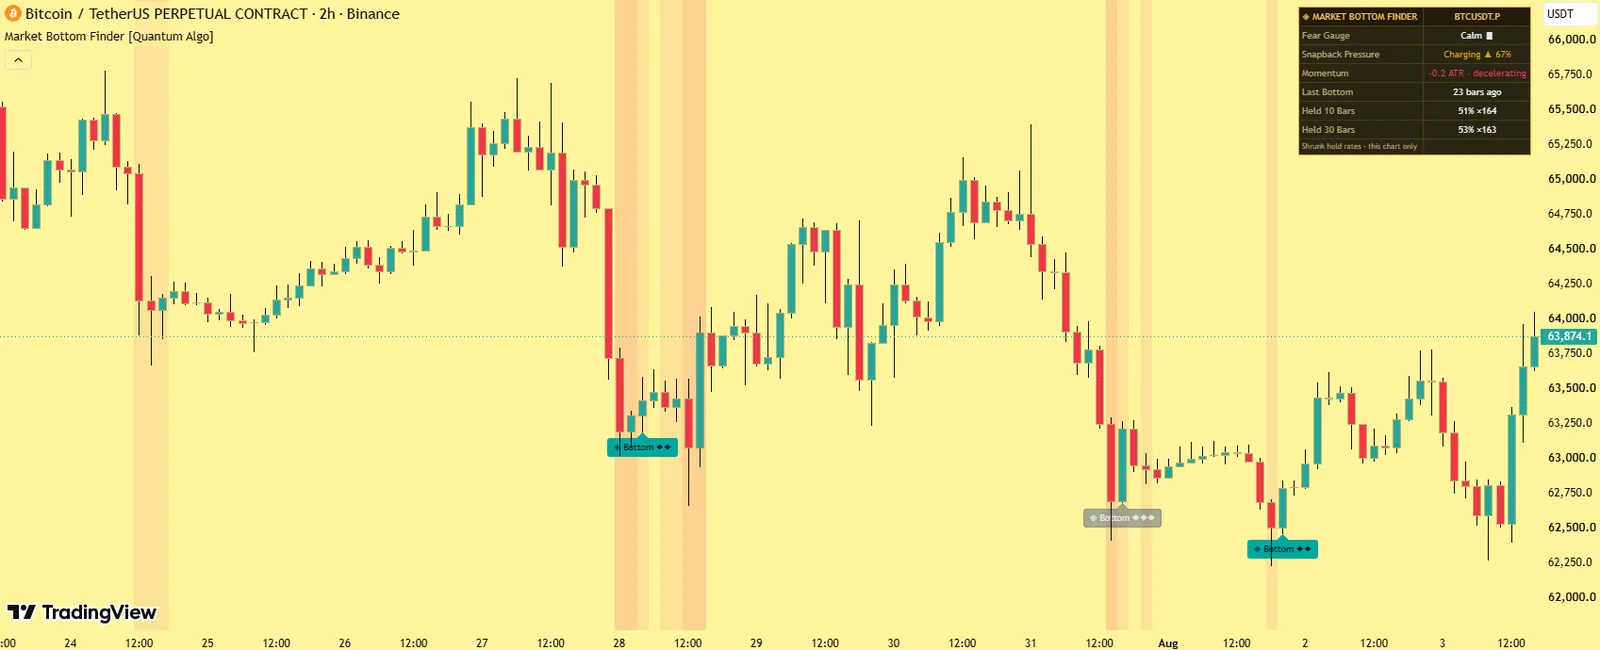
A fear wash, graded bottom markers with diamonds, gold Capitulations, settled outcomes, an optional top mirror and the dashboard with Held rows.
Snapback Pressure and the settling audit — depth and duration required, results shown on the chart.
No — confirmed-bar detection; settled markers are permanent.
What a market bottom is
A durable bottom is rarely quiet. It is usually a capitulation: fearful holders finally surrender, selling accelerates into a climax, and the supply of panic sellers runs out. The signature is consistent across markets and decades — a spike in the fear gauge, unusually fast downward movement that suddenly decelerates, climactic volume, and a candle that dives deep and closes far off its low. The indicator formalises that signature into measurable conditions and requires several to align at once.
The Williams Vix Fix
Created by Larry Williams, the Vix Fix synthesises a volatility-index-style fear reading from price alone: how far the current low has fallen from the highest close of the recent window. When that distance expands violently, fear is spiking — on any symbol, including those with no options market. The tool extends it with an adaptive threshold: a spike is the gauge exceeding a high percentile of its own history, so "extreme fear" recalibrates to every symbol, timeframe and regime.
What it draws
A translucent fear wash
Over bars where the gauge spikes.
Graded bottom markers
With one diamond per witness; five or more prints the gold Capitulation.
Settled markers
Solid if price held above the detected low after the window, faded if it failed.
Optional top mirror
Markers.
The dashboard
Fear gauge and threshold, the pressure row, and the Held statistics at ten and thirty bars.
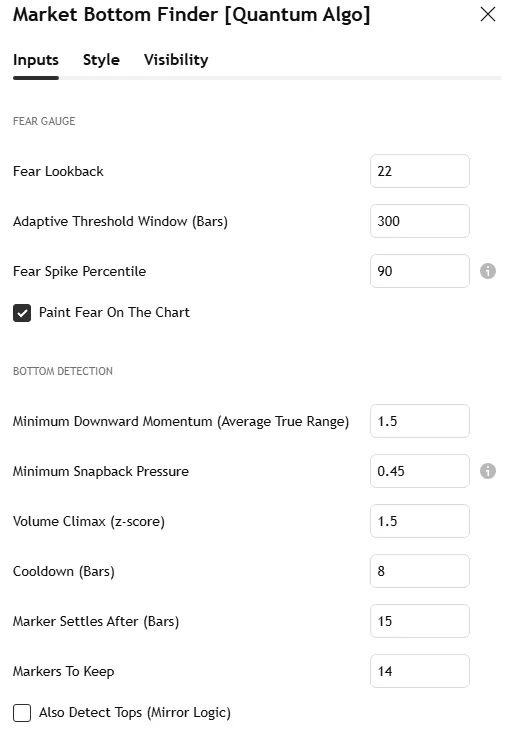
The Bitcoin 2-hour screenshot on this page shows the fear wash, a graded bottom and the dashboard; the settings screenshot shows the Inputs tab.
Why it is different
Adaptive fear threshold.
Fixed trigger levels fail across symbols; the gauge defines extremity from the symbol's own distribution.
Snapback Pressure.
An accumulated-stretch integral: the longer and deeper price stays extended below its long-term average, the more the pressure charges. A single red candle barely moves it; sustained capitulation charges it fully. Bottoms require depth and duration.
Witness grading.
Fear extremity, volume climax, wick rejection, oscillator divergence and high pressure counted as independent witnesses.
Settling markers.
The tool grades its own homework, on the chart.
Two-horizon statistics.
How often detected bottoms held after ten and thirty bars on your exact chart, shrunk toward neutral with Wilson bounds.
How it works
The fear gauge is computed each bar and compared with its adaptive percentile threshold; spikes paint the wash.
Downward momentum is measured in ATR units; a bottom requires a violent arrival that has begun decelerating.
The pressure integral accumulates while price is stretched below its long-term average and decays once it re-enters.
When a fear spike, exhausted momentum and charged pressure coincide, a candidate prints and is graded by the remaining witnesses.
After the settle window the marker is recoloured by outcome; results feed the statistics.
All detection on confirmed bars; settled markers never change.
Settings
| Group | Input | What it does | Where to start |
|---|---|---|---|
| Fear Gauge | Lookback | Vix Fix window | 22 |
| Adaptive threshold window and percentile | Spike definition | 200; 90th | |
| Chart wash toggle | The fear tint | on | |
| Bottom Detection | Minimum momentum | ATR units of arrival speed | 2.0 |
| Minimum pressure | Snapback charge required | 60% | |
| Volume climax level | Multiple of average volume | 1.8× | |
| Cooldown, settle window, markers kept | Spacing; outcome timing; history | 10; 20; 20 | |
| Top mirror | Detect tops too | off | |
| Statistics | Sample cap, minimum samples, shrinkage strength, Wilson z | The Held rows | 40 / 8 / default / 1.28 |
| Visuals | Colours, dashboard | Appearance | — |
Alerts
Four named conditions: Fear Spike, Bottom Detected, Capitulation (Grade A), and Top Detected (mirror, when enabled).
How to use it
As a context tool. The fear wash and pressure row show when conditions for a durable low are building, before any marker prints.
As a confirmation layer. Combine a Capitulation with your own support — an Institutional Key Level, the Volume Profile's Control Level, higher-timeframe structure — rather than acting on it alone.
Grade discipline. Gold five-plus-witness Capitulations deserve the most attention; single-diamond bottoms are early warnings.
Read your chart's Held rows first — how this symbol and timeframe has responded historically.
1H to weekly on any market.
Three ways to trade it
The capitulation reclaim.
Gold Capitulation on a sweep of the range low, then a change of character on the lower timeframe — long the reclaim, stop below the capitulation low, target the equilibrium of the range.
The pressure watch.
Pressure above 60% inside a Volatility Storm Tracker BUILDING box, no marker yet — stand aside from shorts and prepare the long plan.
The failed-bottom short.
A faded (failed) marker followed by a lower low with charged pressure again — the second capitulation is usually the real one; wait for it rather than fading the first.
Recommended settings by market
Crypto, 4H–daily:
Percentile 90, minimum pressure 60% — capitulations are frequent and violent.
Indices and stocks, daily:
Percentile 92, minimum pressure 70% — rarer, cleaner events.
Forex and gold, 1H–4H:
Volume witness less reliable on tick volume; require four witnesses for conviction.
How it compares
Against a plain Vix Fix: one gauge and a fixed level versus an adaptive threshold, four extra witnesses, grading, settled outcomes and statistics. Against RSI oversold: RSI says stretched; this says stretched, exhausted, climactic and charged — and reports how often that combination held here. Against the Liquidation Magnet: the magnet shows where forced selling sits; the finder detects when it has finished. Against Zeno: Zeno prints the entry on the reclaim; the finder says the panic that made it possible has ended.
Limitations
Capitulation detection identifies panic exhaustion; it cannot identify news-driven regime changes or slow structural declines. Statistics describe the current chart's history. On illiquid symbols, volume witnesses are less reliable.
Credits
The Vix Fix by Larry Williams; RSI and ATR by J. Welles Wilder Jr. (1978); the pressure integral follows the action-integral form of Wentzel, Kramers and Brillouin (1926), used strictly as a modelling device; the Wilson score interval by Edwin B. Wilson (1927). The adaptive threshold, witness grading engine, settling audit, per-symbol statistics and all code are original work by Quantum Algo, published open source.
Step-by-step: adding it to your TradingView chart
Open the script page on TradingView (link above) and click Add to favorites, then Use on chart — or on any chart open Indicators, search "Market Bottom Finder Quantum Algo" and add it. Free on every TradingView plan.
Open the indicator's settings and set the inputs for your market and timeframe from the table above; the defaults are tuned for crypto on 4-hour and daily charts.
In the Style tab, match the colours to your chart theme; the dashboard position and text size are in Inputs.
To set alerts, right-click the chart → Add alert, choose the indicator as the condition and pick the event; set "Once per bar close" so alerts match the closed-bar logic.
Save the layout, and add the other free Quantum Algo tools to it — they are designed to sit together.
To read or reuse the code, click Source code on the script page; republishing is subject to TradingView's house rules.
Inside the code, for developers
Pine Script, open source. Worth reading if you want to modify it: every detection and signal gated on barstate.isconfirmed; state held in capped arrays of drawing objects with explicit create, update and retire functions; where statistics are kept, first-in-first-out arrays with shrinkage and a Wilson bound computed inline; named alertcondition calls so webhooks receive a consistent payload. The Academy's Pine Script tutorials and the TradingView backtesting guide cover strategy conversion.
Using it with the other free indicators
The free tools layer on one chart: the Smart Money Concepts Engine for bias and the Confluence Score; Order Blocks with Volume, Fair Value Gaps + Inversion and Institutional Key Levels for the zone; Liquidity Sweeps, Sessionscope and Liquidation Magnet for the liquidity and the trigger; OTE + Silver Bullet for the time-qualified entry; the Institutional Volume Profile and Pressure Oscillator for whether volume agrees; the trend and volatility family — the Adaptive Trend Sentinel, SuperTrend Engine, Golden Cross Engine, Anchored VWAP Engine, Trendline Architect, Keltner Rings and Volatility Storm Tracker — for regime, direction and room; and the momentum and statistics family — MACD Matrix, the Multi-Oscillator Divergence Scanner, the Event Probability Engine, the Market Bottom Finder, the Neural Confluence Engine, the Adaptive Lorentzian Classification and the Directional Strength Index — for momentum, probability and strength. The free-indicators hub lists every tool; the SMC guide is the method behind the layering.
Common mistakes with this indicator
- Trusting the developing bar — every event waits for the close.
- Trading every marker — the tool gives momentum and context; the entry needs a structure level and a stop beyond it.
- Default lengths on the wrong timeframe — adjust the inputs, as the settings table shows.
- Reading the statistics as promises — they describe this chart's history, shrunk toward neutral on purpose.
- Stacking ten random scripts — the free tools layer because they were built to.
Want the signal, not just the structure?
Zeno reads Smart Money structure across timeframes and prints the entry, stop, TP1 and TP2 on your chart — with a public record of 160 posted trades, 120 wins and 40 losses at the stated levels. QuantumBot executes it on Bybit, Binance, OKX, Bitget and Kraken.

Glossary for this indicator
Frequently asked questions
Does the Market Bottom Finder repaint?
No. Detection uses confirmed bars only and settled markers are permanent; the settling recolour is the tool honestly reporting an outcome, not a signal changing.
Does it catch every bottom?
No, and it is not designed to. It detects capitulation-style bottoms; slow, quiet rounded bottoms without a fear spike will not qualify.
Why did a marker print and price still went lower?
Because no bottom detector is right every time — and this is the one that shows you how often it is right, via the settled markers and the Held statistics.
What do the Held percentages mean?
The share of past detected bottoms after which price was higher ten and thirty bars later, on this symbol and timeframe, shrunk toward 50% at small samples.
Which settings should I change first?
The Fear Spike Percentile (higher = rarer, stronger events) and the Minimum Snapback Pressure (higher = more sustained capitulation required).
How does it relate to Zeno?
Zeno prints the reclaim entry with stop and targets; the finder says whether the low behind it was a real capitulation.
How do you know when the market has bottomed?
You cannot know in advance; you can measure whether the signature of a capitulation is present — fear spike, exhausted momentum, charged pressure, climactic volume, rejecting wick — and then see whether it held. The finder does both.
What is the Williams Vix Fix?
Larry Williams' synthetic fear gauge from price alone — the distance of the current low from the recent highest close; our Williams Vix Fix guide covers the classic reading.
Does it work on stocks?
Yes; daily stock and index charts produce rarer, cleaner capitulations — raise the percentile to 92 and pressure to 70%.
Can I get an alert on a market bottom?
Yes — Fear Spike, Bottom Detected, Capitulation (Grade A) and, with the mirror on, Top Detected.
Why a top mirror?
Because blow-off tops share the mirrored signature; it is off by default because tops are usually slower and less symmetric than bottoms.
What is Snapback Pressure?
An accumulated-stretch integral: it charges the longer and deeper price stays extended below its long-term average and decays once price re-enters — bottoms require depth and duration, not one red candle.
The momentum and statistics family
Momentum, probability and strength — the reads that sit under the Smart Money layer and beside the trend tools.
Add Market Bottom Finder to your chart
One click on TradingView, free on every plan, code you can read. Nothing repaints.