Traders Dynamic Index (TDI): What It Is, How to Read It, and the Trading Strategy That Fits
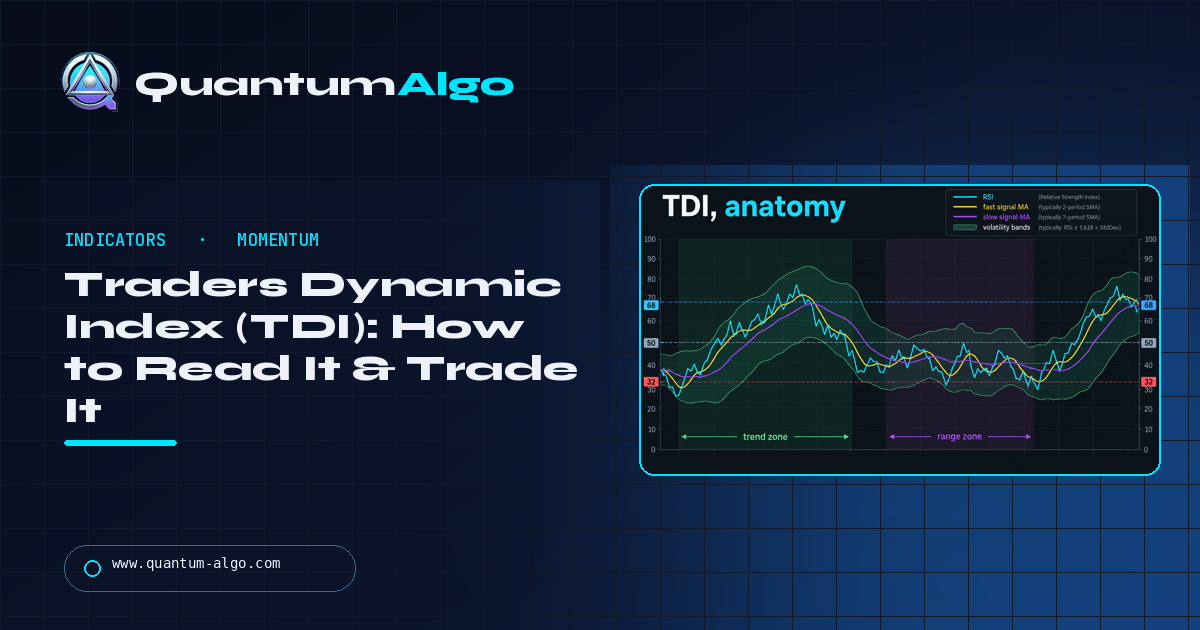
The Traders Dynamic Index (TDI) is a momentum indicator that puts an RSI, two moving averages of that RSI and a pair of volatility bands into one pane, so a single window shows trend, momentum and volatility at once. Created by Dean Malone, it plots RSI(13), a 2-period signal line, a 7-period base line and Bollinger Bands (34, 1.62) on the RSI, with levels at 32, 50 and 68. Read it three ways: RSI crossing the signal line for entries, signal crossing base for trend, bands squeezing and expanding for volatility — and use it as a filter beside structure, not as a signal on its own.
Most oscillators answer one question; the TDI answers three in one pane, which is why it has survived twenty years of new indicators. This page is the anatomy, the three signals, the settings Malone published, a reading table, the Smart Money strategy where the TDI is the trigger and structure is the location, a worked gold trade, the comparison with RSI, MACD and Stochastic, presets by market and the mistakes. The signal reader below turns a TDI state into the read.
Indicators that prove themselves in public.
One engine, four precision tools — the Gold (XAU) Scalper, the institutional Gravity Zone, the Zeno momentum Oscillator, and Zeno Stocks for equities.



What is the Traders Dynamic Index?
The Traders Dynamic Index (TDI) is a momentum indicator that puts an RSI, two moving averages of that RSI and a pair of volatility bands into one pane, so a single window shows trend, momentum and volatility at once. Created by Dean Malone in the early 2000s, it plots a 13-period RSI (the price line), a fast moving average of it (the signal line, usually 2 periods), a slow moving average (the base line, usually 7 periods) and Bollinger Bands drawn around the RSI (34 periods, 1.62 standard deviations), with horizontal levels at 32, 50 and 68. Traders read it three ways: the RSI crossing the signal line for entries, the signal line crossing the base line for trend, and the bands squeezing and expanding for volatility. It is a complete read in one pane — and, used as a filter beside structure rather than as a signal on its own, one of the more useful oscillators for a Smart Money trader.
TDI, anatomy
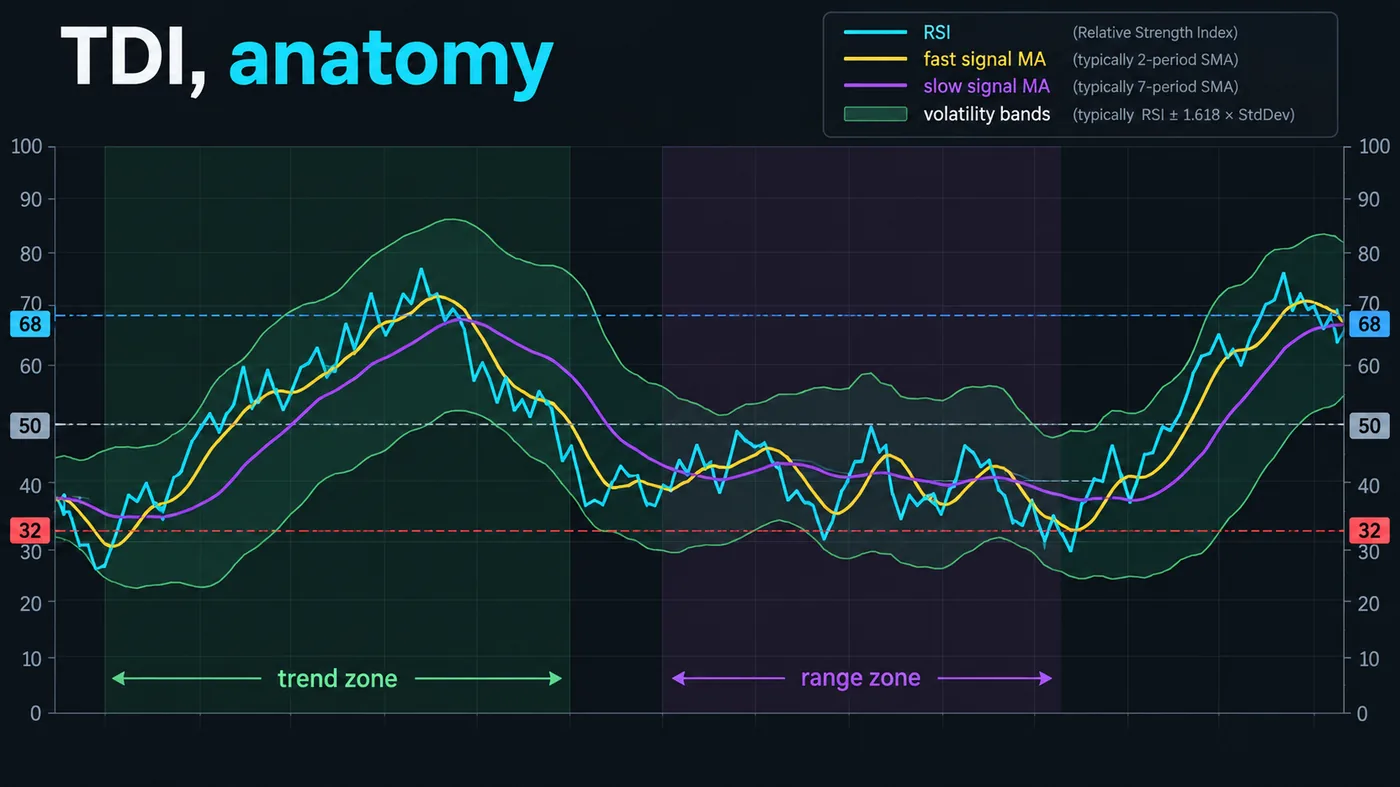
The anatomy illustration in this guide labels the five elements:
- The price line — RSI(13), the fastest element; where momentum is right now.
- The signal line — a 2-period moving average of the RSI; the entry trigger when the price line crosses it.
- The base line — a 7-period moving average of the RSI; the trend when the signal line sits above or below it.
- The volatility bands — Bollinger Bands on the RSI (34, 1.62); narrow means quiet, wide means active; the RSI touching a band means momentum is stretched.
- The levels — 32 (oversold territory), 50 (the midline, bullish above, bearish below), 68 (overbought territory).
The pane is read like a chart of its own: the RSI is price, the signal and base lines are fast and slow moving averages, the bands are volatility, and 50 is the trend line.
The three TDI signals
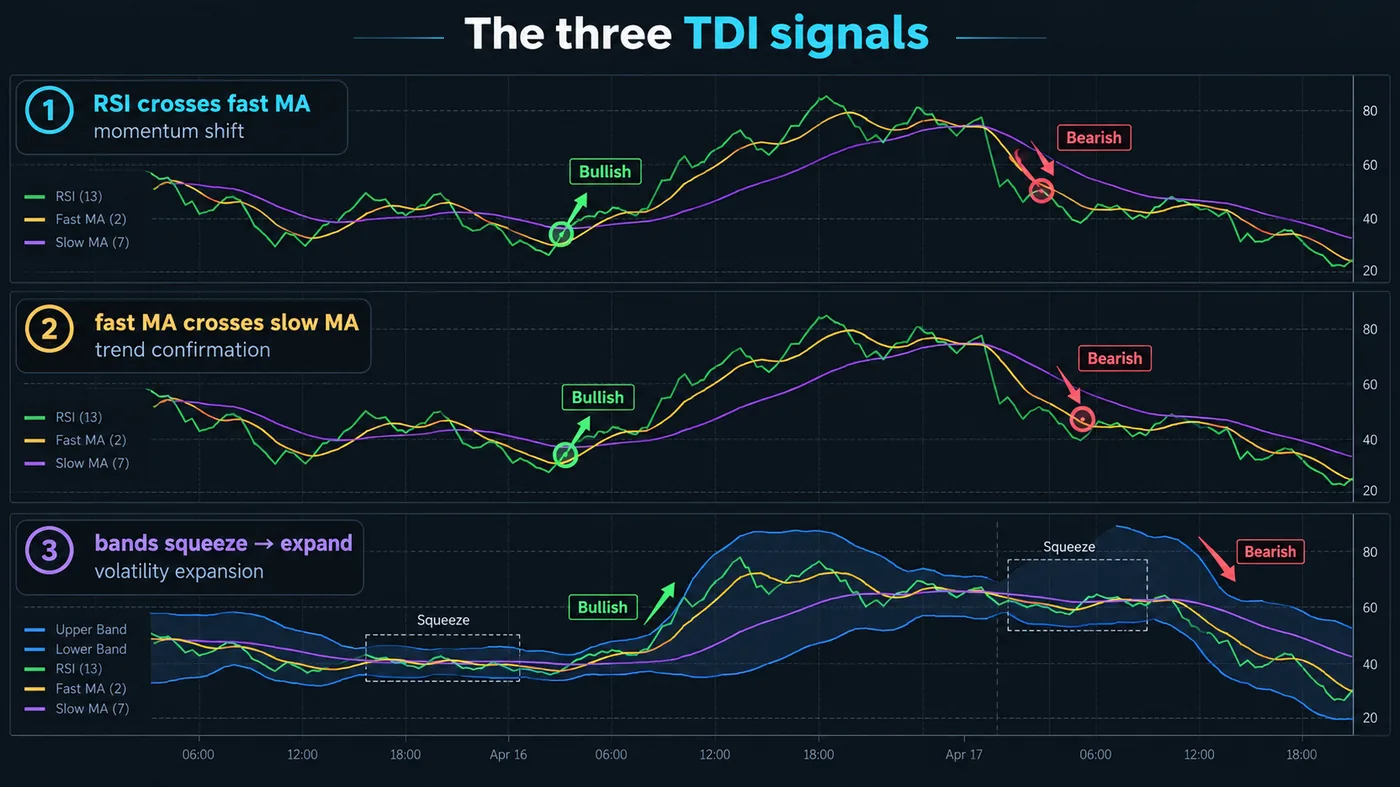
The three-panel illustration in this guide shows the readings traders act on:
- RSI crosses the signal line — the fastest signal, a momentum turn. Long when the price line crosses up through the signal line, short when it crosses down. Alone it is noisy; above 50 for longs and below 50 for shorts it is usable.
- Signal line crosses the base line — the trend signal. When the fast MA crosses above the slow MA, momentum's trend has turned up; the reverse for down. Slower, cleaner, and the filter most TDI strategies use for direction.
- Band squeeze and expansion — when the bands narrow, volatility has compressed and a move is coming; when the RSI breaks out of the bands as they expand, the move is under way. The squeeze is the setup, the expansion the confirmation.
The highest-quality TDI read is all three at once: a squeeze resolving with the RSI crossing the signal line, the signal line above the base line, and all of it above 50.

Automate your trades. Let Quantum Algo trade for you.
Every signal executed on your own account — on your account, with the plan you define.
Settings
| Element | Default | What it controls | Where to start |
|---|---|---|---|
| RSI period | 13 | The price line's sensitivity | 13 (8–10 for scalping) |
| Signal line (fast MA) | 2 | Entry trigger speed | 2 |
| Base line (slow MA) | 7 | Trend read | 7 |
| Volatility band length | 34 | Bollinger period on the RSI | 34 |
| Band deviation | 1.62 | Band width | 1.62 (2.0 for fewer band touches) |
| Levels | 32 / 50 / 68 | Zones | as shipped |
The defaults are the ones Malone published and the ones most TradingView versions ship with; they work on any timeframe because the RSI is bounded. Change the RSI period first if anything, and only for scalping.
How to read it
| Reading | Meaning |
|---|---|
| RSI above 50, signal above base | Bullish momentum trend — look for longs only |
| RSI below 50, signal below base | Bearish momentum trend — shorts only |
| RSI crosses up through the signal line above 50 | Long trigger in a bullish trend |
| RSI crosses down through the signal line below 50 | Short trigger in a bearish trend |
| RSI touches the upper band | Momentum stretched — no new longs, tighten stops |
| RSI touches the lower band | Momentum stretched down — no new shorts |
| Bands squeeze | Volatility compressed — a move is coming, direction unknown |
| RSI stuck between 40 and 60 with flat lines | Range — the "do not trade" read |
A TDI trading strategy that fits Smart Money
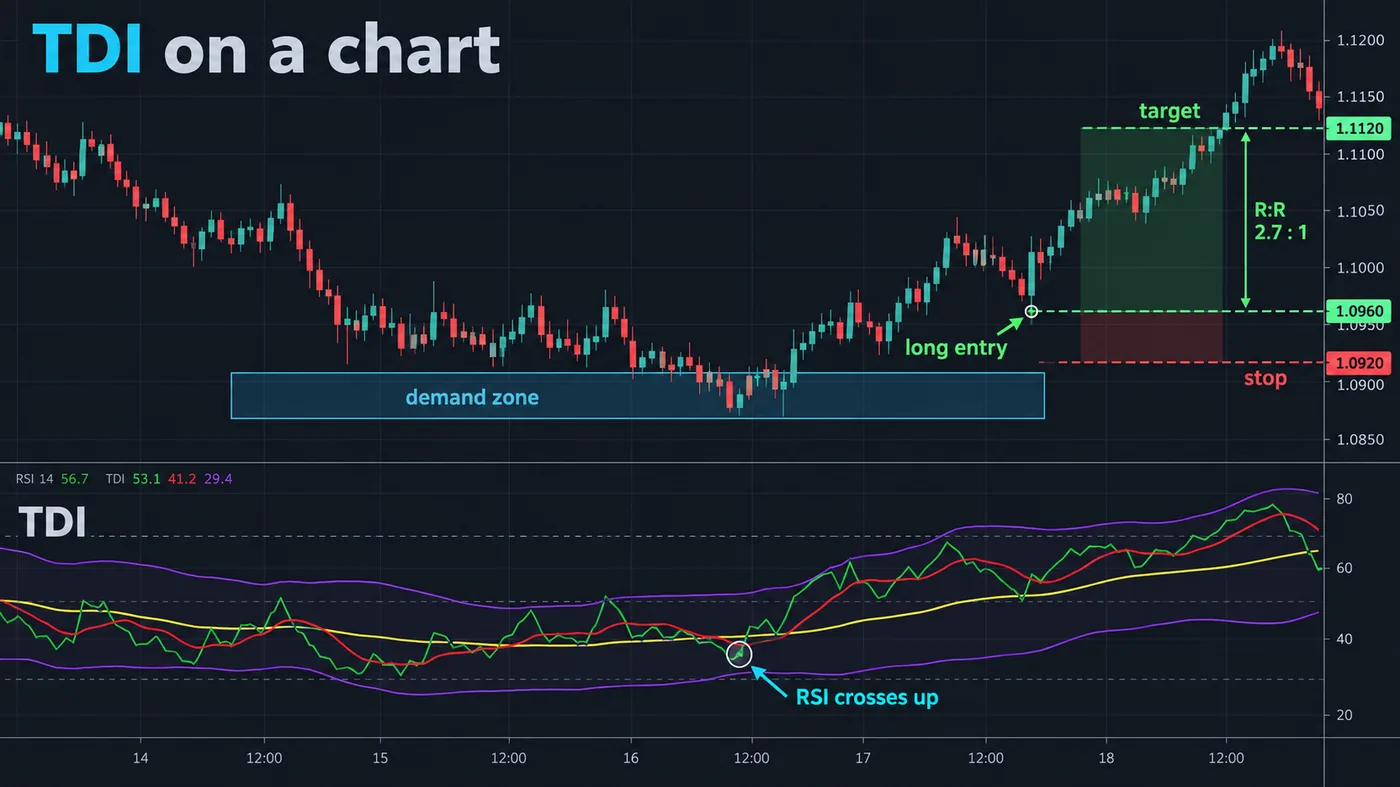
The TDI is a filter and a trigger, not a location. The location comes from structure — a demand zone, an order block, a level — and the TDI decides whether momentum agrees and when to pull the trigger. The chart illustration in this guide shows the trade:
- Location first. Price returns to a demand zone (an order block, a swept low, a ranked level) on the higher timeframe.
- Trend check. On the trading timeframe the signal line is above the base line and the RSI is above 50 — or, for a reversal, the RSI is coming up out of the lower band.
- Trigger. The RSI crosses up through the signal line at the zone.
- Stop beyond the zone, as the stop-loss page describes; target at the next liquidity, or at the first touch of the upper band for a momentum exit.
- Skip it when the bands are squeezed flat around 50 — that is a range, and the zone is not enough.
Shorts are the mirror at supply. The strategy's edge is the location; the TDI's job is to keep you out of trades where momentum has not turned, and in trades where it has.
TDI versus RSI, MACD and Stochastic
| TDI | RSI | MACD | Stochastic | |
|---|---|---|---|---|
| What it reads | Momentum + its trend + its volatility | Momentum | Momentum trend | Momentum position in range |
| Bounded | Yes (0–100) | Yes | No | Yes |
| Trend read | Signal vs base line | Level vs 50 | Line vs signal | None |
| Volatility read | Bands | None | Histogram size, indirectly | None |
| Best use | All-in-one filter | Divergence, extremes | Trend momentum | Overbought/oversold |
The TDI is an RSI with a trend layer and a volatility layer added; if you use RSI for divergence, keep it — the TDI's RSI is the same line and diverges the same way.
Recommended settings by market
- Forex majors and gold, 15m–1H: defaults; the squeeze is most reliable into the London and New York opens.
- Crypto, 1H–4H: RSI 13, band deviation 2.0 to reduce band touches in the noisier market.
- Indices, 5m–15m in the cash session: RSI 8–10 for scalping speed; 34/1.62 bands unchanged.
- Daily charts: defaults; the signal/base cross on the daily is a swing-trade bias tool.
Mistakes
- Trading every RSI/signal cross — without the 50 filter and a location, it is noise.
- Reading the bands as price bands — they are bands on the RSI, and a band touch is a momentum extreme, not a price level.
- Ignoring the squeeze — the flat, narrow read is the most useful thing the TDI says, and it says "wait".
- Using the TDI as the reason for the trade — it is the reason to pull the trigger at a level you already had.
A worked example: gold, 15 minutes, London open
09:10 UTC. Gold has spent the Asian session in a 12-dollar range; the TDI bands are pinched flat around 50 — the squeeze — and the signal line sits a fraction above the base line. At 09:05 London sweeps the Asian low by $1.80 and closes back inside; the free Liquidity Sweeps tool marks it. On the next bar the RSI, which had dipped to 38 on the sweep, crosses up through the signal line; the bands begin to expand. Location (a swept low at the bottom of the range, on a demand block from the previous day), trend (signal above base, RSI heading for 50) and trigger (the cross) are all present. Entry $2,412.40 on the retest, stop $2,409.60 below the sweep wick, first target the range high at $2,421 (3R), where the RSI touches the upper band and the band touch is the momentum exit for half; the rest trails under the 15-minute structure toward the previous day's high. The TDI added nothing to the location — the sweep and the block did that — and everything to the timing: without the cross, the entry would have been a bar earlier, inside the sweep.
The TDI checklist
- Higher-timeframe bias set from structure, not from the TDI.
- A location: order block, swept level, ranked line.
- RSI on the correct side of 50 for the direction, or turning through it from a band.
- Signal line above the base line for longs (below for shorts), or crossing.
- Trigger: RSI crosses the signal line at the location.
- Bands not squeezed flat — if they are, wait for the expansion bar.
- Stop beyond the location; momentum exit on the first opposite band touch; structure exit for the remainder.
- Journal the TDI state at entry; after fifty trades, drop the states that did not pay.
Reading divergence on the TDI
Because the price line is a standard RSI, it diverges the way an RSI does: price makes a higher high while the TDI's RSI makes a lower high (bearish divergence), or the reverse. On the TDI the divergence is easier to see because the bands frame it — a lower RSI high that fails to reach the upper band while price prints a new high is the clearest version. Divergence is a warning at a level, not a trigger: the trigger is still the signal-line cross that follows.
One pane, three reads: the RSI for momentum, the signal-over-base cross for its trend, the bands for its volatility. Take the trigger only at a level structure already gave you, only on the correct side of 50, and never when the bands are squeezed flat. The TDI is the timing; the location is the trade.
◆ Interactive check
Do you know the pane?
Questions traders ask about the TDI
The published defaults: RSI 13, signal MA 2, base MA 7, bands 34 at 1.62 deviations, levels 32/50/68. Change the RSI period to 8–10 only for scalping.
Yes — several community versions are in the public library under "Traders Dynamic Index"; check that the one you add uses the standard construction (RSI with two MAs and Bollinger Bands on the RSI).
Standard versions do not; every element is computed from closed RSI values. A version that uses a higher-timeframe request without confirmation can, so read the code.
Yes, with the RSI period shortened to 8–10 and the 50 filter kept: the RSI/signal cross above 50 at a level is a fast trigger, and the band squeeze warns before the opening move.
A slang name for the RSI spiking out of the upper or lower band and snapping back inside on the next bar — a momentum exhaustion read that often precedes a reversal at a level.
Zeno and the free indicators give the location — the order block, the sweep, the level; the TDI is a momentum filter you can add for the trigger. The Zeno Oscillator is our own momentum layer with the same purpose.
Dean Malone, in the early 2000s, as a single-pane combination of RSI, its moving averages and Bollinger Bands on the RSI; the construction has not changed since.
Any, because the RSI is bounded; the squeeze is most reliable on 15-minute to 1-hour charts into the London and New York opens, and the signal/base cross on the daily is a swing bias.
It can, and most people who do lose to the range — the TDI has no location. Pair it with structure: the level is the reason, the TDI the timing.
Conventionally the base line (the 7-period MA of the RSI); the green line is the RSI, the red the signal line, and the blue lines the bands — colours vary by version.
Yes; widen the band deviation to 2.0 on 1-hour to 4-hour charts to reduce band touches in the noisier market.
Zeno gives the location; the TDI is a momentum filter you can add for the trigger. The Zeno Oscillator is our own momentum layer with the same purpose.
References & Related Guides
Read next
- RSI Indicator: Complete Guide
- Bollinger Bands: Complete Guide
- MACD Indicator: Complete Guide
- Stochastic Oscillator
- Choppiness Index
- Liquidity Sweep Trading
- Liquidity Sweeps (free indicator)
- Zeno — the premium engine